Labour and the dairy debt

It often isn’t clear quite what the Labour Party means.  Andrew Little is reported as follows:

Little said the banks needed to be “stiff-armed and told we’re not going to see, wholesale, farmers pushed off the land”.

His only argument for this sort of intervention –  whatever it means in practice –  appeared to be that

“We expose more New Zealand farm land to the risk of overseas ownership and I think that is a matter in which there is a national interest the Government should be alert to, and take action on.”

Which all sounds quite dramatic, and yet what follows seems like a rather damp squib.

A summit should be called and dairy cooperative Fonterra should be at the table. Farmers needed to agree on a long term plan for the cooperative to move its products up the value chain, even if that meant taking less cash out once the immediate crisis was over, to allow Fonterra to invest to generate better long term returns.

Government assistance should be provided to get farmers over the crisis, in a similar way to the help offered during drought, but it did not need to be any more than that.

So, apart from more talk, what is Labour actually proposing?

Keen as any individual bank might be to be rid of some of the more questionable exposures in its dairy book, it seems unlikely that banks, as a group, will be that keen on precipitating large scale exits from the dairy industry.  Force one farmer to sell and there won’t be any material impact on the value of dairy farms more generally.  Try to force several thousand to do so, and (a) it will be next to impossible to find buyers in the short-term, and (b) the value of the collateral banks hold could collapse.  The Reserve Bank talked last week of an extreme scenario in which dairy farm prices fell by 40 per cent, but in an illiquid market like that for dairy farms there is no reason why land values should not fall by much more than 40 per cent if serious stresses were to develop.   No one really knows what dairy land is worth in the longer-term (where will oil prices settle, where will the New Zealand real exchange rate settle are just two of the many relevant questions) but it is the sort of market where it is quite easy to envisage a severe overshoot.  I’ve been tantalized for several years by parallels to some of the very illiquid mortgage-backed products in the US –  not the ones that eventually saw huge defaults, but the ones where prices massively overshot in a climate of fear and illiquidity.

If each bank would prefer to be rid of some of its dairy exposures, each of them also knows that farm lending is going to be a major area of credit exposure in New Zealand for decades to come.  It isn’t like lending to, say, a new industry which comes to nothing and goes away.  If some individual farmers will leave the industry, the rural sector will still be around and collective memories can be powerful forces for good or ill.  Banks were scarred by their experiences in the last major rural debt shake-out  in the 1980s, and I doubt they will be eager to burn off goodwill among future potential clients.  That doesn’t mean there won’t be forced sales, but it is hard to envisage the major rural lending banks rushing for the door  (no matter how much unease the risk departments of bank HQs in Sydney or Melbourne or Utrecht might be feeling).

In some ways, a more concerning scenario for banks might be borrower panic.  If enough farmers concluded that they were working for nothing and that there was no prospect of serious relief in the next few years they could, one by one, just choose to (try to) exit the industry.  Of course, they’d still have to find buyers, but in a climate like that collateral values could collapse anyway.  From the perspective of banks, it may be preferable if most farmers doggedly fight to stay on the land, allowing banks to make the calls on who to sell up and when, having regard to the potential impact on the rest of their national dairy portfolios.  No individual farmers cares much about that.

But I still have no idea what, if anything, Labour is proposing the government or the Reserve Bank should do to “stiff arm” the banks, to prevent widespread sales.  I’m pretty sure there are no existing legal powers that could appropriately be used for that purpose.  Of course, behind the scenes all sorts of threats and pressures could be brought to bear, but surely that isn’t how we want to country to be run?    So if Labour’s call means anything much they must be talking of new special legislative provisions.    There was a great deal of resort to such measures in New Zealand during the Great Depression of the 1930s –  allowing writedowns of loans, and of interest rates. Perhaps one could mount an argument for those interventions –  on a basis of a totally unexpected collapse in the entire price level, an issue in macroeconomic mismanagement  –  but what would the case for intervention now be?

It seems pretty clear that any dairy debt losses are not likely to be large enough to threaten the health of the financial system –  especially, as this is a slowly developing situation in which banks have plenty of time to bolster their capital buffers if that is required.   And to bailout individual farmers, or the sector as a whole, would represent a material new source of moral hazard –  a message to borrowers that they need not bear the consequences of their bad choices.  That would only increase future demand for debt –  in an industry that seems likely to continue to face considerable output price fluctuations

Of course, it may be that there is nothing much to Labour’s call at all –  other perhaps than a desire to be heard.  I’m not a fan of government assistance to farmers experiencing drought conditions –  if managing weather risk is not one of the things farmers have to do, I’m not sure what is –  but if Labour is talking of things only on that scale then I probably couldn’t get too excited.  Then again, action on that scale doesn’t seem likely to make the sort of difference that would prevent “wholesale” exits and large scale increases in foreign land ownership.

Perhaps that “foreign land ownership” issue is really at the heart of Labour’s call.   I’m not an absolutist on foreign ownership of land.  After all, to be blunt, large scale English purchases of New Zealand land in the 19th century –  even if mostly, individually, on a willing-buyer/willing-seller basis, did rather dramatically and permanently change the character of the country.    But in the current situation we seem very far from that sort of risk.  And in the shorter-term, the best hope for embattled farmers, and lenders, is the presence of a contested market of keen potential buyers.

And what of the call for a summit?  It seemed like a pretty tired old suggestion, and it isn’t obvious what the role of the government is in such industry issues.  We’ve heard endless talk over the years of “moving up the value chain” and farmers (the Fonterra owners) might reasonably be sceptical of the results to date.   But summits about long-term industry strategy don’t seem that relevant to the issues of the current overhang of farmer debt.

Do I have any sympathy for indebted dairy farmers?  Yes, to some extent.  There are individuals and families involved, and the stresses –  as in any struggling small to medium business –  must be pretty intense and hard to cope with.  It isn’t something those of us who spent our working lives as government officials never face.  Then again, the upsides in the good years are also pretty extreme.  Running a leveraged business is a high-variance operation.

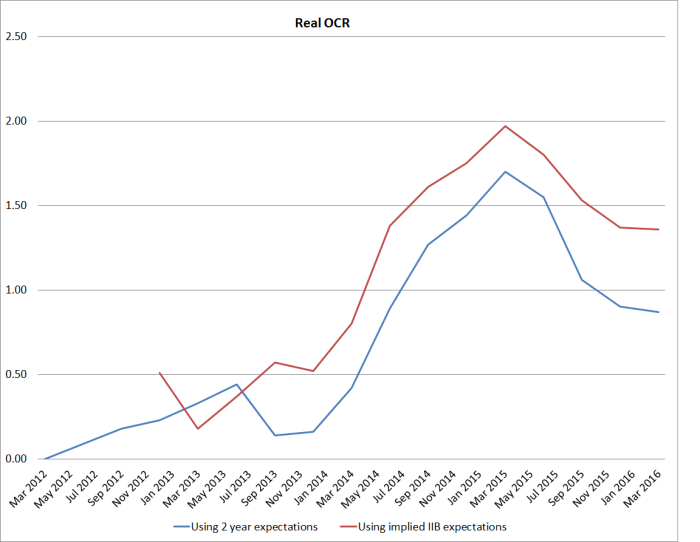
Cyclically, of course, farmers would be somewhat better off if we had a Reserve Bank that was doing its job better.  With core inflation probably around 1 per cent, and real interest rates higher than they were a couple of years ago (and real retail rates probably higher than they were at the start of the year), there is simply no need for the OCR to be anything like as high as it is now.  The OCR isn’t, and shouldn’t be, set with a view to supporting dairy farmers (or people in any other specific sector) but an OCR more consistent with the Bank’s own Policy Targets Agreement would (to a small extent) ease farmers’ financing costs and be likely to result in an exchange rate rather lower than it is now.  We saw the impact of last Thursday’s surprise (itself mostly a timing surprise).  It isn’t obvious that the OCR at present needs to be any higher than 1.5 per cent.  At that level, we’d be likely to see the exchange rate quite a bit lower again, and every cent off the exchange rate raises the prospective payout to diary farmers, materially affecting prospective profitability of people in the industry.  Not many farmers probably did contingency plans in which the TWI would still be above 71 even with WMP prices at current levels.

For the longer-term, if governments want to focus on more structural issues, there is a whole range of policy measures which help and hinder the dairy sector.

The ability to import large numbers of foreign dairy workers acts as a direct subsidy to the industry –  holding down industry-specific wages rates – and has probably largely been capitalized into rural land prices.   Water quality rules have been being tightened, but the ability to pollute, and pollute without paying, is another subsidy to the dairy industry.  Subsidised irrigation schemes go in the same direction.  None seems well-warranted.

And on the other hand, all tradables industries in New Zealand suffer from our very large scale immigration programme.  Whatever monetary policy is doing, the resulting quite rapid growth in the population keeps upward pressure on the real exchange rate, driving up the price of non-tradables relative to the (largely fixed) global price of tradables.  That makes it harder for firms operating here to compete in international markets, and helps explain why the per capita output of the tradables sector as a whole is no higher now than it was 10-15 years ago.    We shouldn’t be reorienting our immigration programme around the short-term needs of particular industries, but the biggest single factor New Zealand has some control over that would help the dairy industry at present would be a lower exchange rate.  A much lower immigration programme would, among other things, achieve that.  It might also allow a more hard-headed longer-term conversation about some of those industry subsidies.

Inflation forecast errors

The Reserve Bank included this chart in a prominent place (the end of the policy chapter) in the Monetary Policy Statement.

forecast errors

They never explicitly state, but clearly want us to notice, that the Reserve Bank’s errors have been a little less than those of each of the other twelve forecasters. (And we might be curious who forecaster L was.)

It would have been more helpful if the analysis from which this chart was drawn had been published with the MPS, rather than simply being described as “forthcoming”.  I’m a little sceptical of exercises of this sort, especially ones covering such a short period (three years of forecasts, which in the case of two year ahead forecasts means not even two non-overlapping observations), but it is consistent with the impression I developed sitting round the monetary policy table during that period: the Reserve Bank was constantly expecting inflation pressures to pick up, but most other private forecasters expected either more inflation  or more interest rate increases than we did.  We were wrong, but they were more wrong.

But I was a little curious.  The Reserve Bank was at pains to tell us that their modelling suggests long-term private inflation expectations are still  well-anchored at 2 per cent.

For two-year ahead forecasts, the RMSE for the Reserve Bank’s forecasts was 1.29.  If the Bank had simply forecast that inflation would have been at the midpoint of the target, each and every two year-ahead forecasts, their error would only have been 1.22.  Other forecasters must all have been projecting outcomes even further above the midpoint, on average, than the Reserve Bank did.

Here are the Bank’s two-year ahead inflation forecasts done over 2011 to 2013 and the associated inflation outcomes.

rb errors

It isn’t a pretty picture.

The Reserve Bank would no doubt respond that its medium-term inflation forecasts will always be near 2 per cent –  the interesting information is really in their view of what interest rate will be required to keep inflation around 2 per cent.     But we know they’ve been persistently too high on those forecasts as well – albeit perhaps less so than the private forecasters.

One other problem with the analysis is that there was a “regime change” halfway through the period.  A new Governor took office, and the 2 per cent midpoint was added to the PTA.  Private forecasters had previously often operated on the (empirically reasonable) assumption that the Bank had been content for inflation to settle in the upper part of the inflation range, and may have been forecasting on that basis.  The Reserve Bank couldn’t credibly produce those sorts of forecasts –  at least when inflation was already near 2 per cent –  so it might in part be just luck that made the Reserve Bank’s errors less than those of the private forecasters.

But as a reminder, when the Reserve Bank asserts that longer-term inflation expectations are securely anchored at 2 per cent, it is relying on forecasts produced by exactly the same set (or a subset of this group) of private forecasters.  Since they were producing worse forecasts than the Bank’s own poor forecasts in recent years, it is a mystery to me as to why we should take any comfort from their views of what inflation might be over 10 years –  a subject to which they probably devote little effort, and have little expertise or incentive to be right.  Perhaps the other “forthcoming” papers will shed light on that puzzle too?


Retail interest rates and the OCR

Various media outlets over the last day or so have asked for my views on whether banks will, or should, pass through yesterday’s 25 basis point cut in the OCR into lower retail rates.

My bottom line was

“I think there will be political pressure on the banks to cut to some extent, but I’d be surprised if it [any cut in floating mortgage rates] was anything like 25 basis points.”

It didn’t even seem a terribly controversial point.

After all, the Reserve Bank had included this chart in the MPS yesterday

funding costs

And they could have included one of credit default swap spreads for Australasian banks (as per this one at interest.co.nz).

The Bank even commented in the MPS that:

the cost of funding through longer-term wholesale borrowing has risen with the pick-up in financial market volatility (figure 4.3). The increase in longer-term wholesale costs this year adds to the increasing trend since mid-2014, which reflects a mix of global regulatory changes, concerns about commodity markets and emerging economies, and broader financial sector risks. To date, strong domestic deposit growth has limited the need for New Zealand banks to borrow at these higher rates. However, acceleration in credit growth over the past year might increase banks’ reliance on higher-cost long-term wholesale funding, leading to higher New Zealand mortgage rates.

It has been a commonplace in the recent Australian discussion that unless the Australian cash rate is lowered higher mortgage rates seem quite likely because of the rising funding spreads.

And so I was slightly taken aback to see the Governor, and his offsiders, quoted as having told Parliament’s Finance and Expenditure Committee that

“I’d expect the floating rates to come down by 25 basis points,” Wheeler told the select committee.

and that

“Banks are only raising a relatively small share of their funding from overseas at this point in time. They’re continuing to see very strong deposit growth. Most of the credit expansion that’s going on has been funded through deposits,” Hodgetts said.

Central bank governors aren’t there to provide defensive cover for banks’ pricing choices, but neither should they be winning cheap popularity points in front of committees of politicians by calling for specific cuts in retail interest rates that don’t even look that well-warranted based on their own analysis (eg the MPS quote above).

Bernard Hodgetts, head of the Bank’s macro-financial stability group, argues that rising offshore funding costs aren’t really relevant because banks haven’t raised much money in those markets recently.  But surely he recognizes the distinction between average costs and marginal costs?    For the banking system as a whole, the place where they can raise additional funding –   much of which has to be for term, to satisfy core funding ratio (and internal management) requirements  – is the international wholesale markets.  And what banks would have to pay on those markets in turn affects what they are each willing to pay for domestic term deposits.

There isn’t a one-to-one mapping between rises in indicative offshore funding spreads and spreads of domestic terms deposits, but hereis a chart showing the gap between term deposit rates (the indicative six month rate on the RB website) and the OCR.

6mth TD less ocr

Unsurprisingly, it looks a lot like the indicative offshore funding spreads chart above.

And what about the relationship between floating mortgage rates and the OCR?  Here I’ve shown the gap between the floating first mortgage new customer housing rate and the OCR.  I’ve included yesterday’s OCR cut and assumed that banks eventually cut their floating mortgage rates by the 10 basis points the ANZ, the biggest bank, announced yesterday.

mortgage rates less ocr

The resulting gap doesn’t look particularly surprising.  The gap between mortgage rates and the OCR blew out during the 08/09 crisis when funding spreads and term deposit margins blew out. It came back from those peaks and has been fairly stable since –  narrowing a bit further a couple of years ago, when it looked as though funding spreads might continue to narrow (and when banks were trying to get loans on their books in face of the new LVR controls).  And now, perhaps, those spreads are widening out again –  as one might expect given the persistence of the rise in the offshore funding spreads.

All these points are really illustrative only.  I don’t have access to more precise data.  But as in any business, pricing involves some judgements.  Perhaps the political and customer pressures will mount and banks will find themselves having to pass more of yesterday’s OCR cut into lower retail lending rates than they would really like. But this is a repeated game.  Even the Reserve Bank expects one more OCR cut before too long, and many of the banks now expect at least one beyond that.  Over the course of the rest of the year, it seems likely that unless those international funding spreads start sustainably falling again, that retail interest rates will fall by less than the fall in the OCR.  It has happened before –  most notably in 2008/09 –  and will happen again.  And it works both ways: if funding spreads ever go back to pre-2008 levels, retail rates will fall further than (or rise less than) the OCR.  The Reserve Bank takes those factors into account when it sets and reviews the OCR every few weeks.

From my perspective, the prospect that retail rates might fall less than the OCR is neither good nor bad, it just is.  As in any business, costs are an important consideration in pricing, but retail mortgage banking is also a pretty competitive business.  Banks don’t need our sympathy, but we also don’t need populist anti-bank cheap shots.

The right answer for the Governor, asked by MPs whether banks would pass on the lower OCR, would surely have been something along the lines of  “That is up to them.  They operate in a competitive market, and they face a variety of cost pressures.  We’ll be keeping an eye on each stage of transmission mechanism –  between OCR changes and eventual changes in medium-term inflation –  and will adjust the OCR as required to deliver on the target set for us in the PTA”.

Really just the bare minimum

The Reserve Bank of New Zealand hasn’t had a good couple of years.  There was the  totally unnecessarily 2014 tightening cycle that was only slowly, and rather grudgingly, reversed.  More recently, we had the OCR cut in December that drove the exchange rate up, and then the Governor’s fairly strident (and defensive) speech early last month which convinced even most of the doves that he would take quite some convincing to cut the OCR again, only to move (and signal yet another easing) at the very next OCR review a few weeks later.   I don’t do on-the-record advance predictions of individual decisions, but I noted a few days ago to someone who asked that I thought a rate cut today was much more of a possibility than most of the local commentators, or market prices, were reflecting.  Nonetheless, today’s move was a pleasant, if mild, surprise.

And it is a surprise of timing, rather than of any sign that the Reserve Bank has really altered the way it is looking at things.  In the December MPS, with the OCR projected to stay at 2.5 per cent indefinitely, the inflation rate was expected to take two years to get back to the target midpoint.  And in today’s MPS, with the OCR projected to get quickly to 2 per cent and stay there indefinitely, the inflation rate is expected to take two years to get back to the target midpoint.    After so many years with inflation below the target midpoint, the Bank is still open to the charge one questioner at the press conference put to them, that they are running an asymmetric monetary policy –  quite relaxed about inflation below the midpoint of the target, but much less so about anything above the midpoint.  I don’t yet subscribe to that interpretation myself –  it is more a case of still having the wrong “model” of what is going on –  but I can understand those who see it differently.

Part of where they are going wrong is in the constant repetition of the claim that monetary policy, here and abroad, is very stimulatory.  In chapter one, the Governor again talks of “extraordinary monetary accommodation” overseas, and in chapter 2 he tells us he believes New Zealand interest rates are “very stimulatory”.    We can all accept that nominal interest rates, here and abroad, are low by, say, the standards of the previous 20 years.  But when interest rates aren’t much different than they have been for the now seven years since the worst of the crisis past, and all the while growth has been sluggish, inflation quiescent, and in most countries unemployment rates show no sign of labour markets overheating, it is difficult to know what meaning the Bank is attaching to phrases such as “very stimulatory”.  I know they are on record as believing that a neutral interest rate in New Zealand is 4.5 per cent, but if they really still practically believe that they most be some of the only people who do.  We know so little about neutral interest rates at present that it is simply unhelpful to talk of current policy being “very stimulatory”, especially if that view is feeding into the forecasts.  Probably all we can say is that policy is  easier today than it was yesterday.  But not even necessarily easier than three months ago.

I’ve pointed out before that, if anything, real interest rates (the better basis for any judgements) have been rising. not falling.  Here is the OCR updated to today, deflated by the two-year ahead measure of inflation expectations, for the last four years.

real ocr to march mps

One problem for the Bank’s story is that today’s OCR cut is barely enough to offset the fall in inflation expectations (on this particular measure or others) since the last MPS.  There is no cut in real interest rates over three months.   And as the Bank usefully highlighted, longer-term funding cost margins have been rising for some time.

funding costs

The Bank won’t want banks avoiding the longer-term funding markets –  a much larger share of longer-term funding was one of the useful post-2008 changes  – and so as things stand at present a cut or two in the nominal OCR may not be enough even to prevent real borrowing rates rising.   What has been done today is really the bare minimum that had to be done to avoid further amplifying the adverse consequences of past monetary policy mistakes.

I wanted to comment on three other aspects of the analysis or discussion in the MPS.

The first is around immigration.  At the last MPS the Bank made a fairly dramatic change of view.  They  explicitly shifted from the longstanding widely-shared view  –  supported by their own past published research – that the short-term demand effects of swings in immigration were generally greater than the short-term supply effects, choosing instead to adopt a view that either the demand and supply effects are roughly equal, or that the supply effects may even exceed the demand effects.  I asked for the background analysis or research supported this change of view. They flatly refused to release any of it (a matter currently before the Ombudsman). They said that they were preparing material in this area “with a view to publication” and I had wondered if ,say a new Analytical Note might come out today.  But there is still nothing –  no new publications, no substantive analysis in the MPS (nor even any recognition that the PLT data seriously understate what happened in the previous 2002/03 boom), just nothing.  It isn’t good enough, for a variable that is so important to short-term macro developments in New Zealand.

The second is around core inflation.  The Governor has gone out on something of a limb, explicitly relying on the sectoral core factor model measure of inflation to justify his stance.  As I’ve noted previously, it has been very unusual for the Bank to highlight any single core measure, and especially in key policy statements –  and yet the Governor has now done so in his January statement, in his February speech, and again in the press release today.  No analysis his been provided to support his preference –  and none of the market commentaries which have looked into the matter have seemed particularly persuaded.

In fact, it looks as though the staff don’t really buy into the Governor’s story either.

Here is the very sensible text from chapter 4 of the MPS

core inflation text

No mention of any priority being given to the sectoral core factor model.

And here is the chart (I’d previously highlighted how the Bank had used exactly this sort of chart when it introduced the sectoral core factor model to wider circulation).

core inflation chart

There are six measures in that chart.  The average of those six looks to be uncomfortably close to 1 per cent, the very bottom of the target range, and a very long way from the 2 per cent midpoint the Governor signed up for.

Rather more concerning than either of these points is the Bank’s repeated insistence –  in the text and at the press conference-  that longer-term inflation expectations are still “well-anchored at 2 per cent”   (not even “near” 2 per cent, bur “at” it).

They apparently have some new publications coming out soon on some of these issues, which will be welcome.  But for the moment, it isn’t clear quite what they are relying on for their view that there is no real problem with inflation expectations, let alone why they think that long-term inflation expectations (as distinct from something like a one to two year horizon) are what matter.  I discussed some of these issues here, noting that (a) very few people entered into fixed nominal contracts for any period remotely as long as 10 years, (b) that the longer-term survey measures relied entirely on economists’ forecasts.  Add to that the fact that, although the Governor said this morning that the Bank looks at market-based measures of inflation expectations, the implicit long-term inflation expectations derived from indexed and conventional government bonds get not a single mention in the entire document.    Those implicit expectations are currently just under 1 per cent –  on average, for ten years.

I’m not suggesting that these implicit expectations are a perfect representation of actual long-term expectations.  As I noted a few weeks ago, if forced to put a number on my 10 year ahead expectations, I might still say 2 per cent – recognizing that 10 years is quite a long time for conditions, and senior central bankers, to change.  But not to mention them at all seems like quite a stretch, especially when you rely instead on the expectations of a handful of economists.  And, as the Bank points out in a gotcha chart on page 8 of the MPS, if the Reserve Bank’s forecasts of inflation in recent years have been bad, those of other published domestic forecasters (ie the same economists whose inflation expectations they rely for support) have been even worse.

How much does any of this matter?

I suspect inflation expectations are less important, as some independent factor determining inflation, than the Bank or conventional wisdom would suggest.  But to the extent expectations matter they are those for 1-2 years ahead –  all now uncomfortably low.  Anything beyond that, except for bondholders, is largely of academic interest only.    But those shorter-term expectations are largely shaped by the recent trends in actual inflation.  In other words, expectations measures are a lagging indicator of something we’ve already seen (the trend in actual inflation).  The Bank has been somewhat spooked by the drop in shorter-term expectations and in a sense that is welcome –  a belated recognition that there was actually a problem with policy.  But to the extent that they so vocally continue to protest that nothing is really wrong over longer-term horizons, is a measure of how far they still are from really “getting” what has been going on. All else equal, we should expect core inflation to continue to surprise them on the low side.  They need to get inflation back up and keep it up, but there is still no sense of doing more than the bare minimum.

And three last points:

The Governor foreshadowed in his press conference an interesting issue of the Bulletin due out next week on the results of stress-testing of the dairy books of the five largest banks.  I will no doubt write about that in more detail then, but the scenario apparently involved three more seasons of a payout of around current levels, resulting inter alia in around a 40 per cent fall in dairy farm prices.  On that scenario, 44 per cent of dairy debt would be impaired, and 10-15 per cent would be in default.   If we assumed a loss given default of perhaps 50 per cent of the loan, the banking system could face losses of several billion dollars over a period of several years (especially once losses on other commercial lending associated with dairy regions were factored in) That is a lot of money, but it would not threaten the soundness of the banking system –  the capital of the banking system, at last report, was almost $36 billion, well above regulatory minima, and banks have several years to replenish any losses through other retained earnings or –  at a pinch –  by direct recapitalization from the parents.   It might seem not-very-extreme to do a stress test based on a continuation of the current payout, but equally it is difficult (although not impossible)  to believe that the exchange rate would remain anywhere around current levels if international dairy prices remained at current levels for the next few years.

Penultimately, the next time the Governor or the Minister of Finance tells you the economy has been moving along just fine, it might be worth digging out this chart from the MPS.

consumption pc

Consumption per capita showing almost zero growth over the most recent year isn’t an encouraging story.  As economists will tell you, the assumed purpose of economic life is to consume.

And finally, as I have noted to them, the Reserve Bank might want look to the security of its systems.  I had an email out of the blue at around 8 this morning-  most definitely not from someone in the Bank –  telling me that the sender had just heard that the OCR was to be cut by 25 basis points.  I have no way of knowing if it was the fruit of a leak, or just inspired speculation, and was relieved to see the foreign exchange markets weren’t moving, but it wasn’t a good look.


Think Big: where did all those agglomeration and immigration benefits get to?

Statistics New Zealand this morning released the annual regional GDP data.  My former colleagues at the Reserve Bank were never very keen on money being spent on producing this relatively new data –  it is nominal rather than real, and is only available with a fairly long lag.  The data are no use at all for short-term analysis of macroeconomic trends –  and of course it would be better if we had regional real GDP data, and real income data –  but there are plenty of other uses for even not-that-timely nominal data.   It has brought together the range of other regional data in a useful summary form, and provides us data back as far as the year to March 2000 (which conveniently coincides with the terms of last two governments).

To listen to much of the New Zealand debate in the last 20 years or so, you might suppose that Auckland has been the stellar economic performer.  After all, we often hear about the benefits of agglomeration, the importance of cities and so on (all of which are, in general, valid and important perspectives). Auckland is our one moderately large city, its population has continued to grow strongly, and central government –  in the form of an ACT Party minister – even created a single council to help realise all these benefits.   Population growth in Auckland in recent times has largely resulted from immigration (there has been a small outflow of New Zealanders from Auckland to the rest of the country).  And successive governments, advised by The Treasury and MBIE, tout the economic benefits of a high rate of immigration, under our skills-based immigration policy –  it is, we are told, a critical economic enabler.

Against that backdrop, the actual regional data look pretty disappointing, to say the least.

As a reminder, Auckland’s population (estimated at 1.55 million in the year to March 2015) is more than twice that of next largest region (Canterbury).

And its population has been growing much more rapidly (more than twice as fast) as the population in the rest of New Zealand.

population growth since 2000

As one would expect, nominal GDP per capita is higher in Auckland than in most other regions –  but it is only third highest, behind Taranaki, somewhat “artificially” boosted by oil and gas production at high prices in recent years, and Wellington.  In the most recent year, Canterbury’s GDP per capita is about the same as Auckland’s – but that is no doubt a temporary rebuild-related phenomenon.

And the trend has been going against Auckland, despite (?) all that rapid population growth.  Here is a chart of Auckland per capita GDP divided by the GDP per capita of the median region in New Zealand.  It is a bit noisy from year to year –  Auckland looks to have done quite badly during the 08/09 recession and regained a little ground since –  but the trend has clearly been modestly downwards (compare the latest observation with one from 10 years ago).

nom gdp pc akld vs rest

And which regions have done best?  Well, here is the percentage growth in nominal GDP per capita, by region, for the 15 years to the March 2015 year.  (The picture for just the last 10 years is pretty similar – although Wellington has done notably better in that subperiod.)

nom gdp pc by region

Of course, these are GDP per capita measures, and the age structures of regions do differ.  But it doesn’t look as thoough that helps much.   The labour force participation rates in Auckland and the rest of the country are almost identical (a higher labour force participation rate  helps boosts GDP per capita in Wellington).   Working age population as a share of total population is a little lower in Auckland than in the country as a whole, but over the 15 years for which we have data the working age population share has changed by much the same amount in Auckland as in the country as a whole.

Perhaps there are good answers to why Auckland appears to have underperformed –  not over a year or two, but over 10 or 15 years –  that would leave intact the story about the gains to New Zealanders from a large scale immigration programme, and the emphasis on the centrality of our largish city, Auckland, to New Zealand’s overall economic success.

But for now, it just seems to add to the increasing number of straws in the wind that suggest that the whole population and immigration-based approach to economic policy  –  and our immigration policy is one of the largest discretionary levers of government economic policy – is flawed.  Productivity growth has been consistently poor, tradables sector production per capita has recorded no growth in a decade, and our largest and fastest-growing city (in both cases, by some considerable margin) has been recording lower per capita growth than most of the rest of the country, and average incomes in Auckland have, if anything, slowly been converging towards the median.

An alternative narrative of New Zealand’s economic performance and policy, of the sort I have been running now for several years, would find little or none of this surprising.  Disappointing yes –  this is our country’s prosperity, and the future of our children –  but no more surprising than the failure of other flawed economic strategies in the past, here and abroad.  Our immigration programme for the last 25 to 30 years might better be reassigned the label once given to the ambitious, deeply flawed, energy projects of the early 1980s, Think Big.  Like that programme, it was put –  and kept – in place by well-intentioned people, genuinely seeking the best interests of their country.  But like the earlier Think Big, this one has failed, and goes on failing.  Outcomes matter a great deal more than good intentions.


Two unrelated comments

The New Zealand tourism industry has been having a good year.  One particular source of strong growth has been visitors from China, but I’d noticed reference to something similar in the Australian visitor data.  That got me curious about how the two countries’ industries had done in attracting Chinese visitors, not just over the last year or so, but over the decades.  This was the resulting chart.

china visitors

It simply takes rolling annual totals of short-term visitors from China to each country back to 1991, when the easily accessible Australian data start.

New Zealand has enjoyed a good year or two relative to Australia.  It is just a shame about the poor decade –  really the story of New Zealand’s tourism sector more generally.  Visitor numbers from China to both countries have been trending strongly upwards over the whole period (Chinese visitor numbers to New Zealand last year were more than 100 times those for 1991), but for at least the last 15 years New Zealand has done worse than Australia in attracting new Chinese visitors.  Yes, there has been quite a recovery in the last year or two, but that just takes New Zealand’s share of the market, relative to Australia’s, about back to where it was in 2007, and still a long way below our peak relative performance in 2003.

Tourism plays a larger share in New Zealand’s economy than it does in Australia’s, so success in tapping new markets looks like it should matter a bit more to us than to them.

On a totally unrelated matter, while I was playing around with the visitor data a reader kindly sent me a copy of, veteran political columnist and commentator, Colin James’s column yesterday from the Otago Daily Times.  Headed “Are English and Wheeler drifting out of date?”, it is another rehearsal of lines as to why the OCR should not be cut further.  It would bore me, and probably bore you, to go through all the weak points in the argument.  On the domestic side, suffice it to point out that per capita GDP growth has been weak not strong, a 5.3 per cent unemployment rate is disconcertingly low not a sign of an overheating labour market, and how 7.5 per cent credit growth qualifies as particularly “strong” in a economy that has 2 per cent population growth, a 2 per cent inflation target, and aspirations to some reasonable productivity growth is a bit beyond me.

But my main reason for commenting was that James also advances the line that somehow the world is a great deal better off than the statistics suggest, that technological revolutions are driving upwards our living standards and pushing prices inexorably downwards, and there really isn’t that much to worry about.

The problem with the story is that there just isn’t much evidence for it.  In the aggregate data, as I’ve highlighted before, it is clear that productivity growth has slowed, not accelerated, and that that slowdown was already underway before the ructions around the financial crises and international recessions of 2008/09.  This was a chart I showed a week or two back –  the blue line is the median TFP performance for the old advanced countries (in Europe, North America, and Oceania).

tfp conf board

And here was the data specifically for the US business sector

fernald

But don’t just take it from suggestive top-down charts. Various experts have been looking at whether any material mis-measurement issues, especially around the tech sector and tech products, can explain away the productivity slowdown.  The short answer is that they can’t.  Many readers will already have seen Tyler Cowen’s summary of these papers, and for those who haven’t I’d encourage you to check it out.   As he notes

…the countries with smaller tech sectors still have comparably sized productivity slowdowns, and that is not what we would expect if a lot of unmeasured productivity were hiding in the tech industry

John Fernald, at the San Francisco Fed, does the business sector TFP data in the chart above, and is one of the acknowledged experts in this area. In a new paper, out just a few days ago, Fernald and co-authors conclude

After 2004, measured growth in labor productivity and total-factor productivity (TFP) slowed. We find little evidence that the slowdown arises from growing mismeasurement of the gains from innovation in IT-related goods and services. First, mismeasurement of IT hardware is significant prior to the slowdown. Because the domestic production of these products has fallen, the quantitative effect on productivity was larger in the 1995-2004 period than since, despite mismeasurement worsening for some types of IT—so our adjustments make the slowdown in labor productivity worse. The effect on TFP is more muted.

It seems pretty clear that there has been a real and material slowdown in productivity growth, and hence in the rate of improvement in underlying living standards.  The Fernald paper suggest that may partly be a return to more normal growth patterns, after exceptional gains in the 1990s, but whether that is so or not, it is no reason for complacency about inflation that undershoots targets.  Weak population growth and weak productivity growth both argue for low interest rates….and as a reminder, in New Zealander real interest rates (already high by international standards) have been rising not falling over the last couple of years.

real ocr

When contemplating tomorrow’s Monetary Policy Statement  don’t fall for the lines Colin James runs, channelling Graeme Wheeler, that monetary policy is “very accommodative”


Immigration and productivity spillovers

In the run-up to the release this month of the new book by Julie Fry and Hayden Glass, which appears to focus on the potential for the immigration of highly-skilled people to contribute to lifting New Zealand’s long-term economic performance and the incomes of New Zealanders, I was doing a bit of reading around the issue.

At issue here is whether, or under what conditions, immigration to New Zealand of highly-skilled people can lift not only the average productivity of the workforce in New Zealand (that seems quite plausible in principle –  think of a tech company simply relocating a particular research lab, staff and all, to New Zealand), but whether something about the skills those people have can translate into lifting the skills, productivity, and performance of the people who were already here.  Those sorts of “spillovers” are really what we must be looking for if we are serious about running a skills-based immigration programme, as some sort of economic lever or, in the government’s words, a “critical economic enabler”.    We can think about this in the context of New Zealand’s own history.  European immigration to New Zealand in the 19th century brought people from the world’s (then) most advanced, innovative and economically successful society to a country where the indigenous population had been operating at a level not that much above subsistence.  It would be astonishing if the European immigration had not raised average incomes of the people living in New Zealand (ie including the immigrants).  But it would have been a pretty unsatisfactory programme if it had done nothing to lift the productivity, skills and income of the native New Zealanders.

Fry wrote an interesting working paper for the New Zealand Treasury a couple of years ago reviewing the arguments and evidence on the economic impact of (more recent)  immigration to New Zealand.  But when I went back and had a look at that paper I was a little surprised at how little focused discussion there was of mechanisms by which such productivity spillovers might occur –  whether in generating more new ideas, or in applying better the stock of knowledge already extant – and how that might (or might not) have played out in New Zealand.

I also had a look at the old Department of Labour’s 2009 research synthesis on the economic impact of immigration.  They had a nice discussion on the possible link between immigration and innovation.  As they note, for some types of migrants to the United States there is reason to think that such spillovers might be material

The main mechanism in the United States appears to be the education of foreign graduate students rather than skilled worker immigration. The United States is the global leader in academic research, so the country attracts the top foreign students from across the world (positive self-selection). These account for most doctoral graduates (but there appears to be no crowding out of the United States born from research universities) and many of these foreign born doctoral students work in research and development (R&D) sectors in the United States, leading to a positive correlation between concentrations of highly skilled migrants and concentrations of patent activity.

Unfortunately, as they note, there is little evidence of such gains or spillovers in the limited New Zealand research.  That might reflect the fact that our actual immigration programme has not been very highly skills oriented at all (something the data make pretty clear), which could perhaps be changed by altering the parameters of the immigration system. Or it might reflect some things about New Zealand that cannot easily be changed: we are small, and remote, relatively poor, and have universities which typically don’t rank highly as centres of research, in contrast to the United States which is not just the “global leader in academic research”, but large, wealthy and more centrally-located.   And despite the recent surge in New Zealand exports of education services, that hasn’t been centred on our universities (it is a welcome boost to exports, but not likely to be the basis of any productivity spillovers to New Zealanders).

George Borjas is a leading US academic researcher on the economics of immigration and had a very accessible post up the other day looking at the question of productivity spillovers, and highlighting a range of quite recent and fascinating studies on some “natural experiments”.  One of the cleanest such experiments was the purging by the Nazi regime in Germany of Jewish academics (and research students).

In 1933, shortly after it took power, the Nazi regime passed the Law for the Restoration of the Professional Civil Service, which mandated that all civil servants who were not of Aryan descent be immediately dismissed. That meant that Jewish professors like John von Neumann, Richard Courant, and Albert Einstein were fired from their university posts. Many of these stellar scientists found jobs abroad, particularly in the United States.

Researchers have been looking at what the impact of these dismissals, and relocations, was on the productivity of those around them.  That included the impact on the productivity (published research output) of the graduate students (PhD candidates) of those the dismissed academics had been working with, the impact on the output of former colleagues of those who had been dismissed, and the impact on the colleagues that dismissed academics found themselves working with later (in the case of those who subsequently took up US academic positions).

This is perhaps the starkest chart from Borgas’s post, drawn from this paper,  illustrating the lifetime impact on the graduate students left behind.

borjas chart

There are clear signs of a material adverse long-term impact (the mirror image of the sort of positive productivity spillovers those promoting a high-skills immigration programme are looking for).  PhD programme supervisors can matter hugely.    But any impact on the productivity of former colleagues was much less visible.

In another paper, recently published in the AER,  looking at the impact on innovation in the US from the relocation of these displaced Jewish scientists, the authors find that the new recruits did not increase the productivity of existing US inventors, but encouraged greater innovation in the US as a whole by attracting new researchers to their distinctive sub-fields of research.

Borgas sums up his take on this series of papers thus

My take from all this is very simple: At least in the experimental context, the evidence that high-skill immigrants produce beneficial spillovers is most convincing when the immigrants that make up the supply shock are really, really high-skill; when the number of such exceptional immigrants is sufficiently small relative to the market; and when those immigrants directly interact with the potential recipients of the spillovers.

Or as he put it in another of his own recent journal articles looking at the impact of the mass emigration of Soviet mathematicians following the fall of the Soviet Union

Knowledge spillovers, in effect, are like halos over the heads of the highest-quality knowledge producers, reflecting only on those who work directly with the stars

I found these papers fascinating in their own right (nerd that I am) but they also prompt thought about what we can actually hope for in a New Zealand context.  Even if we get past the sick-joke aspect of New Zealand’s  allegedly skills-based immigration, and the disproportionate number of chefs, aged care nurses, and café and shop managers, what could we really expect to be able to achieve with the best possible skills-based programme?

It would almost certainly be a much smaller programme.  And it would have to aggressively target the very best people – not be content with people who just happen to creep above a points-threshold, artificially boosted by a willingness to move to some of the more remote and less economically promising parts of the country.

But then one has to ask how realistic any of this is.    With all due respect to our green and pleasant, and moderately prosperous, land, why would the very best people want to come to New Zealand, let alone stay here?    We had our own stellar academic refuge from the Nazis –  Karl Popper taught at Canterbury for several years – but even he didn’t stay that long.  We have adequate, but not great, universities –  and there are many better in countries with many of the good things New Zealand can offer.  We have modest academic salaries.  We have small home markets, small networks of people working in possible similar areas, and if global markets in principle can be serviced from anywhere, evidence still suggests people tend to do it from closer rather than further away.  We seem to have almost nothing of what 1930s Britain or the US could offer to the displaced German academics –  or certainly nothing that a wide range of other countries couldn’t offer more of, more remuneratively.

But perhaps Fry and Glass can make a robust and more optimistic case.  I’ll look forward to the book, and will no doubt write about it here.


English on the PTA

Some interesting comments from Bill English on inflation and the Policy Targets Agreement appeared in the media over the weekend.

The lead comment was

Finance Minister Bill English says he’s willing to wait for next year’s review of the Reserve Bank’s policy targets agreement (PTA) to consider whether it is still appropriate in a global economy where inflationary pressures have dissipated.

That seems appropriate.  We have a statutory structure which provides normally for five-year PTAs.  That provides reliable guidance to the Reserve Bank and some predictability for the rest of us.  We don’t have to worry that whenever people get a little uncomfortable about the inflation numbers, the target will be revised up, or down, on the fly.  The Reserve Bank should just get on and meet the target, whatever it is at the time.

And, as it happens, it is only 18 months now until the Governor’s term expires.  (Of course, one of the downsides of the current structure is that the Governor will soon be making monetary policy decisions, the full effects of which on inflation will not be apparent until after his term has expired.)

The Minister also noted

English said he was reluctant to prejudge the outcome of the review, which would include advice from the Treasury, but noted he hadn’t seen any compelling argument that the agreement itself could change or any particularly coherent alternative.

I don’t myself favour material change to the PTA, although I think that coherent arguments can be made for a variety of possible alternative approaches.  I doubt that a different way of specifying the target would have made much difference either during the boom years when the Reserve Bank had monetary policy too loose, or over the last few years when policy has been too tight.  The mistakes and misjudgements over the years have been either forecasting ones, or ones reflecting the private preferences of the successive Reserve Bank Governors –  probably mostly some combination of the two.

The Minister goes on to note that

“I think they’re in some challenging territory. We’ve got an agreement in place and we’re happy that they’re acting consistent with the agreement. We are not trying to second guess the decisions the governor should make.

Again, if we are going to have an operationally independent central bank in respect of monetary policy, ministers generally shouldn’t be trying to “second guess” or put pressure on the Governor.  Except, that is, to fulfil the PTA – or “do his job”.

The New Zealand system is relatively unusual in providing such a prominent structured role for the Minister of Finance not just in setting a target for the Reserve Bank, and having  responsibility for ensuring that the Bank meets the target.   The Bank isn’t meeting the target, and has not done so for some years.

The Minister claims that the Bank is “acting consistent with” the PTA.  It is shame that the journalists behind the story didn’t ask the Minister more specifically what he meant.  I suspect the Governor really would like to see inflation a bit higher than it is, and core inflation (reflected in a range of measures) might still be just inside the target zone.  Of course, the forecasts always show inflation heading back towards 2 per cent, sometimes rather slowly.  It is just that actual inflation –  even stripping out oil prices, tobacco taxes, ACC levies and so on –  just hasn’t done so.  A proper assessment of the Governor’s performance would surely require not just a judgement about the Bank’s intentions, but about their competence and their actions.  If we delegate a major function of public policy to an unelected technocrat and his staff advisers, we should expect a very high level of technical capability to be on display.  Year after year of missing the target doesn’t suggest they have been meeting that standard.  They neither seem to adequately understand what is going on, nor to have been willing or able to adjust for their (widely shared) difficulties in how they run monetary policy.   When you market yourselves as the technical experts, backed by a high level of public resources, the performance standard has to be higher than if, say, a mere elected politician had been making the interest rate decisions.

In fact, I think what the whole experience is highlighting again is the unrealism around the Reserve Bank governance model.  The idea was to make a single individual responsible for a clear and specific target, and to dismiss that individual if he or she missed the target.  It was never a realistic approach, at least if one wanted a reasonably sensible monetary policy.  That had already become apparent under Don Brash’s term, but the point has been reinforced in the last decade.

Under Alan Bollard the Reserve Bank consistently ran with monetary policy that was too loose to be consistent with the PTA –  through a combination of technocratic forecasting errors, and gubernatorial preferences (a great deal of angst about the tradables sector).  There was no serious pressure on the Governor to operate in a way more consistent with the target, and if anything the political pressure –  at the height of one of the bigger booms in our modern history –  was for easier policy not tighter.  And yet the Minister of Finance was the one responsible for the Governor’s performance relative to the PTA.

And in recent years the Reserve Bank has undershot its target –  a failure made more obvious by the explicit addition of the midpoint reference to the PTA in 2012.  It has been some combination of technocratic forecasting errors and gubernatorial preferences (a great deal of angst about the Auckland housing market –  or on a bad day, about specific suburbs in Hamilton or Tauranga).   There has been no serious pressure on the Governor to operate in a way more consistent with the target –  not even, we are led to believe, from the Bank’s Board – even though the unemployment rate has lingered uncomfortably high and the growth performance of the economy, in per capita terms, has been poor at best.  The Minister of Finance is the one responsible for ensuring the Governor’s performance relative to the PTA, and yet (at least while the polls run strongly) the Minister has no obvious incentive to suggest there is anything wrong or disappointing about New Zealand’s economic performance.

My point here is not mainly to criticize the Minister.  I don’t think he  –  or his Board – is really operating as the Act envisaged, but mostly that is a reflection of the unrealism of the statutory provisions.  Our Act gives a huge amount of power to a single unelected individual on the assumption that a high level of effective accountability is possible.  History suggests it is not possible.  There is too much imprecision, and any concerns too quickly become personalized.   We would be better off with an alternative governance model –  a more internationally conventional one –  in which less emphasis was placed on the ability to dismiss an individual, or more emphasis was placed on spreading and sharing the power that is delegated to an unelected body.  It would be less ambitious than what we have now, but more realistic –  offering more ongoing effective scrutiny, with less high stakes emphasis on a single person (strengths, preferences, failures and so on).   In my model, we’d have a Monetary Policy Committee, appointed by the Minister of Finance, with members subject to hearings before the Finance and Expenditure Committee before taking up their position, serviced by technical experts from the staff of the Reserve Bank, with stronger effective statutory transparency provisions, and with the Secretary to the Treasury as an ex officio (perhaps non-voting) member, would be a much better way forward.  It would complement a Financial Policy Committee responsible for the regulatory and financial stability functions.

A model of this sort would not give us perfect monetary policy –  perfection is a useless standard in almost any area of public life –  but it would better reflect what we now understand about monetary policy, and effective accountability, than the current 1989 provisions do.

Finally, I noticed that the Minister talked about how the review of the PTA next year would ‘include advice from Treasury”.  That is all very well and good.  But the Policy Targets Agreement is the major instrument articulating how short-term macroeconomic management should be conducted in New Zealand over the following five years.  These reviews have typically been conducted with a totally unnecessary and inappropriate degree of secrecy, both before and after the event (recall the Reserve Bank’s refusal to release material relating to the 2012 PTA).  As I noted earlier, I don’t favour material changes in the PTA, but the Minister might be more likely to be exposed to arguments or evidence for a different approach if he opened up the process to wider input beyond just the Reserve Bank and the Treasury.  Governments and government agencies engage in public consultative processes on all manner of regulatory and related issues, most of which are no more important that the monetary policy regime.  If the Canadians can run a fairly open process, producing and scrutinizing relevant research, it isn’t obvious why we can’t.  As the current Policy Targets Agreement expires just more than three years since the last election –  and the political consensus around monetary policy is no longer strong –  the sooner such a process was got underway the more likely it is that it would produce something offering persuasive insights, rather than the merely partisan.


Real food prices….and housing market activity

I stumbled on this chart yesterday.

fao chart

It shows the FAO’s food price index, all the way back to 1961, including a real series in which the nominal FAO index is deflated by the World Bank’s Manufactures Unit Value Index, “a composite index of prices for manufactured exports from the fifteen major developed and emerging economies to low- and middle-income economies”.   The FAO index itself is a weighted average of the international prices for cereals, vegetable oil, dairy, meat, and sugar.

Never knowingly optimistic, I was still a little surprised by the picture.  After all, a dominant story of the last 25 years has been one of falling prices of manufactures, driven in large part by the industrialisation of China, and reflected in (for example) sharp falls in the terms of trade for Japan and Taiwan.   And optimists around New Zealand have told stories about the growing global scarcity of water, rising Asian demand for high quality protein, and so on.   And yet on this measure real food prices –  the amount of manufactures a given amount of food commodities would purchase –  have been no better than flat.  If anything, at present prices seem to be moving back towards the lows of the 20 years from the mid 80s to the mid 00s.  And the dairy component doesn’t appear to have been behaving much differently than the other components of the index.

Of course New Zealand isn’t a low or middle income country, so perhaps this World Bank index isn’t representative of our purchases over time.  The WTO also has an index for prices of imports and exports of manufactures: it has only been running since 2005, and over that period prices of manufactures have increased less than those of food (as reflected in the FAO index).  Our own overall terms of trade  –  for a wider range of exports than food, and imports than manufactures – have still been quite good by historical standards (although even in the 1950s and 60s our incomes were drifting down relative to the rest of the advanced world).

merchandise tot

There appears to plenty of scope for productivity growth in agriculture (although there hasn’t been much in New Zealand in recent years), but there isn’t any more land being made here, and environmental/water concerns are limiting just how much more intensively existing land can be used.   For a country with a fairly rapidly growing population, that is still heavily dependent on its food exports, the prospects for sustained high incomes seems to rest on some combination of high productivity and high prices.  Or, of course, the rapid growth in other exports –  but over decades now that latter just hasn’t been happening.

On  completely different topic, this is one of favourite housing charts.

mortgage vols

It shows the number of weekly mortgage approvals (with a rough adjustment to turn it into a per capita measure) for each week of the year, numbering 1 to 52/53.  That deals with (a) the rising trend in the population over time (material over a decade), and (b) the fact that the data aren’t seasonally adjusted.

I haven’t shown a (hard to read) version with lines for each year for which the Reserve Bank has data.  But you can see how much more active the mortgage market was on average over the first decade of the data than it has been over the last few.  In fact, in 2007, the peak year of the previous boom the line was around .0025 at this time of year –  in other words, more than 60 per cent more mortgages were being approved per capita at this time of year in 2007 than was happening this year (or last year).

The housing finance is now, unfortunately, quite badly distorted by the Reserve Bank’s increasing range of direct controls, but there is just nothing in this data to suggest a frenzied speculative boom.  In such booms, volumes tend to be very strong –  not just new loans, but turnover per capita too.  There was a plausible story like that, backed by the data, in the previous boom from 2002 to 2007.  There hasn’t been, and isn’t, in the last few years.  Individual potential buyers have no doubt been very worried about missing out, perhaps permanently, but the main factors behind what strength there has been in house prices –  considerable in Auckland-  was the government.  It encourages rapid population growth through a liberal immigration policy, and at the same time is responsible for the legislative framework that makes urban land scarce and impedes the physical expansion of the city.  That seems that like a crazy policy  mix to me, but it isn’t a frenzied credit boom –  and isn’t obviously any sort of “bubble” either.  The definition of a bubble is rather elusive, but suggests something completely detached from fundamentals.  But government policy parameters are fundamentals.  They could change, but there is little or no sign of them doing so.

Why harp on the point?  In the lead-up to next week Monetary Policy Statement some of those opposing OCR cuts do so on the basis of house price concerns.  House prices aren’t in the Reserve Bank’s monetary policy remit, but in any case there is no sign of irrational exuberance –  whether by buyers or financiers –  driving what is going on.  Rising (and absurdly high) real house prices in some areas appears to be largely a relative price change, attributable to pretty easily identifiable structural factors.  Orienting monetary policy around the price of a good, itself largely shaped by government structural policy choices, would be even odder than orienting it around, say, the price of gold –  a product which, at least, governments did not directly influence the supply.

The other relevant consideration is the question of just how much difference monetary policy shocks, and adjustments to the OCR, actually make to house prices.  In support of its LVR policies, the Reserve Bank used their model a couple of years ago to argue that achieving the same impact on house prices as they expected to achieve using LVR restrictions, they would have to lift interest rates (relative to baseline) by around 200 basis points.   The LVR restrictions were expected to lower house price inflation by around 1-4 percentage points in the first year (the effect fading away thereafter).  Modelling house prices well isn’t easy, but if this Reserve Bank analysis is even remotely right it seems unlikely that further cuts to the OCR over the next few quarters of even 50 to 100 basis points, offsetting falling external incomes, falling inflation expectations and rising offshore funding costs, would materially affect the level of national house prices.


Immigration: political parties all seem pretty much on board

There is an interesting column on interest.co.nz today by David Hargreaves calling for the government to act to reduce the rate of immigration.  I’m generally quite sympathetic to his call, although much of his argument is focused on the shorter-term pressures that arise from large (and large fluctuations in) immigration flows, whereas my interest is primarily in the longer-term economic implications of high trend levels of non-citizen immigration.  But the column is headed “National is putting short-term expediency ahead of the country’s future”, and there I’m inclined to part company.

Yes, the National Party dominates the current government, and has supplied all the Ministers of Immigration since 2008.  But, by and large, they are following the same policy, apparently with same implicit beliefs about the benefits of immigration and of a larger population, that the Labour Party led government before them followed, and the National Party-led government before that.  Elite opinion in New Zealand has been strongly pro-immigration, presumably believing that it is in the interests of New Zealanders, for a long time.  What is at issue isn’t really “short-term expediency”, but long-term economic strategy and beliefs.

Elite opinion approves strongly of immigration, and is resistant even to any questioning of the approach, and yet those same people and institutions struggle to produce any evidence of the benefits.

The Secretary to the Treasury is very keen on immigration, and yet The Treasury doesn’t seem to have been able to find any evidence of benefits from New Zealand’s large scale immigration programme, and has been rather cautious about the extension of working holiday schemes.

MBIE and the Minister of Immigration continually runs the line that immigration in New Zealand is an “economic lever”, and yet when I asked for copies of their advice and analysis there wasn’t anything of substance there either.  There are assertions about possible benefits, and various theoretical arguments, but no evidence that New Zealanders have actually benefited from the evolving programme New Zealand has actually run.

The New Zealand Initiative think-tank seems keen on immigration, and yet when the chairman recently put out a piece on immigration, he subsequently acknowledged (see his comment in response to my piece) that there are no New Zealand studies that demonstrate the benefits to New Zealanders of New Zealand’s immigration programme.

Late last year, Mai Chen published a lengthy Superdiversity Stocktake report, some mix of immigration advocacy and marketing around how best to cope with the greater ethnic diversity that has developed in New Zealand over the last few years.  And yet, in the hundreds of pages, there was no evidence advanced that New Zealanders have been, or will be, made better off by the large scale immigration programme.  Chen referred to various papers supposedly showing benefits from diversity, but few adequately distinguished causal links and correlations, and several were not even dealing with ethnic diversity.  The one New Zealand paper cited –  a Department of Labour modelling exercise from a few years ago –  is generally accepted to be of the sort which generates benefits from immigration if first ones assumes benefits from immigration.  In other words, it simply does not shed light on the bigger question.  Here is a link to a recent commentary on the some of the articles Chen refers to.

So neither our leading government economic agencies, nor our academics, nor our think-tanks, nor immigration-advocacy groups have been able to show any material benefits from the large scale immigration programme, even after 25 years.  And yet the leading political parties for some reason continue to recite the mantras –   it is “critical economic enabler” we are told, but enabling what?

And while National and Labour are largely responsible, since they have led all governments in New Zealand for decades, most of the other parties don’t really seem that different.

Here is the Green Party policy.  It doesn’t get very specific, but also evinces no real discontent with the thrust of the immigration policy New Zealand has been running for 25 years.

New Zealand First often gets coverage for its comments on immigration.  They raise some concerns, some of which I think have merit, and others not.  But read the policy and it certainly doesn’t feel like a party advocating a far-reaching change of approach.

The Maori Party  apparently no longer has any references to immigration on its website (and there was nothing in the 2014 manifesto), but when I looked previously there was nothing suggesting any discontent (which has always puzzled me because, whatever the economic merits of immigration there is no doubt that each new wave weakens the relative political position of Maori in New Zealand).

United Future has an updated online manifesto, and its immigration policy (page 84) suggests no real discontent, and just suggests various tweaks at the margins.

And the final party in Parliament is ACT.  You might presume that they’d have been dead keen on immigration –  open markets in people as well as goods.    In fact, their website offers a curious mix.  On the one hand, the say

ACT is and always has been the pro-immigration party

But they must have had someone reading Reddell because a few sentences later they qualify this with

ACT is also committed to monitoring the emerging literature that suggests immigration may make the domestic population poorer through a process of capital widening

They have a whole page, which is fairly uniformly positive, but with that caveat.

It is quite remarkable that we’ve gone for 25 years with one of the largest scale planned migration programmes in the world, have no actual evidence of the benefits to New Zealanders of this programme, and all the time have continued our slow relative economic decline, and yet not one of the p0litical parties appears seriously uneasy about what is going on.  On the one hand, it is a testimony perhaps to the moderation of New Zealanders, and to the fact that we haven’t had lots of illegal immigration or Muslim immigration,  But as David Hargreaves notes in his interest.co.nz piece, our rate of immigration has been much more rapid than that of the United Kingdom, where it has become a major issue for debate (and over recent decades the UK economy has been materially more success than our own).

I was interested to see the generally left-leaning Bridget Williams Books has a new book out shortly, presumably next week,  in their BWB Texts series, on New Zealand’s immigration policy and practice.

Here is the publisher’s blurb.

Migration and the movement of people is one of the critical issues confronting the world’s nations in the twenty-first-century.

This book is about the economic contribution of migration to and from New Zealand, one of the most frequently discussed aspects of the debate. Can immigration, in economic terms, be more than a gap filler for the labour market and help as well with national economic transformation? And what is the evidence on the effect of migration not just on house prices but also on jobs, trade or broader economic performance?

Building on Sir Paul Callaghan’s vision of New Zealand as a place ‘where talent wants to live’, this book explores how we can attract skilled, creative and entrepreneurial people born in other countries, and whether our ‘seventeenth region’ – the more than 600,000 New Zealanders living abroad – can be a greater national asset.

It will be interesting to see what material, and arguments, the authors have to offer.   If it isn’t offering the evidence itself, perhaps it least it might contribute to a greater appetite for serious debate and analysis as to whether we, as New Zealanders, are benefiting from the evolving immigration programme in the way in which the elites seem to take for granted that we are.