When you are both a social and institutional conservative, and someone who believes in the central role of private markets in generating prosperity and supporting freedom, and yet live in one of most left-liberal electorates in the country you get used to being in a rather small and embattled minority.
In 2014 Rongotai had the fifth highest Labour+Greens share of the party vote (56.9 per cent, in an election in which those two parties together managed only 35.8 per cent across the whole country). And it was the second-best electorate for the Greens, typically rather more radical and subversive of society’s established institutions and symbols (“progressive”) than Labour: they polled 26.4 per cent of vote here (no wonder we got a dreadful cycleway), only a little behind their vote in neighbouring Wellington Central.
Out of curiosity, I went onto the Electoral Commission’s website yesterday to check out the Rongotai results in the flag referendum. Somewhat naively, I think I was assuming that perhaps 60 per cent of people here would have voted for the alternative flag. In fact, 62.6 per cent of people in Rongotai had voted to retain the current flag. The left-liberals must, in quite large numbers, have joined with the residue of conservatives to support retaining a flag that has been a symbol of our nation since 1902 (a time when we were governed by Dick Seddon, who deferred to no one in his assertion of our nationhood).
Or perhaps it was mostly just party politics.
Here are the 15 constituencies with the highest percentage vote for retaining the current flag
| 69 – Te Tai Tokerau | 78.5% |
| 67 – Tāmaki Makaurau | 77.5% |
| 66 – Ikaroa-Rāwhiti | 76.9% |
| 71 – Waiariki | 75.8% |
| 65 – Hauraki-Waikato | 74.2% |
| 68 – Te Tai Hauāuru | 73.6% |
| 23 – Māngere | 70.8% |
| 70 – Te Tai Tonga | 67.8% |
| 24 – Manukau East | 67.4% |
| 25 – Manurewa | 65.4% |
| 21 – Kelston | 64.8% |
| 8 – Dunedin North | 64.1% |
| 46 – Rongotai | 62.6% |
| 53 – Te Atatū | 61.9% |
| 9 – Dunedin South | 61.4% |
Not a single one is held by the National Party, or would even by marginal between National and Labour.
And here are the 15 constituencies with the highest percentage vote for the alternative design.
| 49 – Tāmaki | 51.9% |
| 48 – Selwyn | 51.7% |
| 2 – Bay of Plenty | 51.4% |
| 11 – East Coast Bays | 51.1% |
| 18 – Ilam | 50.8% |
| 6 – Clutha-Southland | 50.4% |
| 12 – Epsom | 49.8% |
| 52 – Tauranga | 49.7% |
| 33 – North Shore | 49.4% |
| 59 – Waitaki | 49.4% |
| 32 – New Plymouth | 49.1% |
| 57 – Waimakariri | 48.9% |
| 3 – Botany | 48.3% |
| 42 – Rangitata | 48.2% |
| 50 – Taranaki-King Country | 48.0% |
And not one of those seats is held by Labour, or would have been particularly marginal between National and Labour. (In case you are wondering, in John Key’s seat of Helensville, the vote for the alternative design was virtually right on the national average at 43.3 per cent).
Somehow the image of the voters of Selwyn or Clutha-Southland as radicals, keen to ditch symbols of nationhood, seems about as implausible as that of my Rongotai neighbours (or the students of Dunedin North) as conservatives.
Here is a scatter plot showing the Labour+Greens vote share in 2014 against the support for retaining the current flag, by electorate.
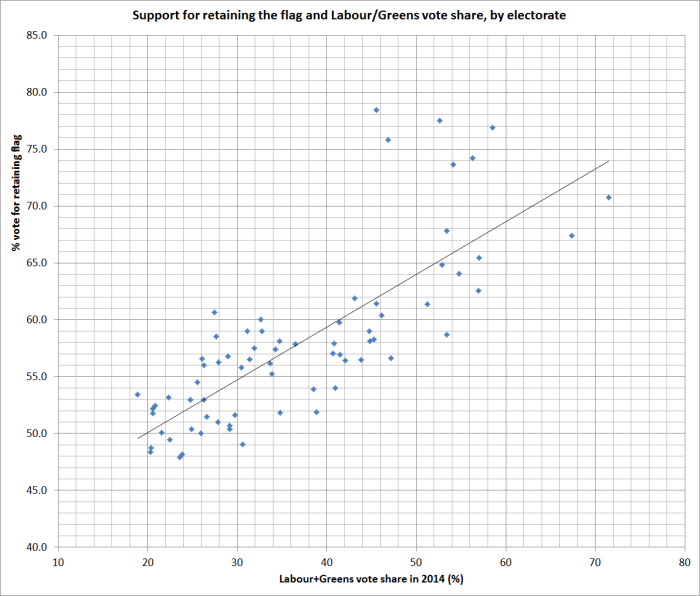
The outliers are the Maori seats, where (a) opposition to changing the flag was particularly strong, and (b) where the Maori Party vote matters.
But I was also fascinated by the turnout patterns. This chart shows turnout in the referendum and percentage support for retaining the current flag, again by individual electorate.
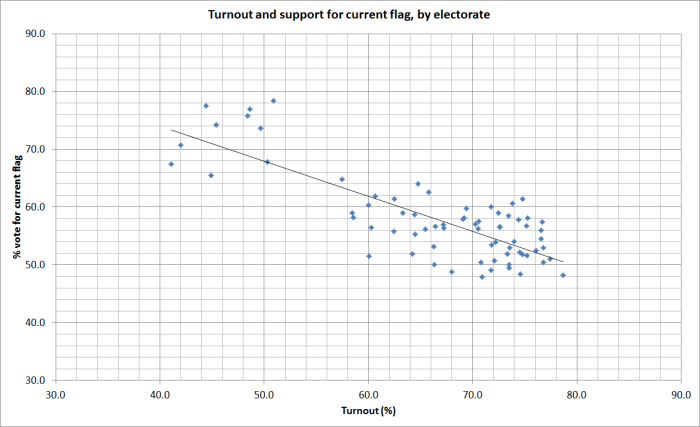
I was struck by how strong the downward relationship was. Electorates where people favoured the current flag were also those where people did not participate to anywhere near the extent they did in the electorates voting for change.
Some of that is no doubt just established voting patterns. Older richer whiter electorates tend to have higher turnout rates than younger, poorer, browner ones, and on this occasion this correlated with the pattern of votes on the flag. If the people who didn’t vote had much the same characteristics as those who did (and we have no way of knowing that on this occasion), then if the turnout had been similar across all electorates the margin for the current flag would have been larger (perhaps more in line with the handful of published opinion polls).
All in all, it ends up rather unsatisfactory. Decisions on symbols of nationhood – once in a hundred, or five hundred, year decisions – shouldn’t really split along party lines. Party votes shares come and go, but flags are pretty permanent.
On this occasion I’m fairly sure an underlying majority wasn’t in favour of changing the flag in the first place, and even among those who did really favour change many didn’t like the alternative design. So the final decision probably reflected underlying preferences, even if the actual debate/process did end up all too party-politicised.
I guess we have to blame the politicians for the politicisation. David Cunliffe first promised a referendum, and then John Key copied him, and went on to make the process as much about him as about us, New Zealand. He lost, despite having turned the conservatives radical and the radicals conservative. Very odd.
Perhaps now he could turn his attention to serious issues which really do require a lead from politicians, such as turning around our decades of relative economic decline.
“Alice laughed. ‘There’s no use trying,’ she said. ‘One can’t believe impossible things.’
