In my post yesterday on the new OECD Economic Outlook fiscal numbers I included this chart
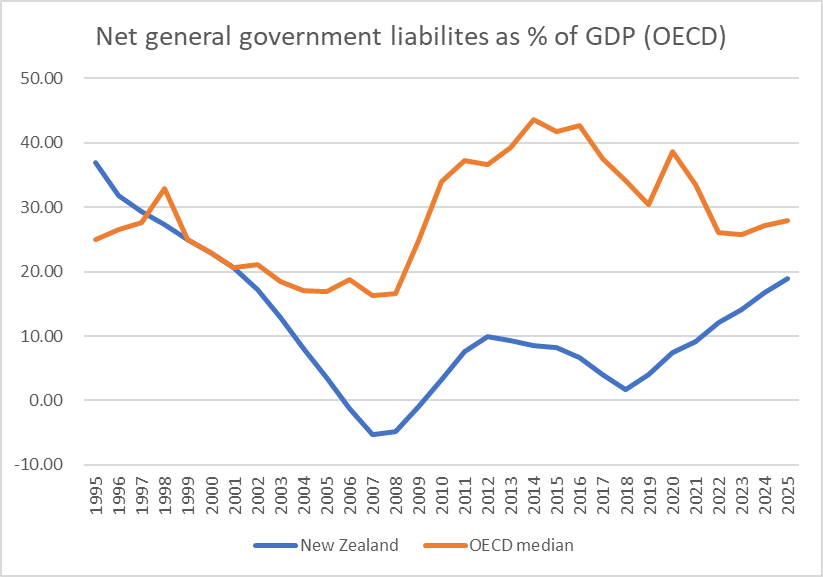
Even if you leave off the last two observations (OECD projections based on current – Labour government – fiscal policy) recent trends have hardly been something to take any comfort in. But at least we were still a bit less indebted than the median OECD country. But as I also noted in passing, the big OECD countries mostly were a lot more indebted than most of the rest.
I was talking this morning to my son – yes, a geeky economist-in-waiting- about the German constitutional “debt brake”. The great and the good in much of the rest of the world have been critical of this provision since it was put in place in 2009 – for the FT editorial view recently see here – and just recently a constitutional court ruling has created tensions that apparently may threaten to bring the government down. The rule stops German governments running material structural fiscal deficits, except in an emergency (Covid was, appropriately, treated as one), which I’ve long thought should be the benchmark fiscal rule our government should work to (yes, formally operationalising it is a challenge, given uncertainties about output gaps etc, but in principle a rule of that sort is a useful discipline).
The cynic in me has sometimes wondered whether other people disapproved of the rule because it showed up their own countries’ fiscal fecklessness. Here is a chart showing net general government liabilities for the group of large OECD countries.
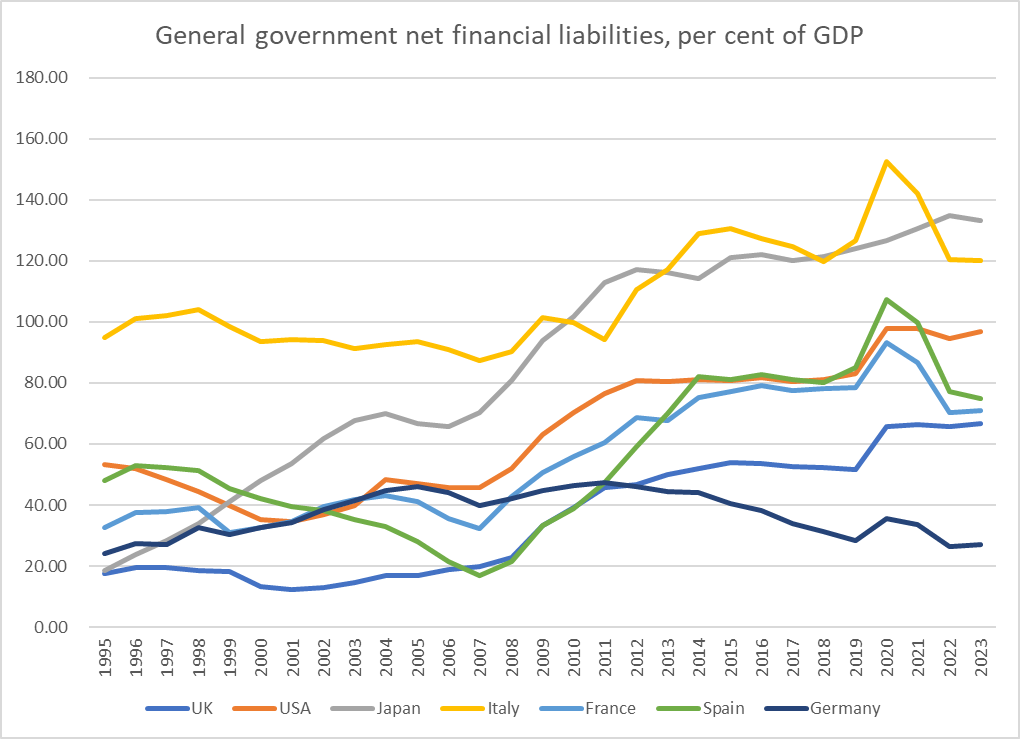
Germany’s public debt is not extraordinarily low in absolute terms – just a bit higher than New Zealand’s at present – but it is this only one of the large OECD countries to have kept the level of public debt (a) fairly low, and b) stable this century. Were I a German voter I would look favourably on that sort of record. Remember that such “brakes” do not stop governments choosing to spend more, they just require them to front up to the voters with additional tax demands now.
The group of large OECD countries is different. Here is another chart with the OECD countries for which there is data (not the Latin American ones,Turkey or Iceland) grouped as large (as above), medium, and small (population of about 10 million or less), and compared to New Zealand (also in the “small” grouping).
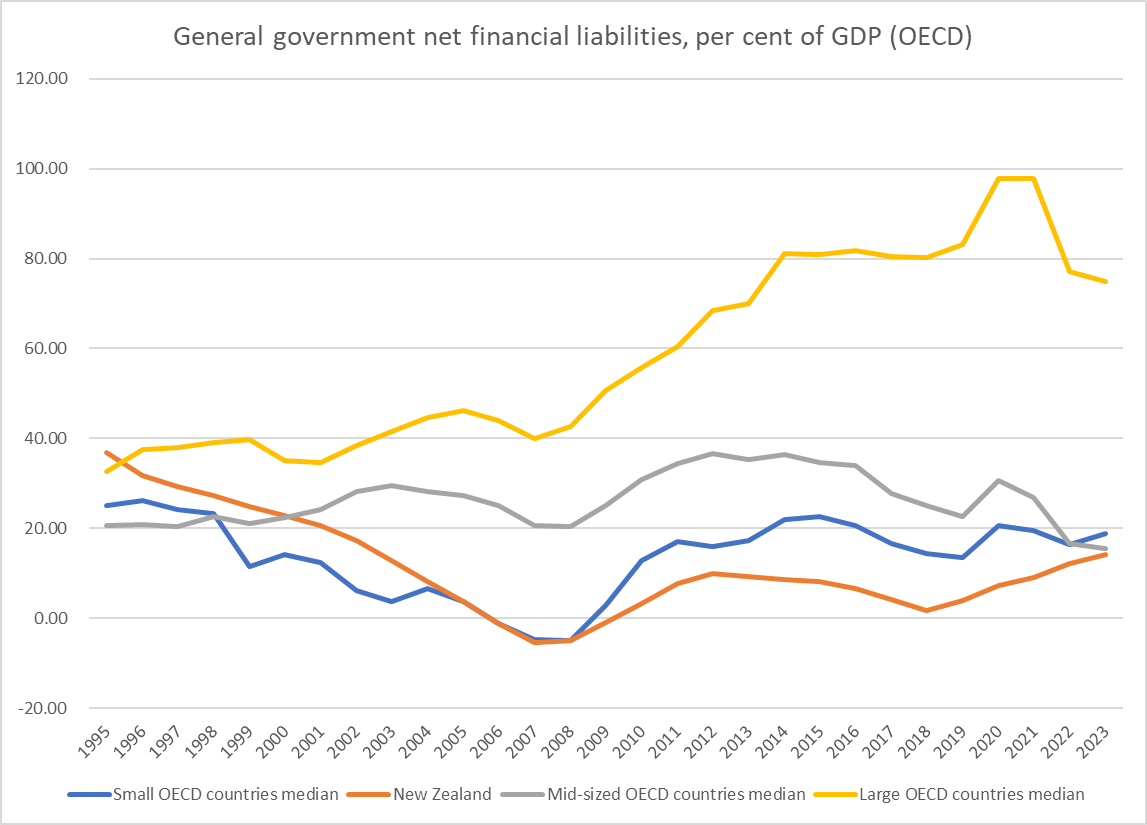
A couple of things caught my eye. First, when the comprehensive data start (1995) our debt was a bit higher than the medians for any of these groupings. 1995 isn’t really that long ago. Second, that group of large countries really is different. It isn’t that there aren’t other highly indebted countries – Greece is in the “small” grouping – but the small and mid-sized countries have typically run much lower (and more stable) public debt ratios than the large countries. And that isn’t because of some threat to the ability to borrow: both Japan and Switzerland are big net external surplus countries, and Japan has very large debt (and deficits) and Switzerland has net general government financial assets. it is, by and large, simply a series of political choices.
Third, all the debt ratios rose in 2020, through some combination of GDP taking a hit (lockdowns etc) and more spending being judged necessary appropriate. What makes New Zealand unusual is that our debt ratio has kept on rising even after the economy had recovered, Covid spending had ended, (and surprise inflation has reduced somewhat the ratio of debt to (inflating) nominal GDP).
And finally, of course, the convergence at the end of the chart. We used to run lower debt than the typical OECD small and medium-sized country – although we were never (not even in 2008, when 10 OECD countries had lower net debt) anywhere near the least indebted-country. But now we look pretty much like the typical OECD country, once one leaves out the feckless few (the big countries minus Germany plus Greece). If your inclinations are more leftist than mine you might think that is just fine – where I think it is regrettable – but in a country where much political and economic coverage is still focused on the US and the UK – it is a reminder that there isn’t now vast unexploited capacity to borrow, just to make us like some “normal” advanced country, rather than one characterised by Cullen/English alleged “underborrowing”.
And if in some senses we are just another small (underperforming) advanced economy, we are also one more exposed to natural disasters and the associated fiscal risks than most (Iceland is another, but not in this particular dataset).

Michael
NZ’s net Government debt may well be about the same as the smaller country median, but I wonder how that would look if you just measured debt provided by offshore lenders, especially in the local currency.
Tim
LikeLike
The debt buyout of Kiwibank now 100% owned by the NZ government would see Net debt levels rise if Bank Share values have tumbled in recent years.
LikeLike
The differentiation with the NZ Quantitative Easing and the US or Australia or European QE is that the NZ government after the pandemic ended up owning a bank outright.
LikeLike