Back in the far flung days – well, really only just more than two years ago – the National Party went to the election with a fiscal plan under which the government’s operating deficit would have been more or less closed by now. This was the table from that plan.
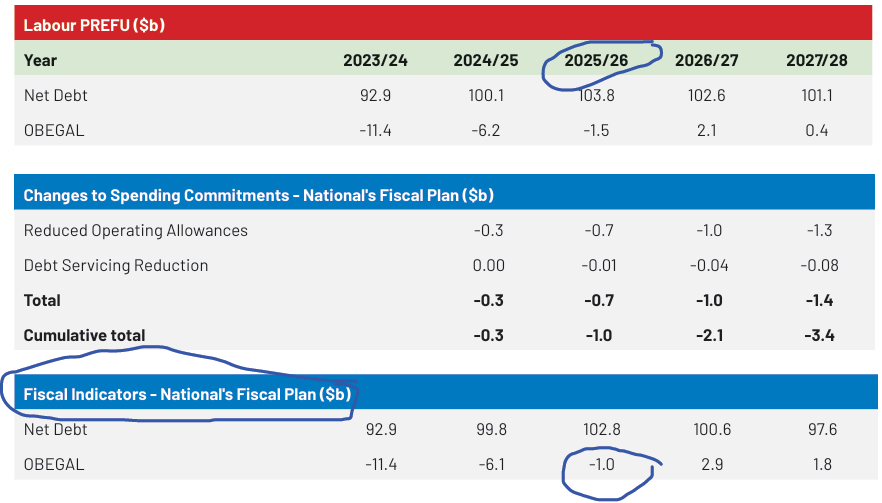
And in case you are wondering, the PREFU projections that provided the economic base for National’s numbers still had a negative output gap of 0.9 per cent of GDP for the 25/26 year, so it wasn’t exactly a rosy economic scenario. But the deficit was to be more or less closed by now ($1bn for the full year is a bit under 0.25 per cent of GDP, and by the second half of that year – which we are almost in – presumably consistent with a tiny surplus).
There will be an update with the HYEFU next week, but in this year’s Budget – where the government last made overall fiscal decisions – the deficit for 2025/26 was forecast to be $15.6 billion.
Now, to be fair, going into the 2023 election National wasn’t exactly making much of the structural deficits they expected to inherit (I recall at the time noting that there were few or no references to the deficit in the fiscal plan document). And, thus, I guess they’ve been consistent. When the deficit turned out to be more embedded than they’d expected – Treasury having badly misjudged how much tax revenue the economy was generating – National chose not to be any more bothered. They simply chose, in both budgets so far, to do nothing at all about closing the deficits.
This had been apparent in Treasury’s analytical numbers. They publish estimates each year of the structural deficit – ie the bit not amenable simply to the cyclical state of the economy.
This chart was from 2024 budget documents
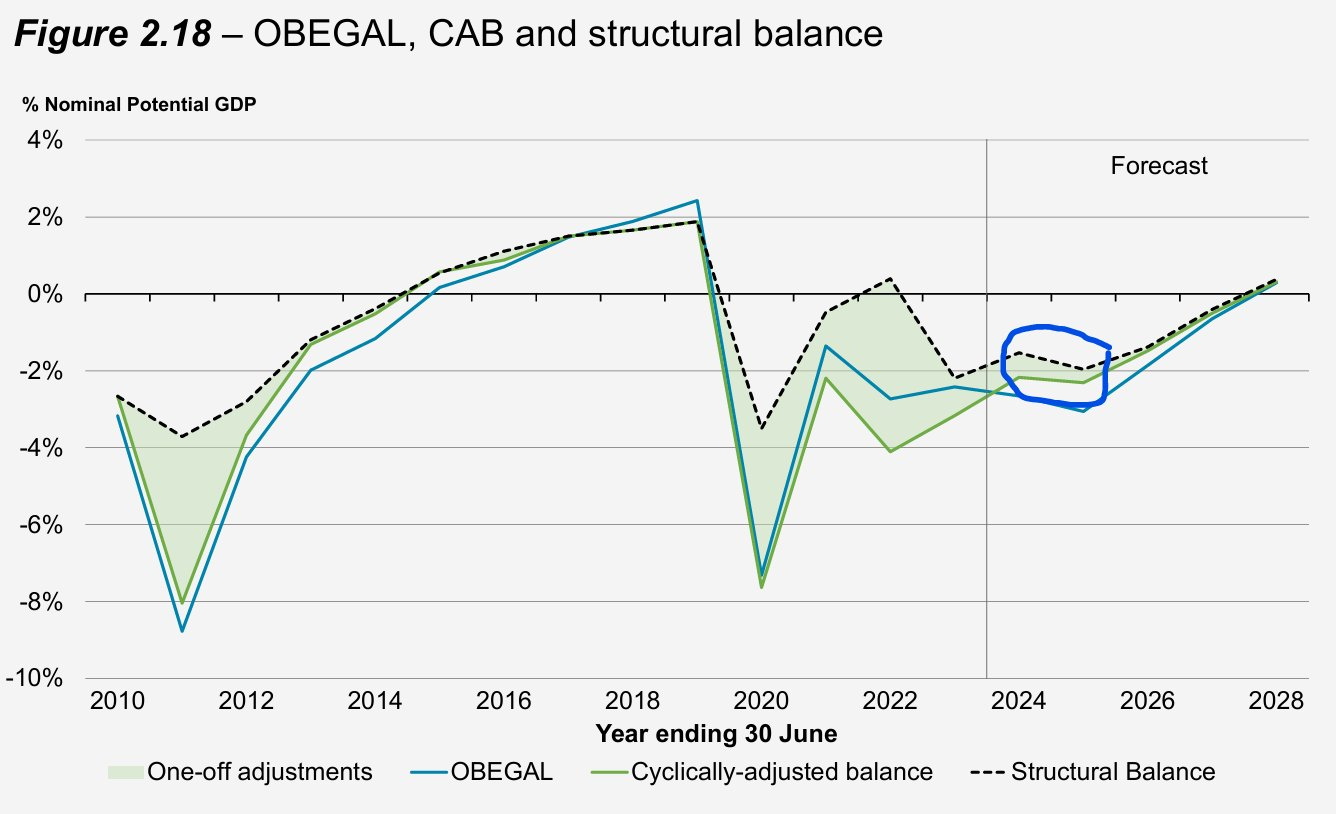
History is as it is (or, at least, is estimated to be). The medium-term future numbers are, under any government, just vapourware (Treasury uses the future operating allowances the then Minister advises them, which need not bear any relationship to what is actually done when the time comes). But what I’ve highlighted is the move from one year to another, for the fiscal year to which the Budget relates. Thus, in the 2024 Budget Treasury had an estimate as to how big the structural deficit had been for 23/24 and then, given the hard decisions ministers were making, and getting parliamentary approval for, a forecast as to what the structural deficit would be for 24/25. As you can see, in that Budget, the government chose – they had these numbers and associated analysis – to take steps that, taken together, slightly worsened the structural deficit.
The picture from the 2025 Budget was much the same
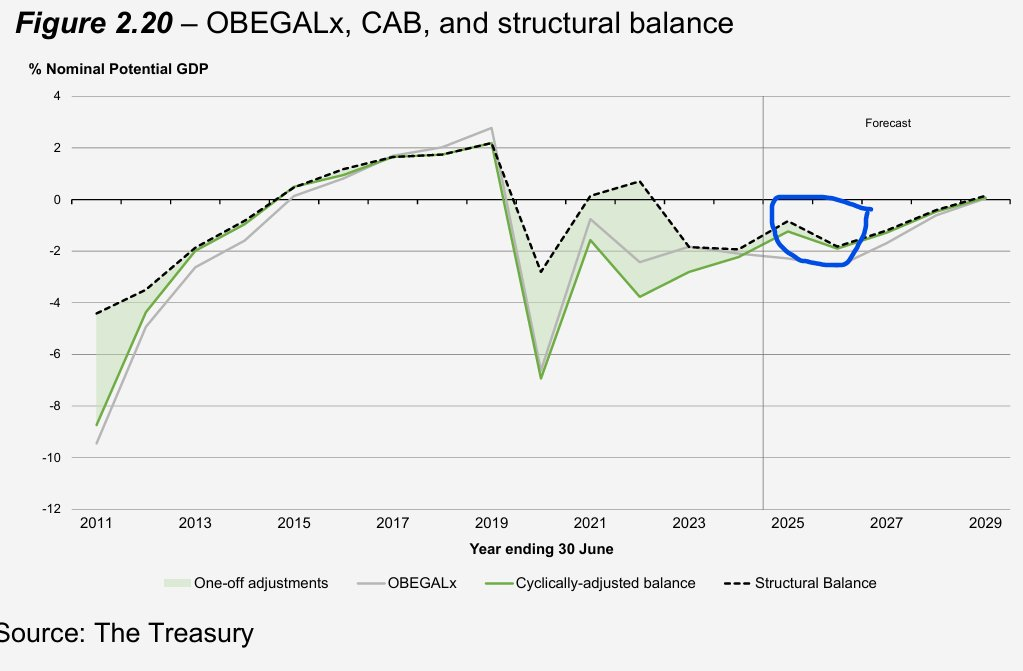
For a second year in succession, this government’s Budget slightly worsened the structural deficit.
Of course, all the numbers are imprecise estimates, but they were the best estimates available to ministers when they made the Budget decisions.
And recall that a structural operating deficit is akin, in a family context, to borrowing to pay for the groceries even when the family’s employment and income position is pretty normal. A bad practice….for the family, and for the Crown.
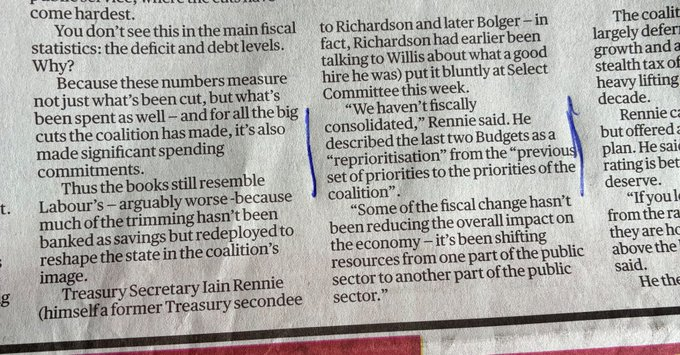
It was the Secretary to the Treasury himself who told FEC last week that there had been no fiscal consolidation under this government.
Things haven’t got radically worse in structural terms, but all this has come on the back on deficits under the previous government, and the ever-increasing ageing population fiscal pressures that Treasury has (among other people) warned about for years.
Of course, it hasn’t suited politicians on either side of the aisle to acknowledge Rennie’s point. The government has repeatedly suggested that their fiscal consolidation efforts have helped considerably in bringing about the large cuts in the OCR over the last 16 months, while the Opposition has been content to suggest that something akin to a “slash and burn” approach explains the weakness of the economy over that period. The numbers don’t back up either side – which surely their smarter people actually knew? – because there has been no fiscal consolidation. Sure, the government has cut some spending, but those savings have been (slightly) more than outweighed by new spending. Consistent with that. core Crown expenses as a share of GDP for 2025/26 were estimated at Budget time to be 32.9 per cent of GDP, up slightly on the previous year, and a full percentage point higher than the last full year for which Labour had been responsible. All those numbers are in the public domain, but….politicians……. (In the last full year pre Covid, by the way, spending was 28.0 per cent of GDP.)
Ah, you might be thinking, but what about the interest burden run up by the accumulated deficits of recent years. Surely the incoming government was pretty much stuck with that, making overall expenditure cuts more difficult? And there is something to that, so in this chart I show primary spending (ie excluding the finance costs line from the core Crown expenses table).
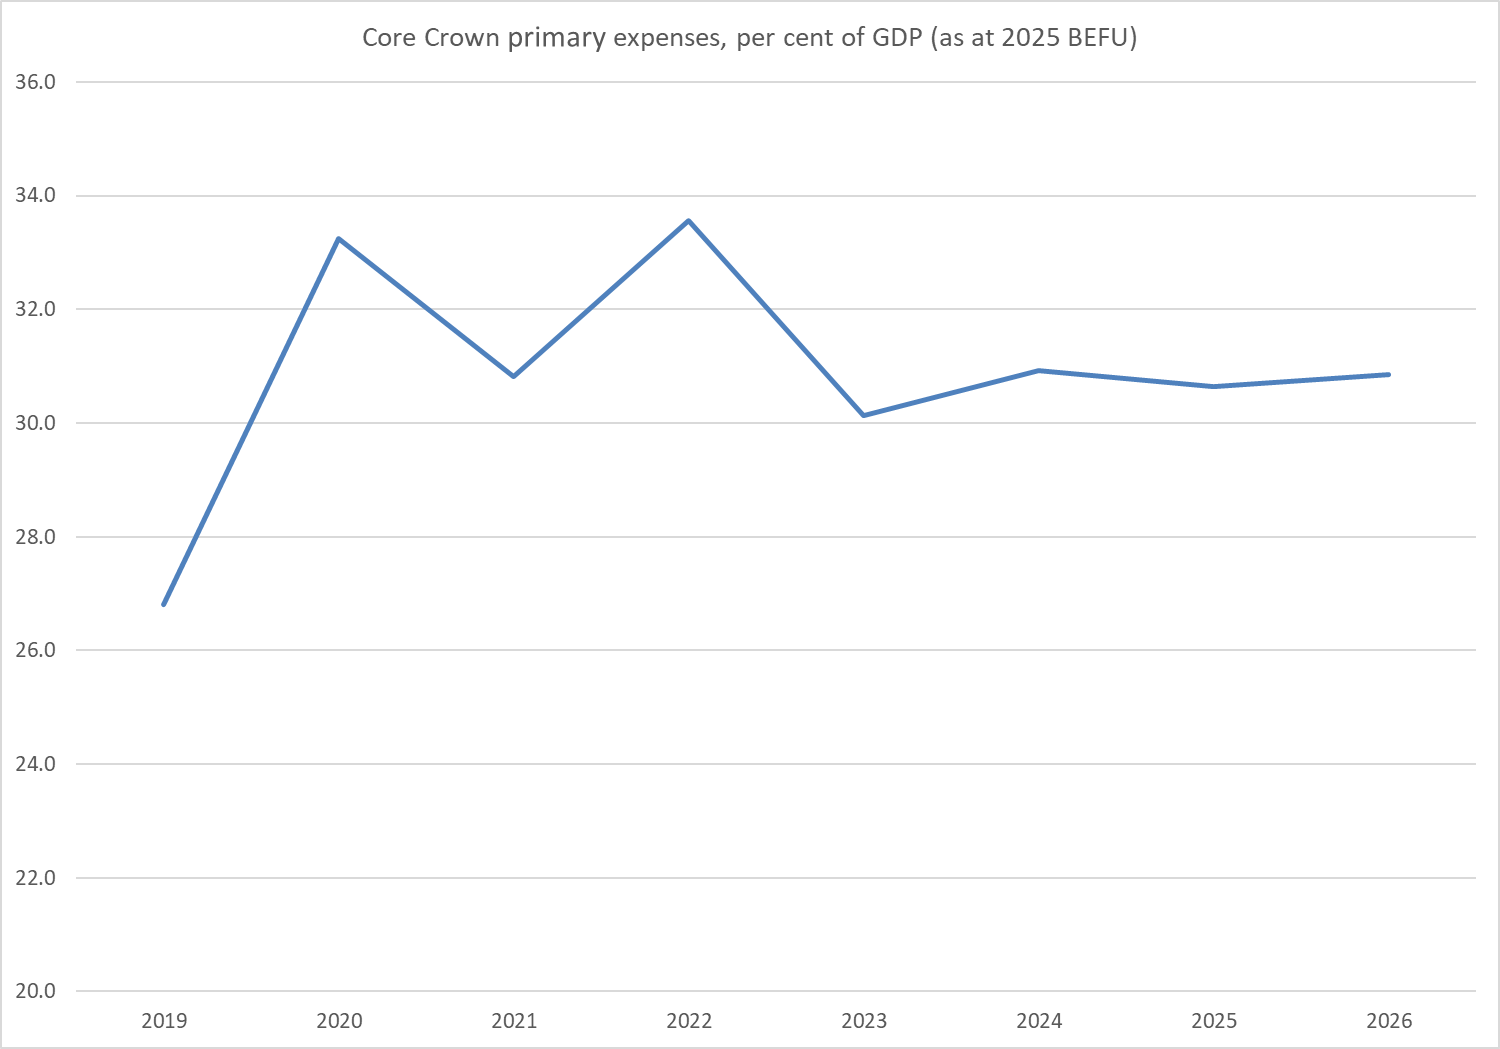
It doesn’t really make much difference to the picture: primary spending is still a) far above levels for the June 2019 year (last pre Covid), and b) higher than in the last full year of the previous government, both as a share of GDP.
Spending levels aren’t really my focus. If governments want to spend more then so be it, provided they raise the taxes to pay for the spending. This government simply hasn’t done that, and so the structural deficits stay large, and have been widened a bit (an active choice, not a passive outcome).
In the last couple of days there has been something of a spat between the current Minister of Finance, Nicola Willis, and her National predecessor Ruth Richardson. It seems there is to be a debate between them, after the HYEFU numbers come out next week. But if no one ever really expected Nicola Willis to take anything like a Ruth Richardson approach to public finances, her comments yesterday (as reported in The Post, still seemed extraordinary.
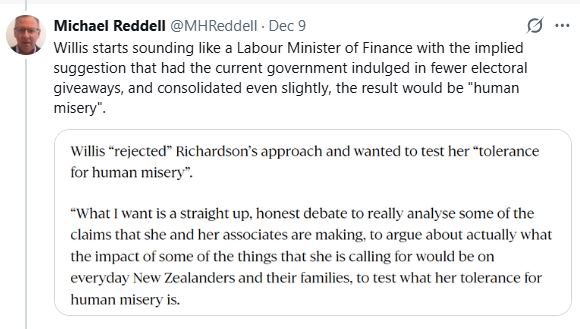
Can the Minister really have been serious in suggesting that any fiscal consolidation – and recall she did none – would have come only at the cost of “human misery”? Fewer film subsidies for example? Or cutting the Reserve Bank budget back a bit more? Or…… (and there is a long list of new initiatives, all choices)? Really?
I’m not overly interested in relitigating the Richardson record, particularly in 1990/91. One can mount an argument that by the time National took office in late 1990, there was already a primary surplus – itself usually sufficient over time to bring finances into order – with the high interest costs themselves somewhat exaggerated (in terms of real burden) by the persistently high inflation of the previous few years. And, as it turned out, even the return to headline surpluses took place sooner than had generally been expected after the 1990 and 1991 fiscal cuts (I was co-author of a Reserve Bank Bulletin article that attracted the ire of Michael Cullen for suggesting that surpluses might not be too far away, and even we were too pessimistic). All that said, fear of large credit rating downgrades was a major consideration at the end of 1990 and into early 1991, and the second failure of the BNZ wasn’t exactly confidence-enhancing. (Then again, the demographics were much less unfavourable back then – in fact quite favourable for the following decade or so, given low birth rates during the Great Depression.)
But whether or not the full extent of the fiscal adjustments back then were strictly necessary is beside the point now. We have much better fiscal data and analytical models, and we have substantial structural deficits on which the government has chosen to make no inroads at all, all while also doing nothing about the medium-term demographic pressures on government finances. The Minister is quoted in the Herald this morning as suggesting (in effect) that the lady’s not for turning, and that she is keeping right on with her borrow and hope strategy – hoping, no doubt genuinely, that one day something will turn up and the deficits she has chosen to run will just go away. If they don’t, we are on a path that – persisted with – takes us in the same direction as, for example, the UK, once – not that long ago – an only modestly indebted advanced economy.
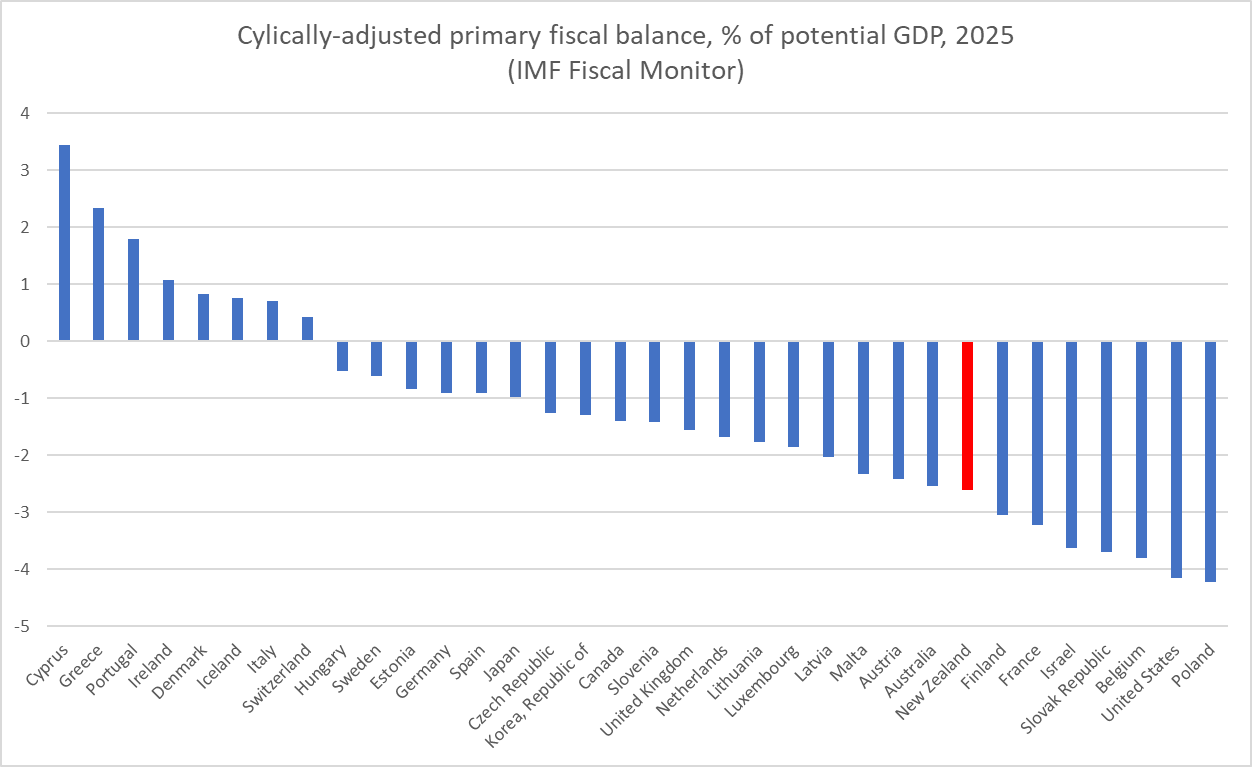
Cross-country comparisons of fiscal situations aren’t made easy by the way New Zealand presents its own data (useful for some purposes, but rendering comparisons hard). But twice a year the IMF produces a Fiscal Monitor publication with a range of indicators presented on a comparable basis across countries. This chart, using data from the October issue, shows the cyclically-adjusted primary balance for New Zealand and other advanced countries (these are overall balances, not operating ones). There are countries running larger deficits, but most advanced economies are running much deficits or even primary surpluses.
When it comes to deficits, the New Zealand government is choosing to do poorly on almost metric you choose to name (history, cross-country comparisons, expectations of the Public Finance Act). And it is choosing to do nothing about it. With an election year next year, not a time known for fiscal consolidation.
I had noticed reports that the Taxpayers’ Union was launching its own campaign on these issues, and the government’s fiscal fecklessness – choosing to do nothing about fixing a problem they inherited. I don’t have anything to do with that but while I was typing this a courier turned up with the props they are distributing to journalists and commentators. I’m sure we’ll enjoy their fudge.

Is it a fiscal fudge though? More like open and outright bad, and rather irresponsible, choices. We need something better.


