At last we get to the end of the New Zealand Initiative’s report on New Zealand’s immigration policy.
I don’t want to spend much time on the Conclusion page or so. Even in a short section, there is lots I could challenge or disagree with, but much of it is ground already covered. But I did want to highlight briefly the tone they adopt. It is not one that, say, respects the very wide differences in immigration polices found across time and across the countries of the world (even just among the relatively advanced countries). Or one that recognises that in some area men and women of goodwill and decency might have different preferences as to how best to organise or govern societies. It isn’t even one open to the possibility that not all state-facilitated immigration – to any place, at any time – will necessarily benefit the natives of the place. Rather, the only things that can possibly lead to different conclusions than the Initiative are fear, confusion, racism and so on.
This is what I mean.
Such is the intensity of the fear and confusion among the public that many opposition parties have seized on this narrative, some naively and some opportunistically. The pro-immigration Key government too has tightened policy settings to appease the public.
No one, presumably, has engaged in a thoughtful or considered reassessment?
Radical changes to policy settings simply to appease populist fears is misguided and even harmful.
The only reason anyone might apparently consider change is “to appease populist fears”.
Which is all a bit odd because a couple of paragraphs on they come to the economic aspects of immigration – economics being the core expertise of Initiative people. And there, writing about New Zealand, they say (emphases added)
Economic worries about immigration are overblown. There is no compelling reason to believe migrants are causing major detrimental impacts to the labour market. Although the empirical evidence is less than conclusive, there are good reasons to believe, as most economists do, immigration can make a positive contribution to economic growth.
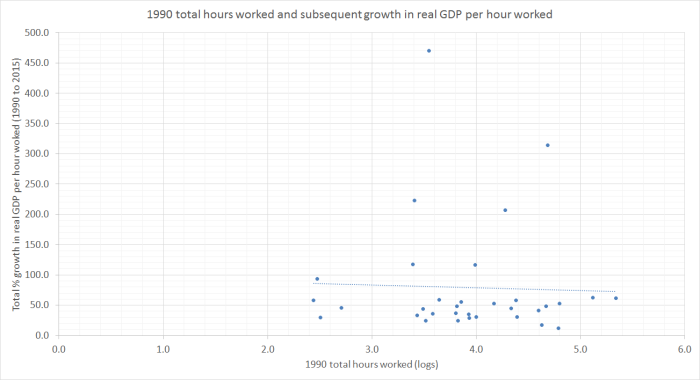
Note how weak the actual claims are. It isn’t exactly a ringing endorsement of the contribution of New Zealand’s immigration policy to the economic wellbeing of New Zealanders. After all, I’m happy to sign up to the proposition that immigration “can” make a positive contribution to per capita economic growth, productivity, NNI per capita or whatever. Pretty clearly it did in New Zealand in the 19th century. It is just that the Initiative, at the end of a major report, can point to no evidence that it actually has done so in recent decades, or is doing so now, in New Zealand.
But what of their specific policy recommendations? For practical purposes, they endorse roughly the current scale and structure of our immigration policy (with no attempt to assess whether New Zealanders would be better off if, say, the programme were 50 per cent larger, or smaller, than it is). There are, broadly, four areas of reform they suggest. As they argue – noting again the loaded language
Most of the low-hanging fruit have been picked, but policy can still be improved. And there are less harmful ways to placate those who demand an exclusionist policy.
The first is “giving business more of a say”. In some areas, I agree with them. For example
Rather than let government decide what types of skills the market needs, let the market reveal it through the price system. A market-driven approach could be to adjust the points system to assign points to the salary ranges of job offers rather than the specific industries migrants are qualified in.
I would favour something similar for our short-term work visa rules. Set age-related salary thresholds, and set them quite high, and use that as the main tool to decide whether or not to approve a work visa. I’d have no real problem in offering work visas fairly freely for any position (genuinely) paying, say, $100,000 per annum or more, subject to a limit of, say, three years. After all, in the Initiative’s words – and ones I could have written myself
Skills ‘shortages’ can be rectified through higher pay rather than lobbying
government to add the skill requirement to the list.
Where I depart from the Initiative is when they fall back on comparing people with pineapples.
The free market is a much better decision-maker on how many imported pineapples or cars New Zealand needs. Likewise, the number and types of skilled workers New
Zealand requires is for businesses to decide without the strong hand of government.
What is being decided, in our medium-term immigration programme, is how many people, of what sort, will be able to come and join the polity that is New Zealand. Pineapples don’t vote, pineapples don’t come with cultures. People do. The Initiative seems largely indifferent to any notion of the state as agent of the collective preferences of its citizens, but most voters probably see it differently. I’d put their sentence the other way round:
“It is for the government, on behalf of the public, to make choices as to how many, and what type of, people to invite from abroad to become New Zealanders. Firms and employers will choose optimal production structures, remuneration patterns etc, in light of all the resources and constraints they face.”
The Initiative also explores the option of imposing a levy, “to limit the effects of migration on infrastructure costs”. One of the authors, Rachel Hodder, followed up this idea in an article on interest.co.nz. As she puts it
Our recommendation then also stands as a challenge to political parties that have been using infrastructure burden as justification for cutting immigration. If that is the genuine reason you believe immigration policy needs to be adjusted, then why not explore this option first?
It is an interesting idea, and I don’t think I’d have any objection in principle. It would increase the chances – although certainly not ensure – that large scale immigration would actually be benefiting New Zealanders in aggregate, although on its own it would do nothing to allay the distributional concerns (that relatively unskilled New Zealanders are losing out).
The Initiative proposes the idea of a levy without, as far as I can see, giving any sense of the possible size. One angle might be to look at the public sector capital stock, which presumably needs to be augmented, in much the same per capita amounts, for each addition to the population. As at last March, Statistics New Zealand estimated that the current value of the general government sector’s capital stock was around $41500 per person. But that is a depreciated value. Assume that all the capital was halfway through its life, and one could easily be looking at a per capita cost of putting in place the new public sector capital that new migrants require of $80000. Some of the public sector capital is already financed by user-fees, but most of it isn’t. I wonder if anyone is seriously willing to propose an $80000 levy for successful applicants for a residence visa in New Zealand – even if, say, it could be paid as an income tax surcharge over the following 10 years? In principle, it should raise the average skill level of the successful applicants to some extent. It would certainly deter migrants with children.
I don’t have a huge problem in principle with such a scheme but, rightly or wrongly, I suspect most people would judge that it was almost a “repugnant transaction” – they would prefer not to sell the right to become one of us. Is it different in character from inviting migrants in on the hypothesis that doing so will enrich us all (the current philosophy)? Perhaps not – and definitely not to the economist in me – but I can’t see it finding a great deal of public favour, among supporters or sceptics of the immigration programme.
The Initiative also seems to endorse proposals for New Zealand to sign reciprocal free movement agreements with any willing coountries, citing favourably ACT leader David Seymour’s suggestion to promote such agreements with Canada and the United Kingdom, complementing the arrangements we currently have with Australia.
Doing so with the UK in particular would, of course, restore the system that operated for more than a century after New Zealand was first settled. It was only in the 1960s and 70s that free movement between the UK and New Zealand was no longer legally permitted. At a political level, I find the idea quite appealing (but politicians in the two countries are unlikely to). At an economic one, I don’t. This simply harks back to my longstanding argument that the most important issue for New Zealand is the sheer number of immigrants we’ve been taking, not primarily what shills they’ve had or where they’ve come from. Most of our migrants in the early post-war decades came from the United Kingdom. At the time, material living standards here were better than those in the UK. But even now, decades on, no one has been able to produce studies – whether econometric ones or analytical narratives – demonstrating the productivity gains to New Zealanders from that large scale immigration. Economists at the time was pretty sceptical. Those now just seem uninterested in New Zealand economic and economic policy history, and the possible lessons it should offer.
These days, of course, New Zealand is poorer than the UK, but the UK is so much the larger country that even a small outflow from the UK to NZ (as a share of the UK population) would be materially disruptive to New Zealand, and would further set back the chances of lifting productivity and living standards here back to those in, say, the top half of the OECD. There is, additionally, the adverse selection problem, that the people most willing to migrate from a rich hub to a poorer, but perhaps more relaxed and spacious, country are hardly likely, on average, to be those with the greatest desire to succeed, and the strongest likelihood of offering the vaunted productivity spillovers.
The Initiative’s final suggestion for policy improvement is in the area of sponsorship for migrants.
A separate visa category could allow committed people to sponsor and support migrants in adverse circumstances, provided adequate checks and balances are in place. Canada allows community groups to sponsor refugees above the quota if they agree to be responsible for the basic care and support of the refugees, and New Zealand is laudably trialling this system for refugees here.
In principle, I’d have no particular problem with this suggestion. As they note
Requiring bonds from sponsors could ensure the sponsors are held to their commitment.
But I think it is an approach mostly best operated on a relatively small scale. Immigration policy is a collective decision about the number, and sort, of people we welcome to become future New Zealanders. I’m not sure we want motivated minorities – whether libertarians, evangelical Christians, Wahhabi Muslims or whatever – trying to skew the population balance over time by fundraising to bring in lots more of their own. Each group is, of course, welcome to evangelise and persuade, and perhaps if the libertarians ever persuaded enough of us we’d have open borders after all. But make it a contest of ideas, not of the power to buy more imported supporters.
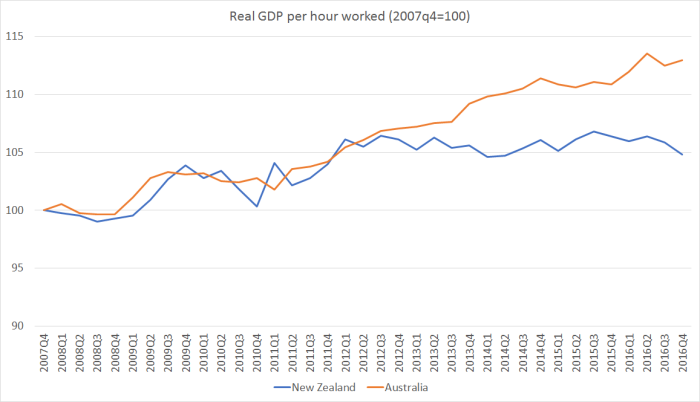
In the end, it is a pretty modest list of suggested reforms. Much as they seem driven by a vision of open borders, in the end the Initiative is worried that New Zealanders might be getting uncomfortable with the grand Think Big experiment of New Zealand existing immigration policy over the last 25 or so years. It has delivered us a large increase in the population, and a lot more ethnic restaurants and higher house prices (to take the most obvious gains and downsides), but with little or no evidence that it has done anything to lift our overall economic performance. As the OECD noted again only the other day, for the last quarter century our productivity – already low – has just drifted a little further behind other advanced countries. Perhaps it is past time to rethink this key dimension of economic policy.
My own preferrred model would probably have these elements:
- Reducing the residence approvals target from around the current 45000 per annum to, say, 10000 to 15000 per annum. In per capita terms, that would be about the rate of legal immigration the US has, and would be similar to the rate we had in the 1980s. Not exactly closing the door, but certainly pulling it over to some extent.
- Within that reduced target I would look to focus much more strongly on demonstrably highly skilled people (who offer the best chance of fiscal and productivity gains) and thus would
- revisit, reduce and potentially eliminate the current Pacific access categories,
- permanently eliminate parent visas, except (and even then capped) where there is an enforceable, insured, commitment to full financial support from the parent, or their New Zealand citizen child.
- leave the refugee quota as it is
- eliminate the additional points provided for job offers in regional areas (a measure that is tending to lower the average quality of the accepted migrants)
- eliminate additional points for New Zealand specific qualifications,
- eliminate additional points for jobs in areas of “future growth” or “absolute skill shortage”
- more strongly differentiate points in favour of higher level qualifications,
- perhaps establish a category akin to the US visa for those with extraordinary ability
- Eliminate the provision allowing foreign students studying here to work 20 hours a week. If New Zealand tertiary institutions really have a product worth buying – and some probably do – they should stand on their own feet, as other exporters are required to.
- Reshape the work visa system with a view to (a) reduce the scope for lobbying and influence peddling, (b) reducing the total number of people here on work visas at any one time, and (c) provide much greater flexibility for employers to utilise work visa people for short specific periods in highly-skilled and well-remunerated roles. Since there would be many fewer residence approvals place open (see above) this path would in any case be much less popular with prospective migrants. Specific features might include:
- no one could have a work visa for more than two three year stints
- use an age-based matrix in which in normal circumstances no work visas might be issued to anyone under 30 for a role paying less than, say, (an inflation-indexed) $75000 per annum, increasing by (say) $25000 in each five year age window up to a cap so that for a person over 50 to get a work visas they would need to be in a role paying $200000 per annum or more.
- no doubt there would need to be some exceptions to this, and it would not apply to say approvals for roles of less than perhaps three months, but the point is to get the focus not on official judgements of “skill shortages” but on attracting people, if we do, who are capable of commanding high salaries (loose proxy for skill) on market.
Is it a perfect scheme? No, of course not. That isn’t a meaningful test for any human institution. Is it a scheme for other countries. No. Some might find it useful, but for others – where there might be clear evidence of gains to natives from large scale immigration – it might be quite inappropriate. But for the specifics of where New Zealand finds itself now, it would be a huge step in the right direction. For a very remote place, in an age when personal connections seem to matter more than ever, it would give us a much better chance of finally beginning to close the income and productivity gaps, and offer New Zealanders – the inevitably fewer number of future New Zealanders than under current policy – the chance of achieving world class productivity and living standard here in their own place.
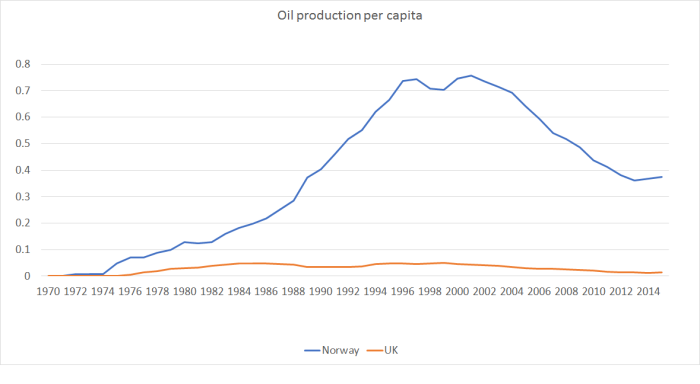
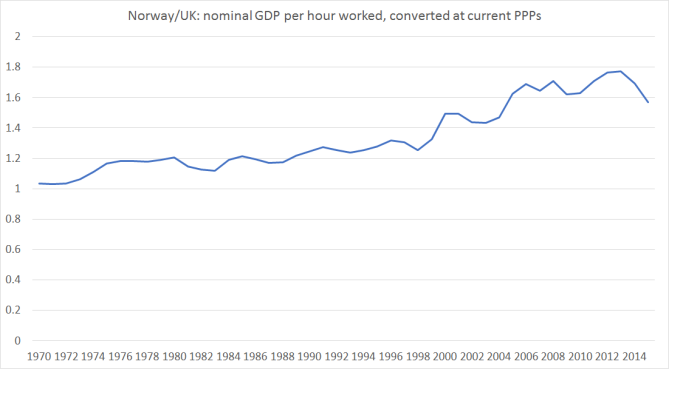 These days, by contrast, GDP per hour worked in Norway is around 60 per cent higher than that in the UK (which is in turn quite a bit higher than New Zealand’s). Norway has among the very highest material living standards of OECD countries, and the UK is still in the middle of the pack.

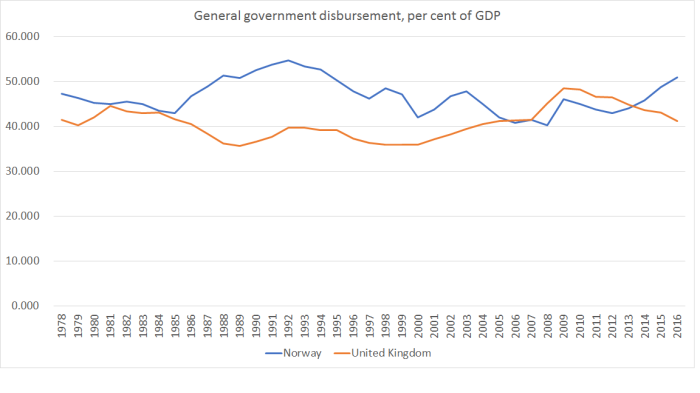


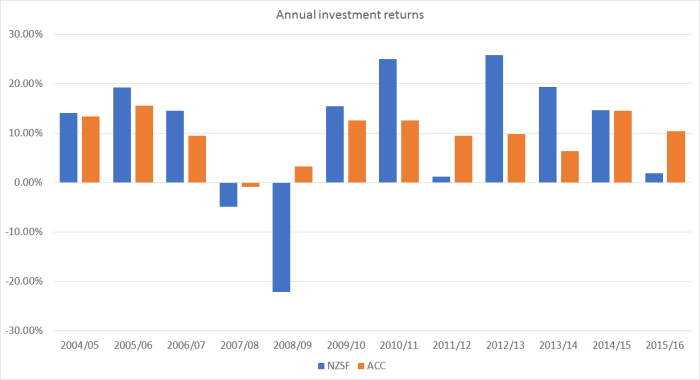
 They would be okay for the next few years, but once you get even 10 years out from here, there would need to be a lot of other expenditure cut to keep spending to around 30 per cent of GDP, even if (a) the two parties resume NZSF contributions soon, and (b) investment returns proved to be pretty good. I’m genuinely puzzled how they propose to square that circle.


 In both countries the current unemployment rate is around 1.5 to 1.7 percentage points higher than it was in the year or so prior to the global downturn. And neither country was troubled by a domestic financial crisis, nor did they run out of room to use conventional monetary policy. The monetary policy authorities should have been able to do better. If I look across the monetary areas in the OECD (again replacing individual euro area countries with the region as a whole), the only places with a worse record on this score – unemployment rates now compared to the pre-recession levels – are: