I’ve been rather tied up with other stuff for the last few weeks (including here) which is why I’ve not previously gotten round to writing about the first piece of monetary policy communications from our Reserve Bank this year. That was the “speech” by the Bank’s chief economist (and MPC) member Paul Conway given to anyone and no one in particular over the internet last Tuesday. It had been a couple of months since anything had been heard from any MPC members, in what are not exactly settled or uninteresting times, and it is still several weeks until we get the first formal monetary policy review and MPS this year. We really should be able to expect better……but then if it were that sort of central bank, lots of things about the last few years would have been done differently, including the Bank might not have lost the taxpayer the mindbogglingly large amount of $11bn or so (with not the least sign of any contrition or of anyone having been held accountable).
Conway’s fairly short piece was a puzzling document. What was the pressing need that called for a speech on ‘the importance of quality research and data”? And what made it sufficiently pressing that they couldn’t even wait to find a real live function/audience to address? And if there is no particular function/occasion that needed a speech, but rather just something the Bank had chosen to do, wouldn’t you have expected (I certainly would) to have found some substance. The bit (the bulk) of the speech under that headline title was in fact much more notable for what wasn’t there. Is any serious observer going to dispute the likely value of quality research and data? And especially not against the backdrop of the actual New Zealand situation: poor (if very slowly improving) data and very limited volumes of macroeconomic and financial research (with the Reserve Bank’s own output in the last half dozen years notably diminished).
You couldn’t help but think that the “speech” was really just an excuse for putting out a page and a half of comment on recent economic data. I’m all in favour of individual MPC members putting their individual views and their analysis into the public domain (one of the few ways we see the quality of the analysis and thinking of these statutory officeholders). Perhaps all the more so when it had been two months since we’d heard anything, but then one was left wondering why they felt the need to wrap an entire speech around those brief comments rather than (say) just stick out a press release with the recent data comments.
But if the process was a bit puzzling, my main interest was the substantive content of the short address.
I’m going to take the material in reverse order. At the back of the speech there is a page a half of text on “a policy-relevant research agenda” and “the importance of quality data”. On the first of those headings, the speech is simply devoid of content. One might have hoped they would be releasing some new research or touting how policy-relevant research papers had shaped their thinking and understanding over one of the most turbulent periods for monetary policy in decades. Or even just foreshadowed a couple of specific papers that were almost ready for release. Instead there was nothing of substance at all, just a stylised graphic highlighting areas they were interested in, a list looking pretty much like any monetary policy research agenda in recent decades for almost any advanced country central bank.
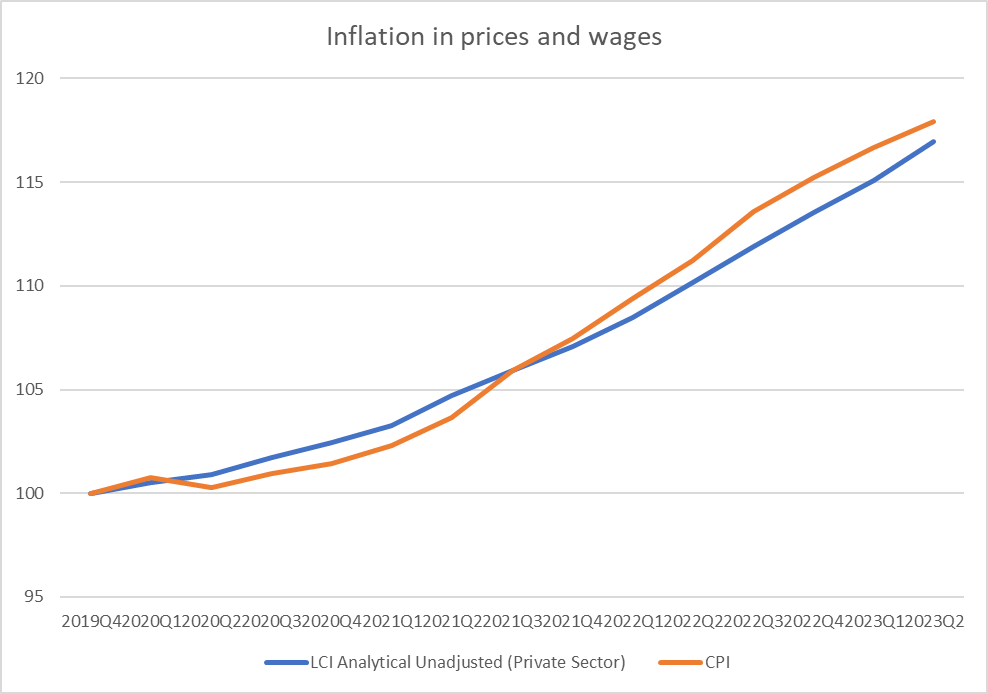
What of data? Better data would be great. At a macroeconomic level, New Zealand is one of only two OECD countries with only a quarterly CPI, something Conway glides over in welcoming the recent additions to the partial monthly prices data. We also don’t have monthly unemployment data, a pretty basic measure of excess capacity/slack, and all our main macroeconomic data comes out later, with longer lags, than most of our OECD peers. It really isn’t a satisfactory situation, when so much rides on reading the economy well. But what Conway offers is mostly honeyed words about “a consultation process” with SNZ “to better understand data needs and priorities”. If one wanted to look on the bright site I guess one could note that they are “exploring collecting much more detailed data from banks to support economic analysis and research” and “we are also developing new sources of higher-frequency data to incorporate into the MPC’s assessment process”, which sounds fine directionally, but so far doesn’t seem to have amounted to much.
Right up front, in the introduction to his speech, Conway claims that “the economy is now significantly different to how it was before COVID-19”. His claims appears to be that this is so for both the world economy and for New Zealand. Again, it is a lead-in to what is, at best, a once-over-lightly treatment: one page of text and two charts, and simply isn’t very persuasive at all (especially as regards the functioning of the economy as it affects monetary policy).
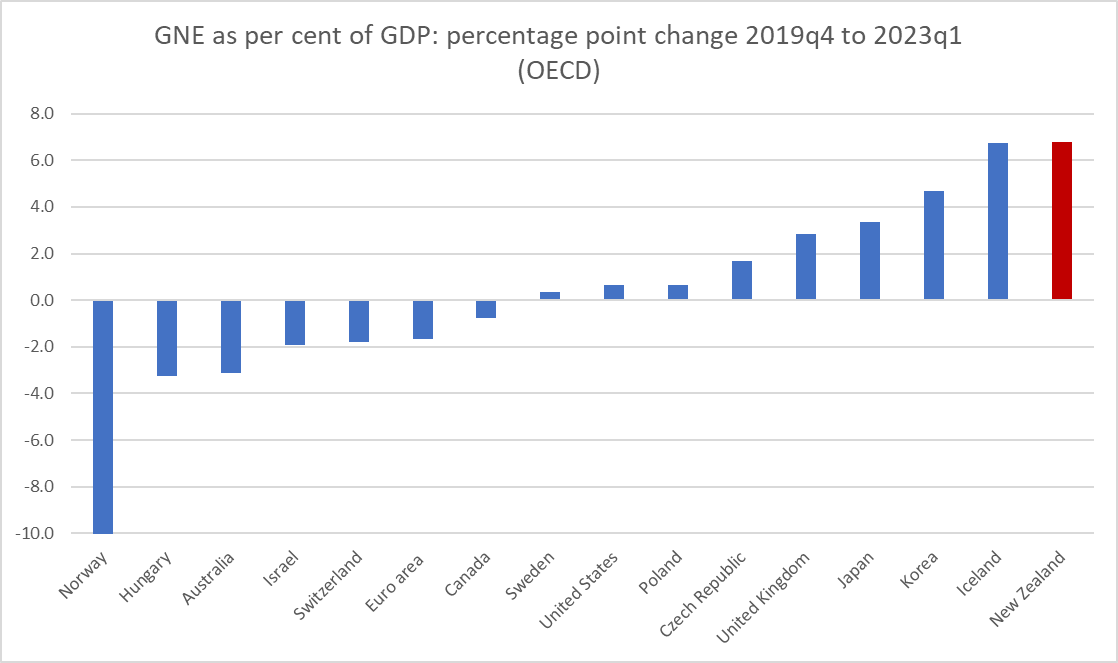
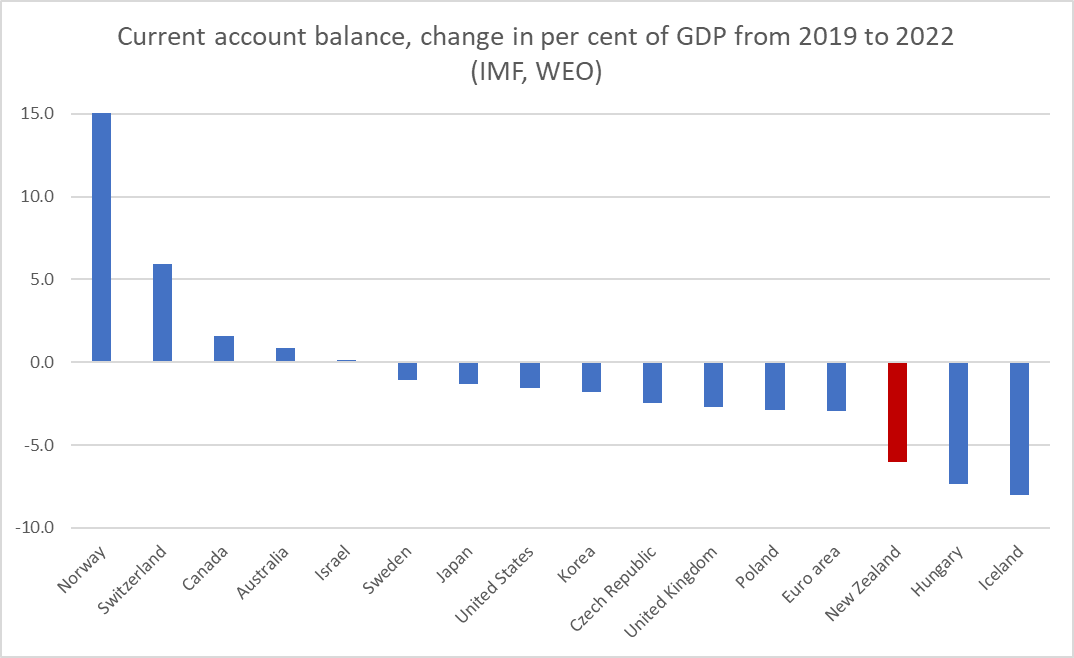
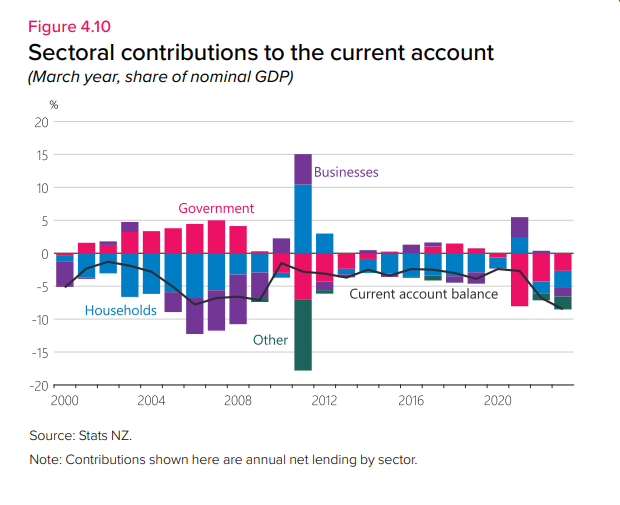
Inflation went up, to very uncomfortably high levels, and then is coming back down again. But what about how the economy works is materially different now than it was five years ago? Conway really offers no hints at all. Instead he notes that government deficits have been large and government debt has increased (as he notes, by more as a percentage of GDP in New Zealand than in the typical OECD country) but what, if any, implications are there for monetary policy? It isn’t obvious and Conway offers no suggestions.
Then when we get the common line about globalisation changing, with supply chain resilience and geopolitics more in focus. It is a common line, and this might have been an opportunity to illustrate the point with specific reference to New Zealand macroeconomic and inflation dynamics. But no…. I’m still a little sceptical that there is much to the story (of macroeconomic significance) and took that line too from a recent Martin Wolf piece in the FT. Perhaps there is a story that matters to the Bank, but Conway made no effort to get beyond the cliches.
We also heard - what we all know - that traffic through the Suez and Panama canals is down at present (the former for geopolitical reasons, the latter for climatic), but nothing at all about what it might, or might not, mean for cyclical or inflation dynamics. The Suez Canal, for example, was shut completely and for several years a few decades ago. In what way did it matter and to whom?
And then we got Conway’s take that “the pandemic has sped up the digital transformation”, which was he thought a good thing. I can’t claim to have read all the papers on the subject, but my impression had been that there just wasn’t much there (in terms, eg, of improved productivity). And if in some places more people are working from home (less a thing here it seems than in some US big cities) in what material way would it matter for a central bank?
Perhaps there were substantive points to be made. Perhaps there were things New Zealand (eg RBNZ) research might have shed light on. But….nothing.
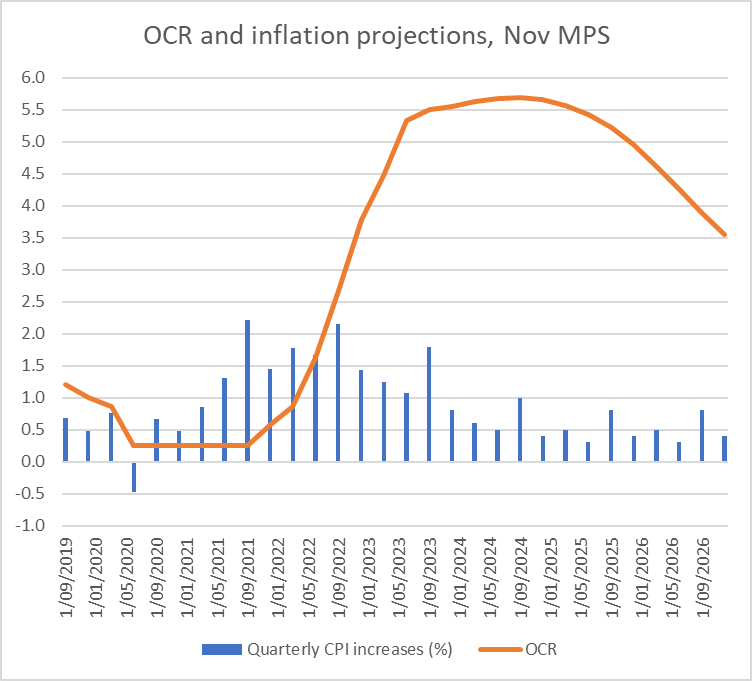
Most of whatever interest the speech commanded was inevitably going to be on Conway’s short comments on recent data. When the MPC hasn’t spoken for two months, and was then last heard talking up the possibility of a further OCR increase, it was going to be lot of few drops of rain falling on travellers crossing a parched desert. It wasn’t as if that November MPS statement itself had been overly persuasive (this was the Bank that was talking of further OCR increases even as it forecasts showed inflation collapsing over the next few quarters).
Whatever you own view of the data, you can see why Conway might have wanted to be cautious. The Bank had been talking of a further OCR increase while the market was now very focus on when, and how aggressively, rate cuts would start (here and abroad). Last week’s short comments seem to have been designed basically to try to dampen market enthusiasm, not necessarily because Conway and such of his colleagues who were consulted had a markedly different firm view than the market, but so as not to create a rod for the Bank’s back if, come late February, the Committee as a whole does conclude that there is no OCR cut in prospect any time soon. The more the market had already moved, the harder it would be for the Bank to drive home its message (without quite nasty snapbacks in market pricing).
What, if any, insights were there in Conway’s comments? Not much.
There seemed to be three points:
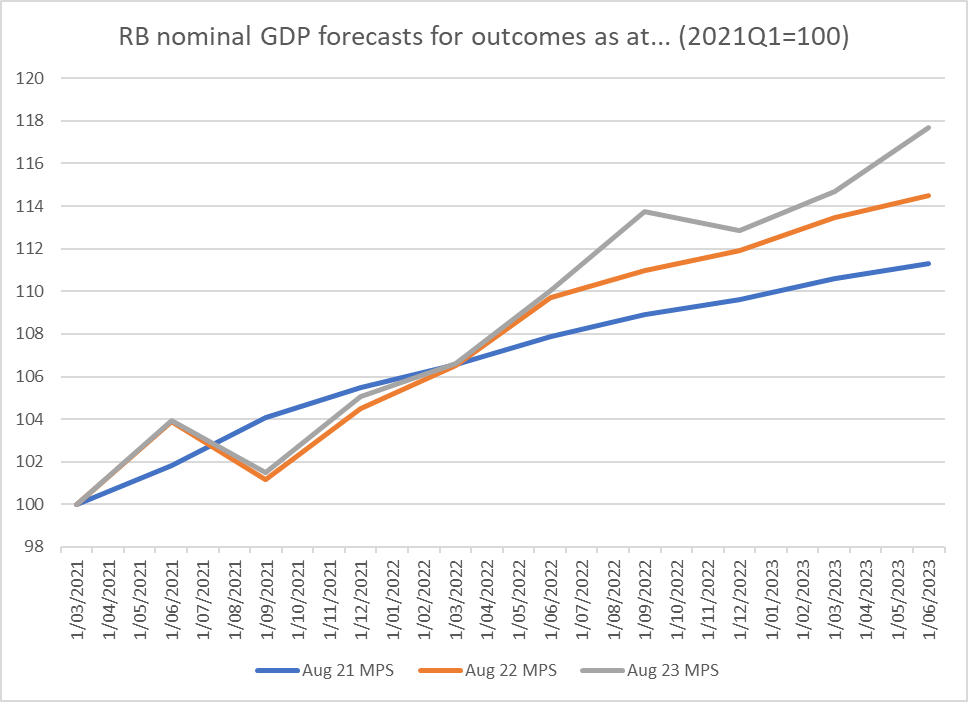
- revisions downwards to the level of GDP over several years past don’t necessarily tell us anything much about the inflation outlook. And, of course, every serious analyst already recognises this : if those data suggested the underlying productivity picture was a bit worse than had been thought, they don’t tell us much, if anything, about capacity pressures and how they are changing. We already have the inflation data for those earlier periods when the level of GDP itself was a bit lower than had been thought.
- We (they) really don’t know what is going on with immigration (either the numbers – itself a reflection of data weaknesses reintroduced to the system a year or two before Covid – or the net pressures on capacity and inflation). There was a footnote suggesting NZIER had done some work for the Bank on migration and inflation, which is described as “forthcoming” but no useful insights were offered from that work.
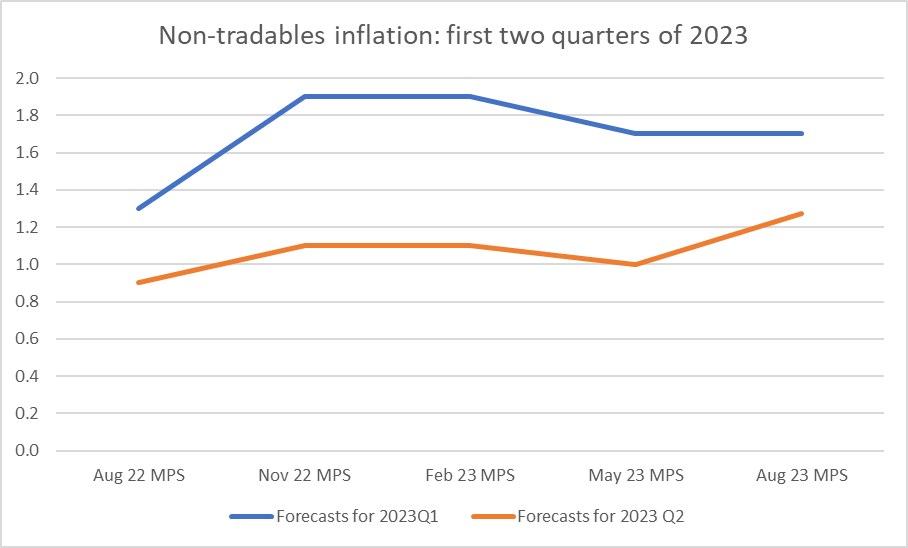
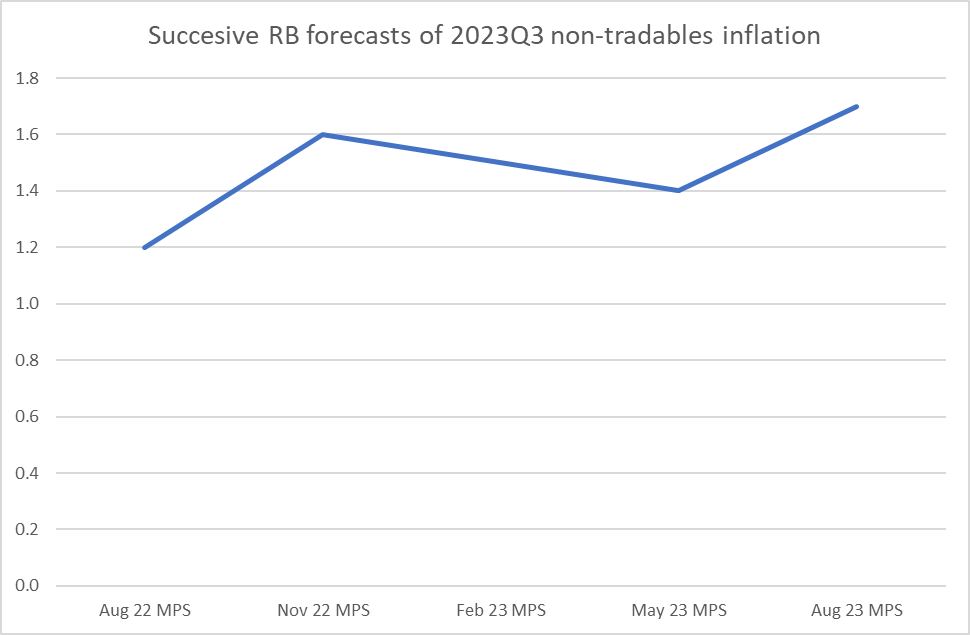
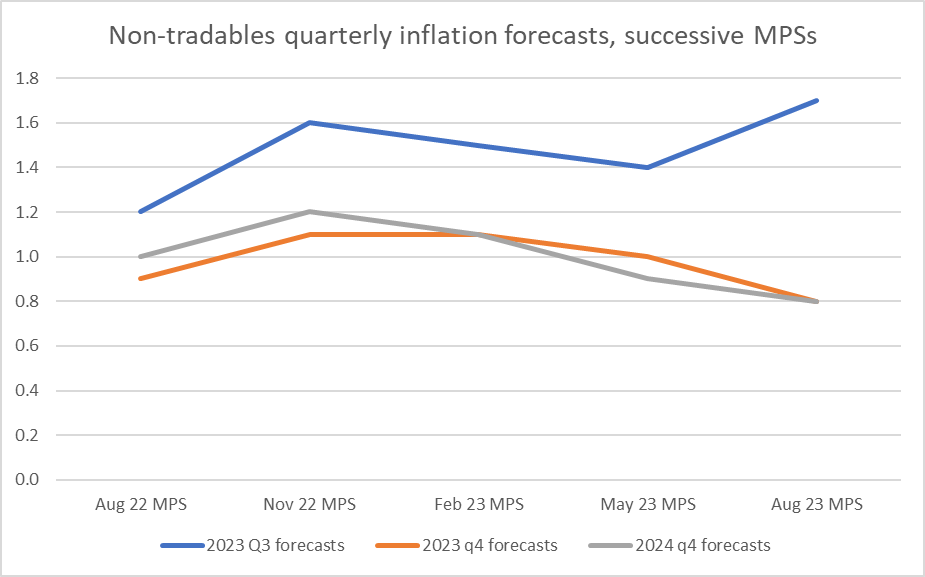
- Inflation is falling but – on the measure Conway chose to highlight (annual non-tradable inflation) – still far too high. But there was no supporting analysis at all.
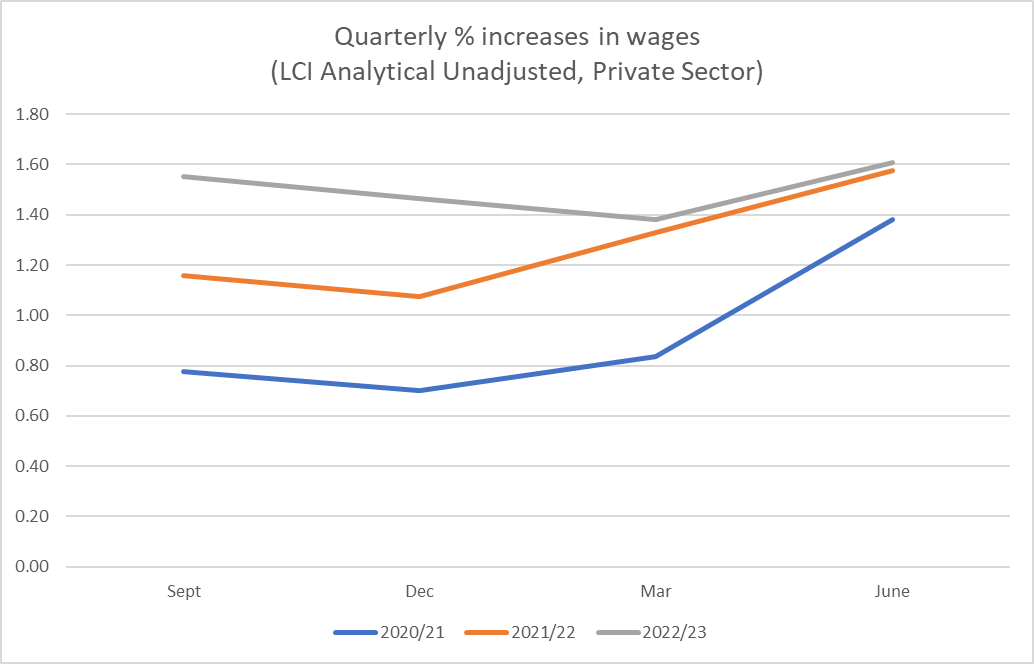
Highlighting annual non-tradable inflation – and suggesting it is a “rough approximation of inflation generated within the New Zealand economy – was really a bit naughty in a couple of ways. As other commentators have pointed out, non-tradables inflation is almost always higher than general inflation, and it is general CPI inflation that the MPC is charged with focusing on. The MPC isn’t given an option of just being indifferent to tradables sector inflation. And you’d expect central bank analysts and policymakers to be fairly heavily focused on recent quarterly inflation (especially when the OCR only got to the current level last May), rather than lagging annual measures.
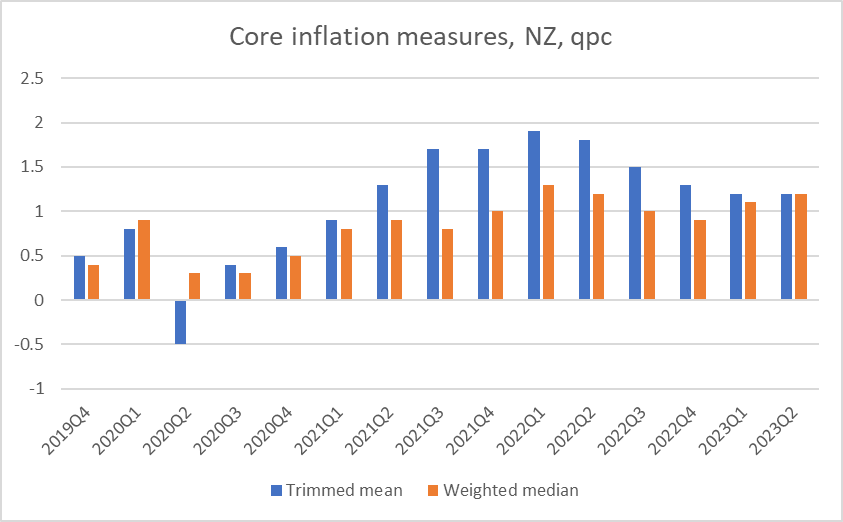
Conway mentions that core inflation measures are falling, but again chooses to illustrate the point using annual data only. That said, what used to be the Bank’s preferred measure – the sectoral factor model – is both annual and prone to revisions (up when inflation keeps rising, down when it keeps falling, but was already showing core inflation at 4.5 per cent, down from a peak of 5.7 per cent just a couple of quarters ago.
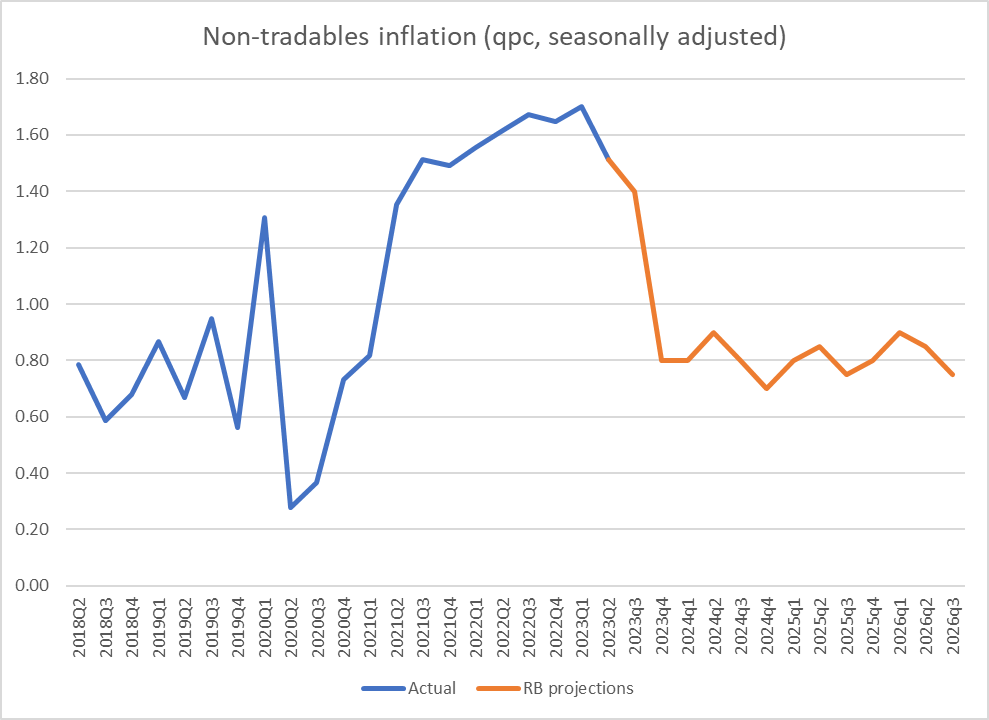
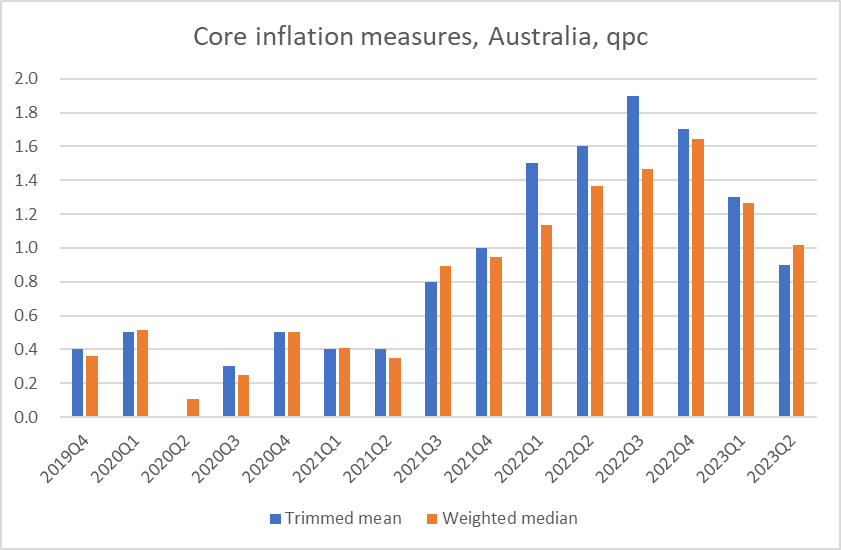
What about some of the quarterly core measures, probably reflecting the impact of monetary policy early last year? SNZ provides a breakdown into tradables and non-tradables only at the 10 per cent trim level. For tradables, the December quarter saw the lowest quarterly inflation rate since mid 2020, for non-tradables the lowest since the start of 2021. The picture is pretty similar for the weighted median quarterly data.
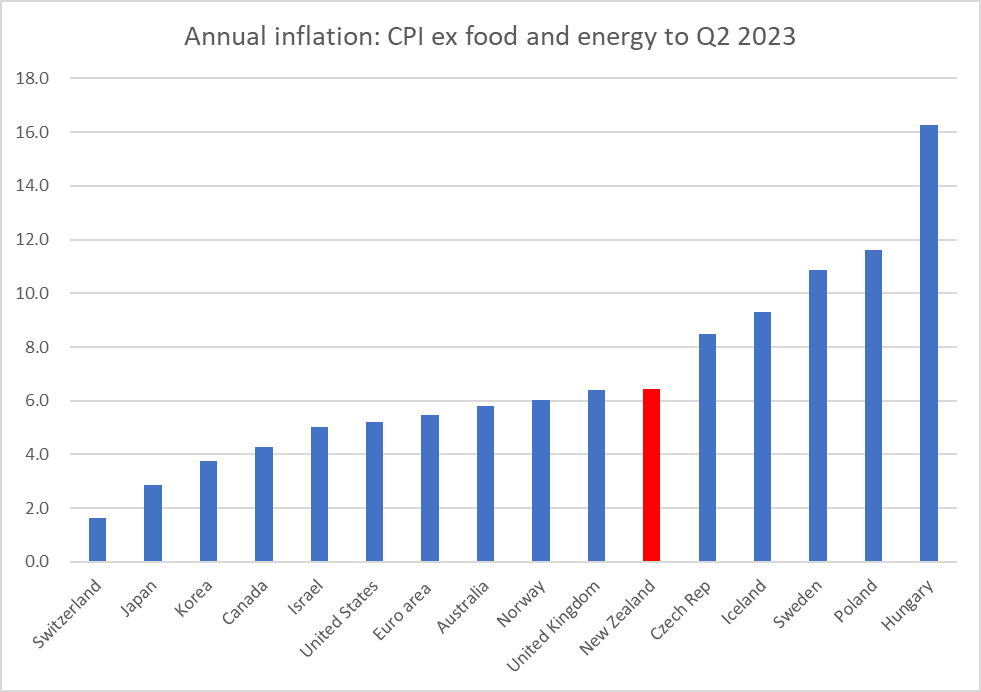
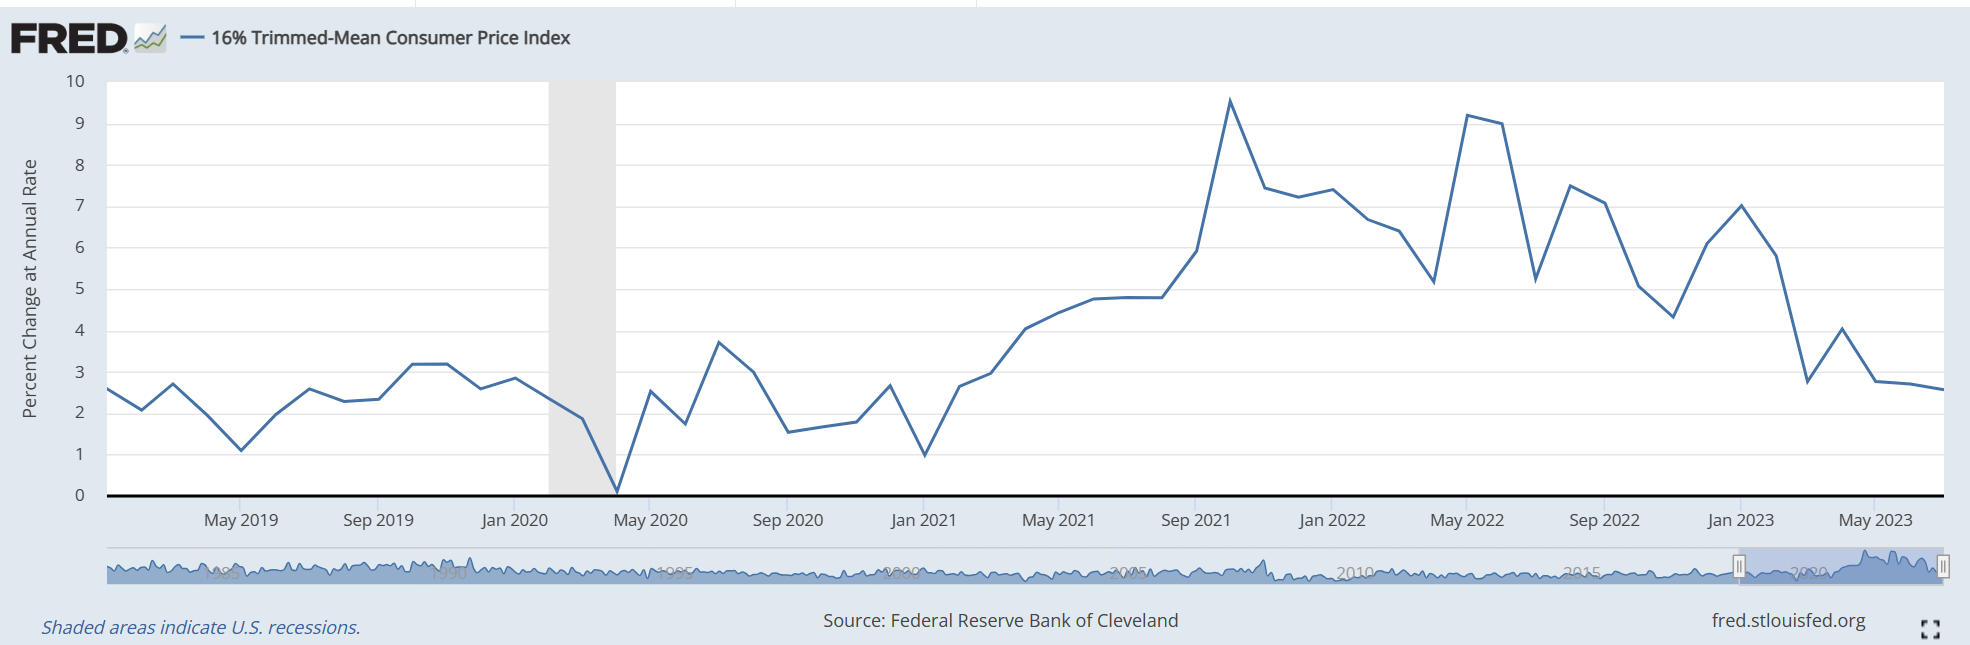
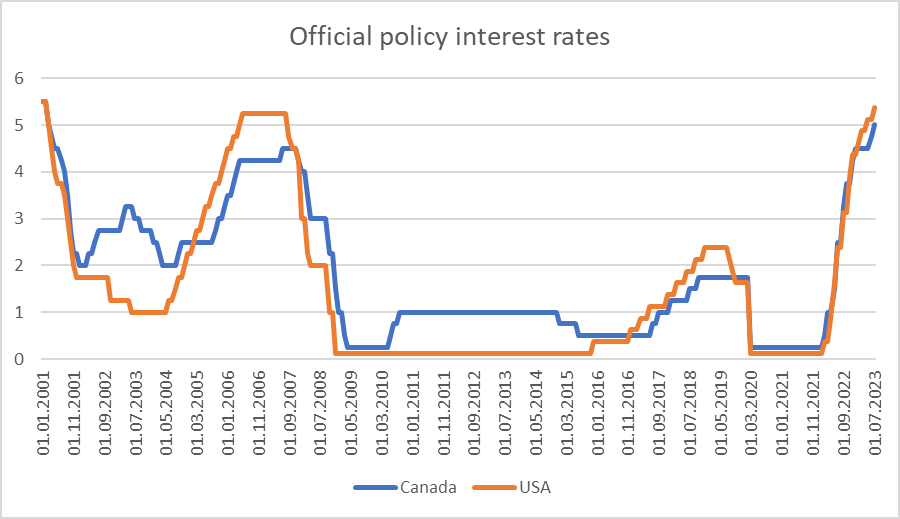
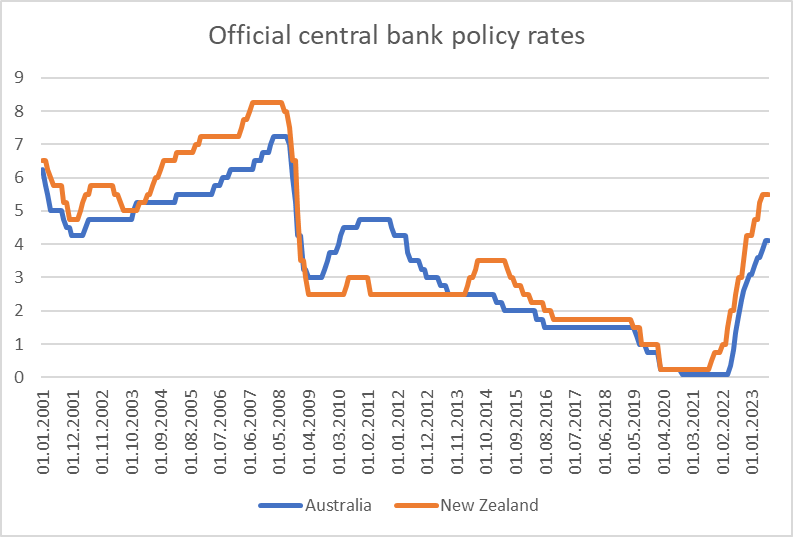
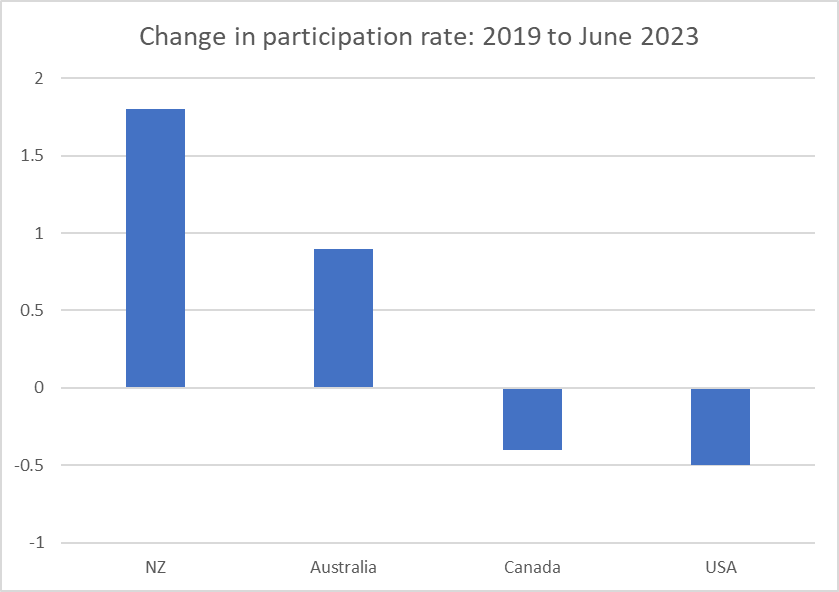
But perhaps the thing that surprised me most about Conway’s speech – in its reflection on recent data – is that there was no sign of any cross-country comparative perspective. Now, each country’s core inflation outcomes are ultimately the responsibility of its own monetary policy, but when core inflation in a bunch of countries rose pretty much at the same time, and then central bankers raised policy rates at pretty much the same time, and often to somewhat the same extent, you might think there would be value in posing cross-country comparisons, especially when many of those countries have more frequent and more recent data than we do. The common story seems to have been that (core) inflation has been falling away, a little earlier and easier than had seemed likely to many at (say) the start of last year. It isn’t obvious that New Zealand was a particular laggard in tightening (weren’t particularly early either) and so one might take some comfort from what is happening in other countries.
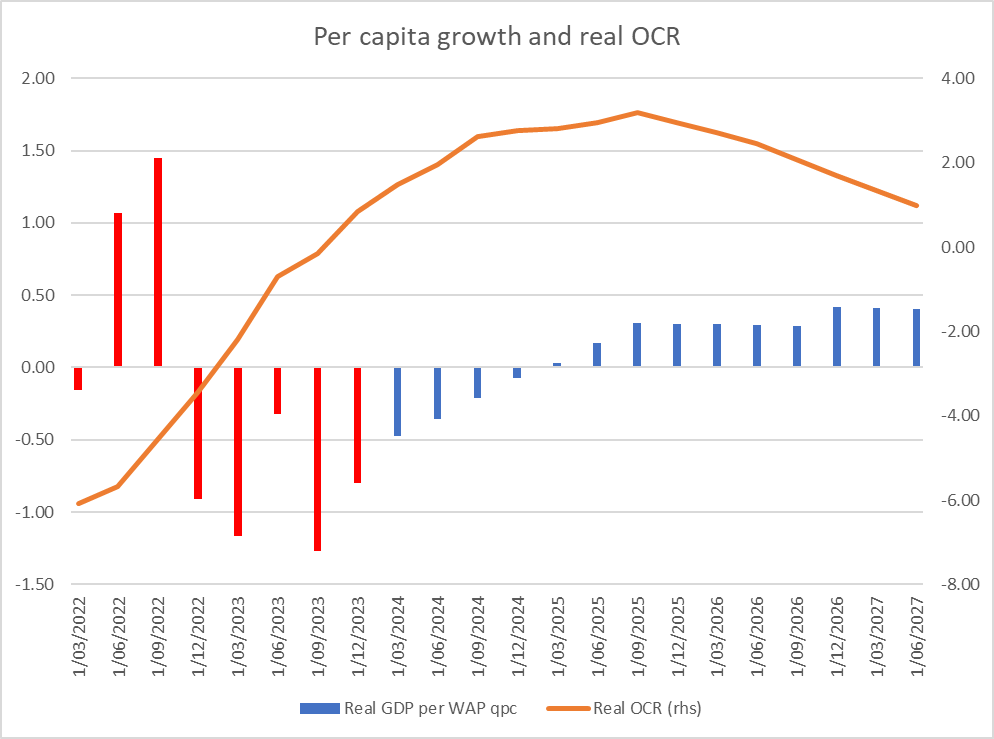
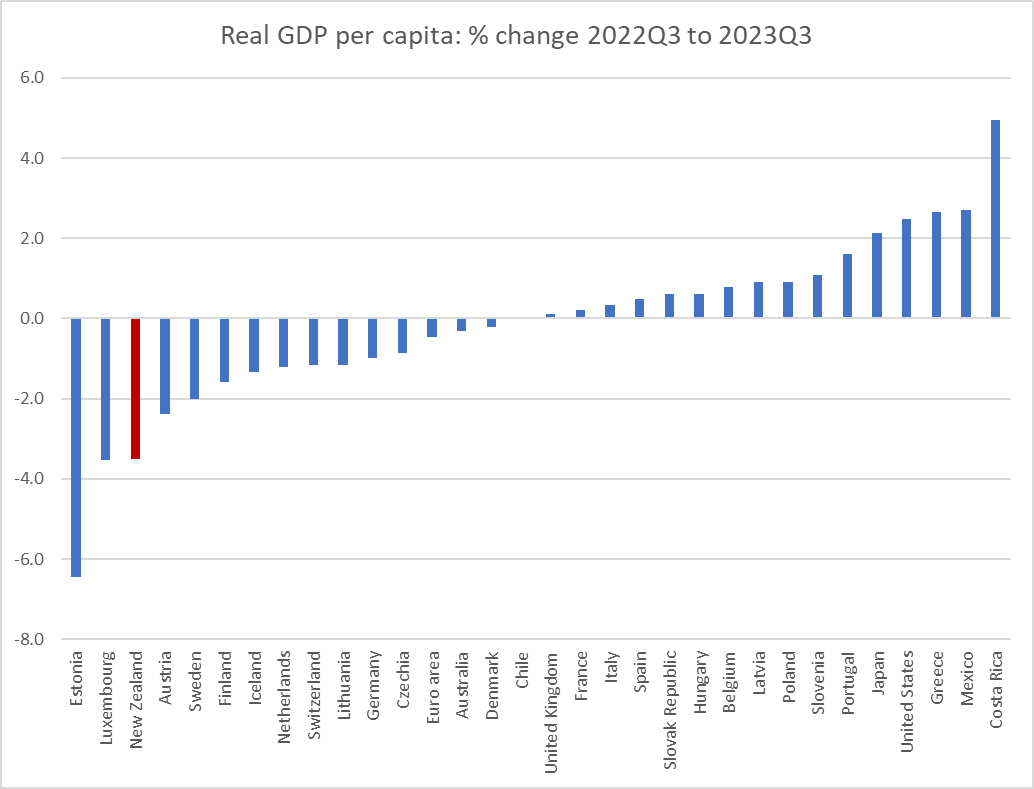
The comparison with the US might have been a particularly interesting one to touch on. The US has, so far, seemed to have experienced a sharp reduction in annualised core inflation with, as yet, little sign of any substantial or sustained economic slowdown. As Westpac’s Michael Gordon points out in a nice piece this morning, the US has been quite unusual on that score, and the economic data in both New Zealand and Australia have been materially weaker than we observed in the US (and that is especially so when one looks at per capita GDP growth). Quite why the US outcomes have, to date, been so favourable is a bit of mystery, not often explored by commentators in an international context, but when our economy has been so much weaker it seems that our inflation outlook should generally be positive. At very least it would be good to see some of this ground traversed in the MPS later in the month.
Before Christmas I wrote a piece here on monetary policy turning points in which I ended by noting that it wasn’t inconceivable that by the end of February an OCR cut might be appropriate here. Whether the data support such a case may be a bit clearer by Wednesday afternoon (after the quarterly suite of labour market data are out), although I don’t suppose that whatever the data show an early OCR cut is at all likely.
There is an interesting piece in the Financial Times today on “Why central banks are reluctant to declare victory over inflation”. Setting aside the fact that such language is more George Bush “Mission Accomplished” and never likely to be heard from central bankers – my old line (with acknowledgements to von Clausewitz) about inflation was “the price of price stability is eternal vigilance” – it nonetheless touches hardly at all on what must be one of the biggest factors weighing on the minds of central bankers. Having stuffed up so badly (a description rarely heard, although it should be more openly acknowledged) and delivered us into very high inflation and all the attendant unexpected wealth redistributions etc, central bank reputations took something of a well-deserved hit (a change since 2019 that of course Conway chose not to mention). They were too slow to reverse the easings of 2020 and the public paid the price. For them, reputationally, perhaps the worst possible thing now would be to begin easing, cutting policy rates, only to find in a few quarters time that inflation really wasn’t securely settling near target. There would be considerable public and political unease if they were soon tightening all over again. By contrast, people are attuned to the idea that squeezing out inflation involves some pain, so why not take the free (to them) option until they are 100 per cent sure inflation really is on course).
One problem then is that the interests of the individual central bankers – mostly still holding the offices they did in 2020/21 – aren’t necessarily well-aligned with the wider public interest. To be 100 per cent sure that inflation was well on course towards the target midpoint also necessarily then means quite a high risk of overshooting (both that inflation ends up going below target midpoint – as in so much of he pre Covid decade, here and abroad) and that output and employment are unnecessarily sacrificed. That, in turn, might be less of an issue in the US, where the economy has held up, then (say) here where we’ve already had last year some of the very weakest per capita GDP growth of any OECD country.
Much of the discussion about the possibility of rate cuts this year tends to proceed – perhaps not consciously but it is the effect – as if the two choices were to keep rates at current levels or to take them quickly back to neutral (wherever that unobserved variable might be – our RB thinks somewhere under 3 per cent). But those aren’t the choices central bankers actually face. I very much doubt it would be prudent for interest rates to be anywhere near neutral right now, but relative to how things looked when the OCR got to 5.5 per cent first in May 2023, there is a lot more reason now to be confident that the worst is past. Back then it was purely prospect but now we have some hard evidence, and we know that monetary policy works only with a lag. More disinflation is, as it needs to be, in the works. It isn’t impossible than an OCR of 5 or 5.25 per cent would now be better than one of 5.5 per cent.
Of course, none of any of this was in the Conway speech, which really did seem to be just about buying time/space to get the MPC through to the end of February (after its inexcusable three month summer break).
In conclusion….well, this was Conway’s
It was really quite remarkable for its avoidance of any responsibility. You’d note know from this that any central bank’s conscious and deliberate choices played any part in inflation being well above target for three years in succession. When you can’t acknowledge your part in a really bad, costly and disruptive, set of outcomes, it is really hard to be confident that you are really any sort of “learning organisation” or that the much-vaunted (but as yet unseen) research will be for anything other than support rather than illumination.
Central bank monetary policy speeches are rare enough in New Zealand. On the rare occasions MPC members do speak we deserve better than Conway’s effort. The Governor is due to speak next week. HIs speeches to the Waikato Economics Forum have tended to be substance-free zones, but I guess we can always hope.
And I hope the Minister of Finance and her advisers are taking note, and are looking to find and appoint rather better people to fill the two MPC vacancies arising in the next few months.