I’m not a huge fan of central banks publishing medium-term economic forecasts (or projections as we were usually schooled to call them). As I understand it, decades ago the Reserve Bank of New Zealand only started publishing them because the Official Information Act was passed (and in those days the forecasts made little or no difference to policy so there wasn’t even an arguable ground for withholding). My scepticism only increased as the projections assumed an increasingly significant place in the policy communications, including the move to endogenous interest rate projections from 1997. It isn’t that a central bank’s forecasts are likely to be worse than anyone else’s, just that medium-term economic forecasting (cyclical stuff 2-3 years ahead) is really a mug’s game, and those medium-term forecasts rarely if ever have much impact on the accompanying OCR decision. OCR decisions are almost always, and necessarily (given the state of uncertainty, limited knowledge etc), driven by the latest data releases, which are at best real-time contemporaneous, and more often relating to periods a month or three back (the latest NZ GDP data are for the quarter that ended in March). And that is as it should be. And yet in my experience of the Reserve Bank forecasting and policy process, inordinate amounts of time (including time of the Governor) was spent on numbers for periods so far ahead they would, almost inevitably, be quickly invalidated; often more time (and more senior management smoothing, for messaging purposes) on where we thought things might be in 2 years than on where we think they are right now. I recall a speech some years ago now from a retiring senior European central banker who suggested that perhaps central banks shouldn’t bother publishing for horizons much more than six months, and that line still has some appeal to me. It isn’t about trying to withhold information, but about having nothing useful to say and no robust grounds on which to say it. None of that is a criticism of the Reserve Bank, or their peers abroad, it is just the state of (lack of) knowledge.
Of course, the international trend has been in the other direction, with more central banks publishing more forecast information, and for the time being we are where we are. The Reserve Bank of New Zealand was once considered a leader in forecast transparency, but there are some areas in which they really aren’t very transparent at all. Thus, despite the (quite appropriate) policy focus on core inflation, the Bank does not publish forecasts (even for the next few quarters) for any of the measures of core inflation, and despite the evident seasonality in the inflation data (sufficient for SNZ to publish seasonally adjusted series), the Bank’s inflation projections are not seasonally adjusted (in contrast to almost all quarterly quantity series). On core inflation, even the Reserve Bank of Australia, publishes projections (albeit at six-monthly rests rather than for each quarter) for annual trimmed mean inflation
But if I’m sceptical of the merits of published forecasts, that doesn’t mean those forecasts have no information about the central bank’s own thinking at the time of publication. In fact, the numbers can be – and often are – a significant part of the Bank’s storytelling and tactics, in support of a current policy stance. And how those numbers change over time can also be revealing.
You’ll recall – I highlighted it in my post last Thursday – that one of the good features of last week’s MPS was the upfront acknowledgement that core inflation was hanging up, and that if anything domestic inflation had been a little higher in the most recent quarter than the Bank had been expecting. For example, the minutes record that “measures of core inflation remain near their recent highs”, a point reiterated a couple of times in chapter 2 (the policy assessment). In case there is any doubt, they have a chart showing the core inflation measures grouped around 6 per cent (annual rate). The target, you will recall, is 2 per cent – the midpoint (that MPC is required to focus on) of the 1 to 3 per cent target band.
The Bank doesn’t use one of my favourite graphs, of quarterly core inflation
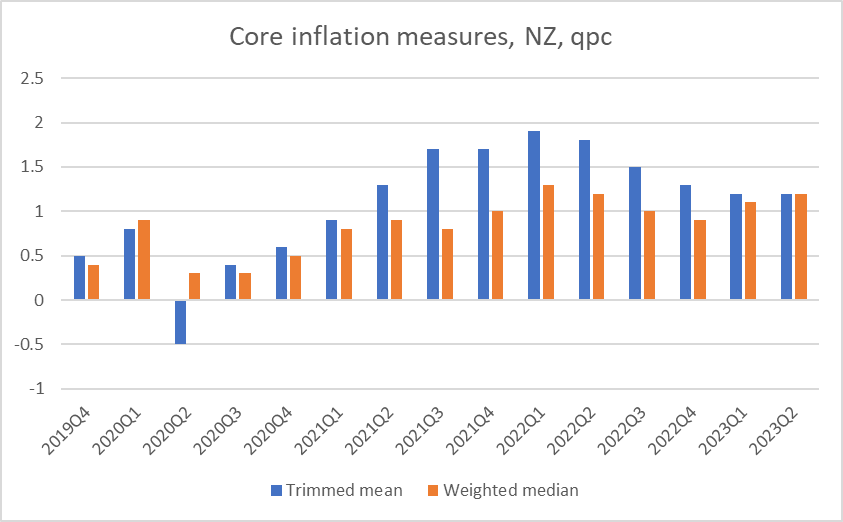
…but they don’t really need to. They seem to be in no doubt that core inflation has been hanging up, in ways that are at least a little troublesome.
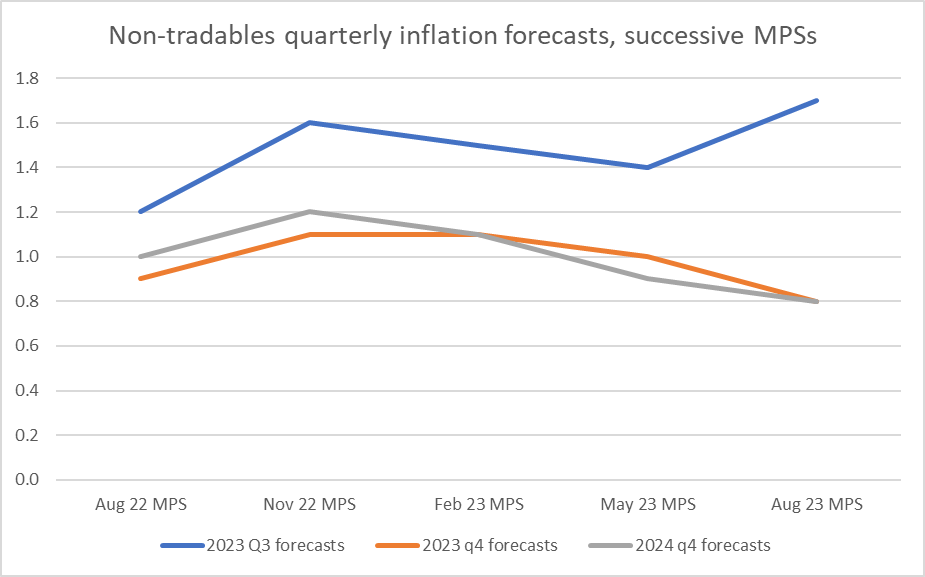
Of the published forecasts, the closest one to showing their hand on the outlook for core inflation is the forecasts for quarterly non-tradables inflation. Non-tradables inflation tends to run persistently higher than tradables inflation (for this century to date, annual non-tradables inflation has averaged 3.4 per cent while annual tradables inflation has averaged 1.4 per cent), and so even as tradables inflation has been abating, non-tradables inflation has been running at an annualised rate 6.6 per cent, a bit higher than core.
Looking out to the medium-term, the Bank seems to consider that non-tradables inflation of about 3.3 per cent will be consistent with inflation being at 2 per cent (for the final year of the projections, to September 2026, they show things being settled at those rates).
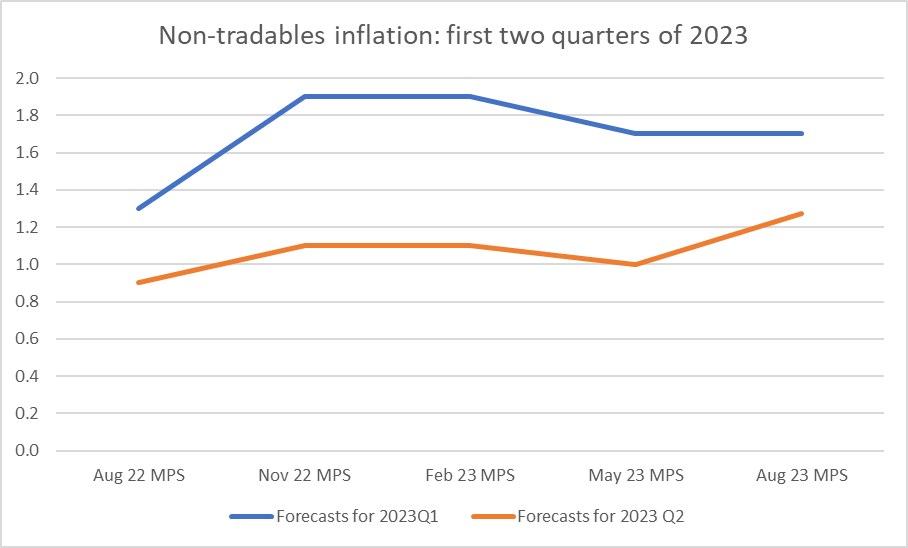
In the nearer-term they have generally been having to revise up their forecasts for non-tradables inflation. Here is how RB forecasts evolved over the last year towards the actuals for the two quarters in the first half of 2023.
And here is the SNZ series for non-tradables quarterly inflation on a seasonally adjusted basis.

That last observation is modestly encouraging although (a) per the previous chart, it was quite a bit higher than the Bank was expecting, and (b) there is no sign of anything similar in the analytical core inflation measures themselves. Better than the alternative I guess, but nothing to hang your hat on (and as I noted earlier, when writing about inflation outcomes to date the Bank does not do so in the MPS – it is appropriately uneasy about core and domestic inflation holding up).
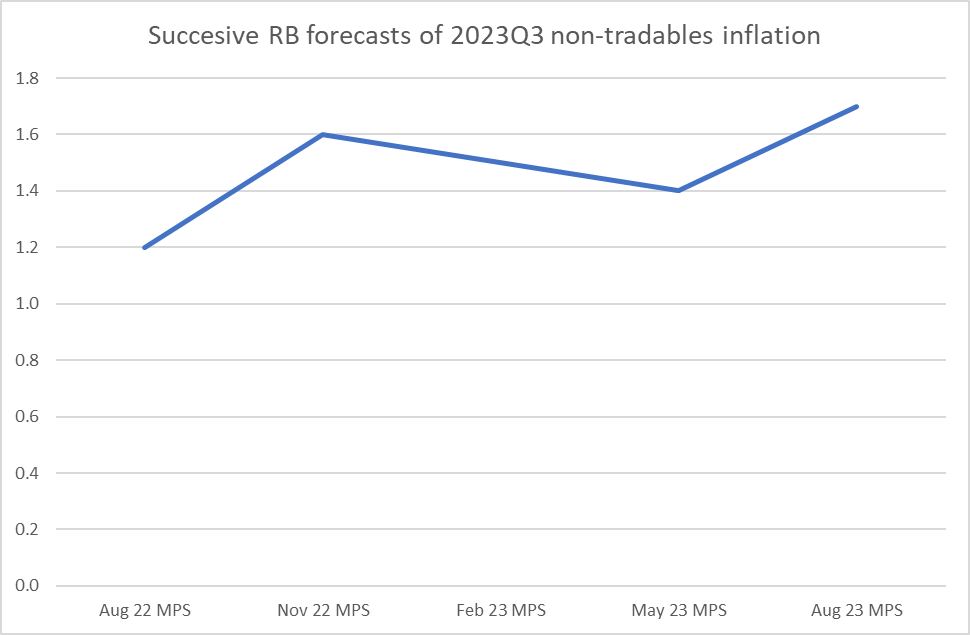
As it happens, the Bank has also been revising up its forecasts of Q3 non-tradables inflation – its latest view for the current quarter is (a touch higher) than any of its projections for the quarter over the last year.
But….seasonality matters. The Bank doesn’t publish its inflation forecasts in seasonally adjusted terms. But if we compare the actual data, seasonally adjusted and not, we can back out some approximate seasonal factors, and convert the Bank’s projections into (approximately) seasonally adjusted terms (more technically oriented people could no doubt do it more formally).
This is the result
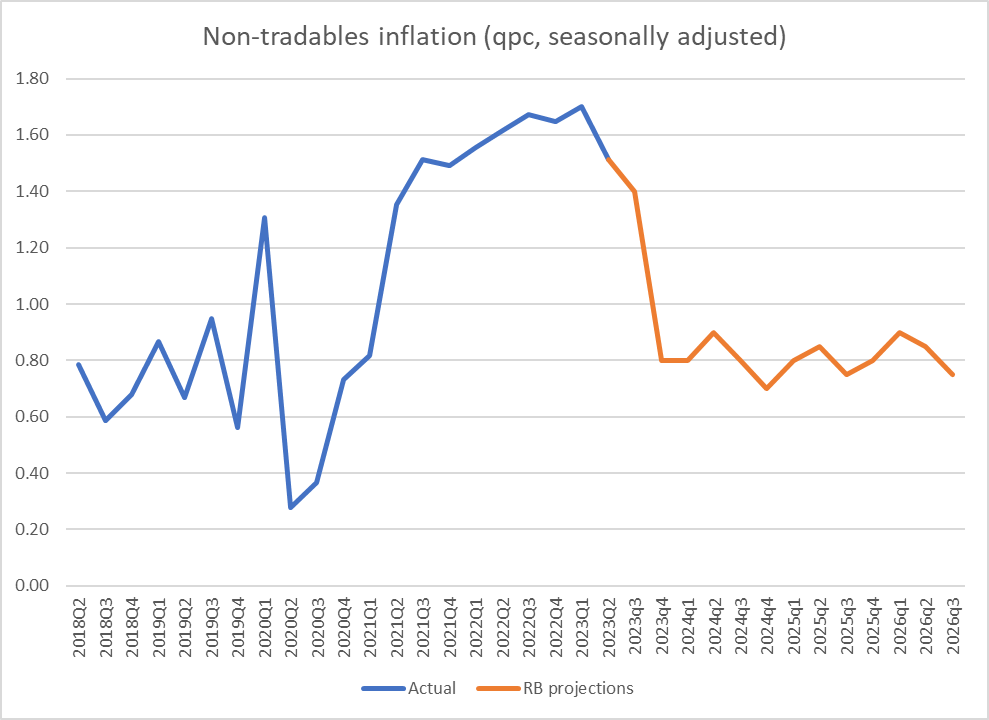
On these projections, non-tradables inflation (projections for which have been revised up to new highs) does fall a bit in in the September quarter, but then by the December quarter – measured centred on 15 November, now less than 3 months away, starting less than 6 weeks from now – suddenly the whole domestic inflation problem is solved. In (rough) seasonally adjusted terms, non-tradables inflation is back down to 0.8 per cent for the December quarter, a rate not seen since the start of 2021, and a rate consistent with all the inflation problems being solved. Annual rates take a while to come down to be sure, but any policy-setting agency would be firmly focused on quarterly tracks and…..within three months we are there (at least according to the Reserve Bank).
Quite the contrast: revising up the Q3 forecasts (a quarter we already know a bit about) and revising materially down the December 2023 and March 2024 forecasts, which we don’t yet know anything firm about.
I won’t bore you with the charts but it is not as if they are suddenly expecting a much sharper rise in the unemployment rate. Actually, unemployment rate projections for the next 6 months have been revised down quite a bit.
It all seems like a rather miraculous good news story. and yet one that the Bank left buried in the website tables and made no mention of at all, not in the MPS itself or at FEC.
Suggesting they don’t really believe it themselves. How likely is that we’d go from an entrenched (core) inflation problem now (and in the most recent published quarter) back to something consistent with the target midpoint in a matter of weeks? Frankly, it doesn’t seem very likely.
One possibility – and who knows if it is the explanation – is that they really don’t want to raise the OCR again. That might be for political reasons, or because they like this idea of being (one of the first) central banks to reach a peak rate (or some, conscious or unconscious, mix of the two), but had those quarters from 2023Q4 into next year been a bit higher – domestic inflation abating more gradually, consistent with the fairly modest recession forecasts – they would have been under a great deal more pressure to raise the OCR now or in early October. Neither explanation would be to the Bank’s credit. Perhaps neither is the correct story, but then we don’t have any explanation at all from the Bank. If they really believed inflation was collapsing as we speak, surely they’d have told us?
There are some other odd features in the numbers. Take the wage forecasts for example. The Bank doesn’t publish forecasts for the only data we have on wages rates themselves (that is the stratified LCI Analytical Unadjusted series). As I’ve shown previously, inflation in private sector wage rates seems to be levelling off (but not yet falling).

The Bank publishes forecasts for the LCI itself, for the private sector. The LCI is not a measure of wage rate but is designed to be a proxy for something like unit labour costs. Over the decades inflation in the headline private sector LCI has averaged somewhere not too far from the core rate of CPI inflation.

Eyeballing the chart might suggest that annual increases in this measure of the LCI of around 2 per cent might be roughly consistent with inflation at target.
Here are the Bank’s forecasts for LCI inflation
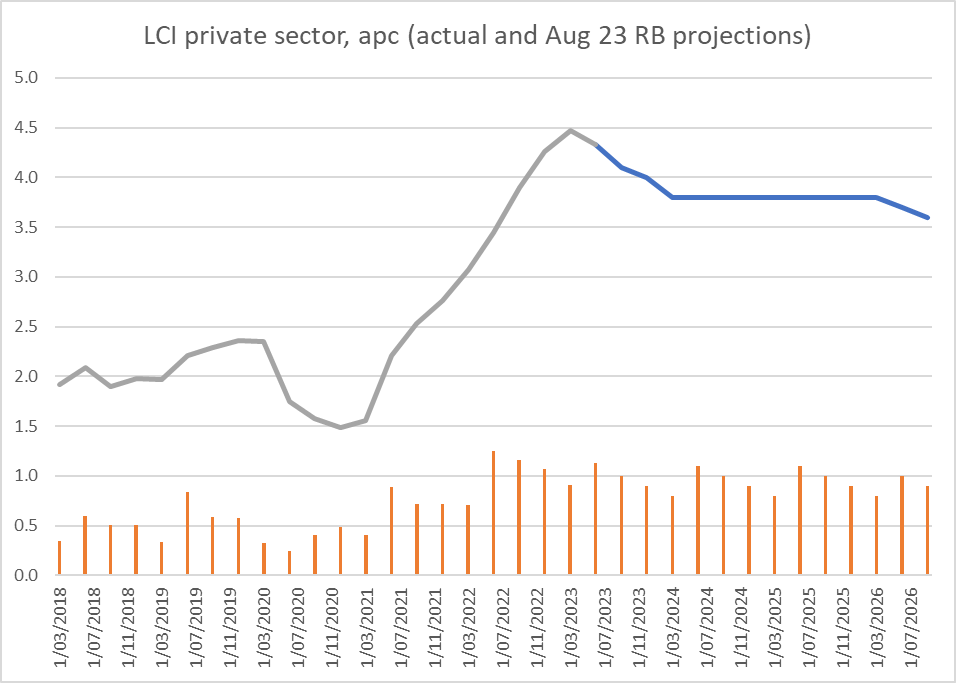
Note first that straight line. No model will have produced that, but rulers are a handy tool for forecast teams responding to gubernatorial whims. But more importantly, note that again they think the job is all but done – those quarterly rates of increases come down hardly any more (that apparently now being consistent with core inflation at the 2 per cent target, but again with no explanation). But then this measure of wage inflation holds up at a remarkably high levels even as the unemployment rate rises from the current 3.6 per cent to 5.3 per cent and only gets back to 5 per cent by the end of the projection period. It doesn’t make a lot of sense and simply isn’t very plausible.
None of it makes much sense. And these days, with a central bank whose Governor and Board chair just make up stuff when it suits, it is impossible to take anything they say or publish at face value. Which is a terrible place to be, when so much power is vested in the Bank, and so much havoc and loss wreaked, with no sign of any effective accountability at all.

Interesting that you pondered that there could be political reasons at play and that they may not believe their own stats.
I took a similar view back in may:
https://nzpolitics.substack.com/p/why-did-the-rbnz-say-were-at-the
Can you tell me, has there historically been a lot of politics involved in the RBNZ?
Thanks,
Lewis
LikeLike
No, historically there has not been,and at times there has been quite a bit of tension between Beehive and Bank. I should be clear that if politics is playing a part at present it will be Orr driven (I’m not suggesting the govt is putting pressure on or anything of that sort). Orr’s personal position will be v difficult if there is a change of govt, because of his style/attitudes etc, in a way we haven’t seen in past changes of govt.
LikeLike
Interesting, NZ really is a very different place nowadays.
I think things would work better if there were better separation but with the RBNZ advising the govt about economic implications of their policies at the conception stage. It would be nice if the OCR could be more stable and tweaks could be done by the government in their policies rather than by the RBNZ as a reaction.
LikeLike