Next week will see the first Reserve Bank OCR announcement (and Monetary Policy Statement) for the year (and for some time, given the long summer break the Bank took). They’ll be trying to make sense of a whole range of data, including no doubt the quarterly labour market data to be released tomorrow. And while no one expects the OCR to be changed next week, some commentators (and markets) appear to have turned their attention to the question of when the OCR might be raised – with some talking of that possibly happening later this year. I’m sceptical of that: apart from anything else, whenever a central bank changes direction in a year (and it was only November 2016 when the OCR was cut to the current 1.75 per cent), it usually involves correcting a past mistake. Perhaps last year’s OCR cuts will prove to have been a mistake. If so, I (and, almost by definition, the Reserve Bank) will be surprised.
Inflation has picked up over the last few quarters. But then it needed to. Annual headline CPI inflation had been below 1 per cent for two years, and although headline inflation shouldn’t be (and typically isn’t) the focus of monetary policy, it wasn’t something that could be entirely ignored either, partly for the risk that people (households and firms) would increasingly come to treat inflation well below 2 per cent as normal – the implicit assumption they use in economic behaviour. As a reminder, the Governor and the then Minister of Finance made the 2 per cent midpoint of the target range the explicit focus for monetary policy in the 2012 Policy Targets Agreement.
Headline inflation isn’t the focus of policy, because it is thrown around by all sorts of things (some from the market, some from governments) that monetary policy either shouldn’t or can’t sensibly do much about. There is no single or ideal measure of “core” or “underlying” inflation – which try to abstract from those one-offs and get at the medium-term trend in inflation.
But whichever of the many different measures one uses, there is little doubt that the medium-term trend rate of inflation was also well below 2 per cent for a prolonged period. On some of those measures there were even concerns that underlying inflation might be falling away further, and that that process could, if things went really badly, become self-reinforcing. In essence, that weakness in inflation was the justification for the succession of OCR cuts from mid 2015 to late last year.
Here are the six core measures I’ve used previously.
| Annual inflation rate | |||
| Dec-14 | Dec-15 | Dec-16 | |
| CPI ex petrol | 1 | 0.5 | 1.4 |
| Weighted median | 1.5 | 1.5 | 2 |
| Trimmed mean | 0.7 | 0.4 | 1.6 |
| Factor model | 1.2 | 1.1 | 1.5 |
| Sectoral factor model | 1.2 | 1.5 | 1.5 |
| CPI ex food and energy | 1 | 0.9 | 1.6 |
| Median | 1.10 | 1.00 | 1.55 |
At the low point, the median of these six measures was around 1 per cent, although it seems unlikely that policy was being made on that basis – the Governor often talked of core measures being still comfortably inside the target range, and on occasion explicitly emphasised the sectoral factor model measure as his preferred indicator. That measure is certainly the least volatile of all the underlying measures (over the whole history of the series), although it has its own limitations – including that the series is prone to historical revision as new data about the present emerge. But for what it is worth, here is the chart of the sectoral factor model measure.
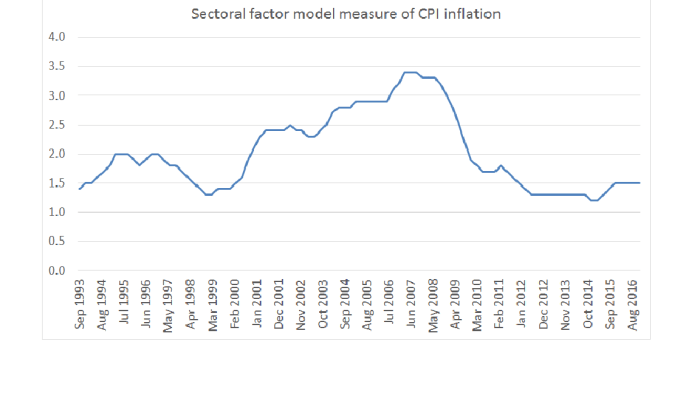 The fact that this measure is not very volatile tends to mean more weight should be put on deviations from the target – they aren’t likely to be simply “noise”. Perhaps the latest estimates will eventually be revised up a little in time, but as it happens the sectoral factor model estimate is now around the median of the whole suite of core measures. The medium-term trend in inflation was probably around 1.5-1.6 per cent late last year.
It is interesting that we don’t see a rise in core inflation in the other advanced economies taken as a group. Headline inflation is rising somewhat on account of petrol prices, but exclude food and energy – the most widely available core measure – and here is what we find in the OECD data.
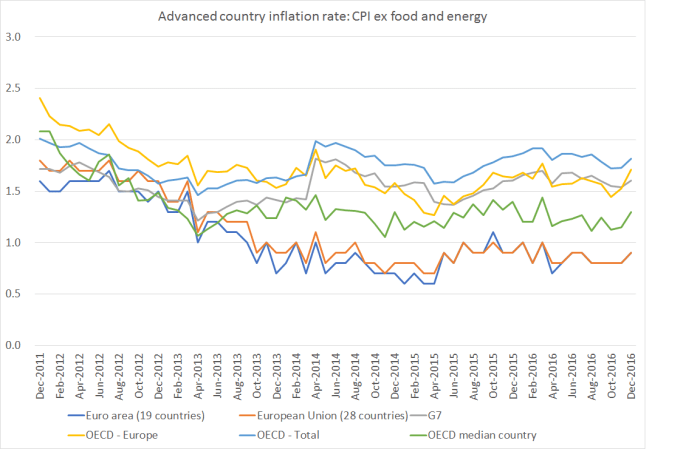
It is monthly data and there is a bit of month to month volatility, but no real sign of any sustained rise in this measure of core inflation. I’d tend to put most weight on the green line – the median inflation rate among all OECD countries. In most countries, inflation also appears still to be below the respective inflation targets.
When the Reserve Bank was cutting the OCR last year, opponents of further cuts were sometimes heard arguing that “the case for cuts isn’t that good, and anyway, monetary policy isn’t likely to do much good [at such low interest rates/in this global climate]). But the data suggest quite the opposite. Here are a few measures of New Zealand real interest rates over the last five years.
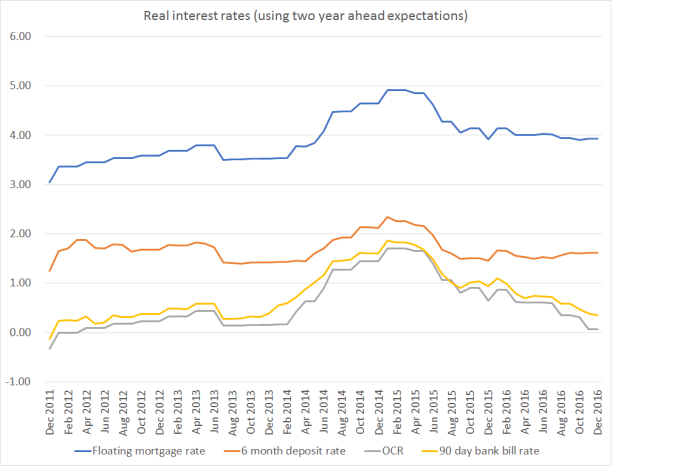
Real interest rates rose in 2014 and into early 2015 as the Governor (supported by his advisers) raised the OCR by 100 basis points. The medium term trend rate of inflation was low when the tightening phase started and, if anything went a bit lower subsequently. It is likely that the weakness in inflation was the result of some combination of weak global inflation, the sharp fall in oil prices (spilling over into core measures) and the Reserve Bank’s monetary policy stance, which also helped drive the exchange rate up. It is now generally accepted that the 2014 tightenings were simply unnecessary, although perhaps reasonable people can differ on the extent to which the mistake was foreseeable at the time. But there is little doubt that the unnecessary tightenings stood in the way of inflation getting back to around the middle of the target range.
From mid 2015 the Reserve Bank was cutting the OCR. The cuts were initially rather grudging – the Bank was uncomfortable with recognising that they had got things wrong previously – but in total ended up being quite large. A cumulative cut in the OCR of 175 basis points was needed simply to undo the effects of the 100 basis point tightening because expectations of future inflation fell quite materially, largely in response to the persistently low actual (headline and core) inflation. Even now, real retail interest rates are not quite as low as they were when the tightening cycle began in early 2014. The easier stance of monetary policy helped support growth in demand and activity – although even now per capita GDP and income growth remains unspectacular. And of course – subject to data updates tomorrow – there is still excess capacity in the labour market, with the unemployment rate having been still well above Treasury’s estimate of the NAIRU.
Who knows what the outlook is from here. If the TWI remains at current levels, the recovery in headline inflation could be shortlived. Perhaps the medium-term trend in the rate of inflation will rise further. We should hope so. I wouldn’t be advocating further OCR cuts at present, but it seems to me that the best approach at present is to assume that we have little knowledge about the future, and that if an OCR change is required in the next 12-18 months it might as easily be a further cut as an increase. Since the 2008/09 recession the Reserve Bank was twice started tightening phases that proved to be unnecessary and had to be reversed. And in those cycles they typically had the support of market economists and financial markets. Given that track record, the absence of any real rise in global inflation, and the difficulties of making sense of what has been going on, a prudent approach might be to wait to see core inflation actually at 2 per cent before looking to raise the OCR. If the unemployment rate were to drop sharply further, or if per capita growth accelerated sharply, that stance might reasonably be reassessed.

As I have predicted last year, as the 115,000 international students start to re-enter NZ together with their upfront $1 billion in school fees payable plus spending money of $4 billion for the year, many of whom will require to buy NZD and to deposit into NZ bank accounts, there would be upward pressure on the NZD. This would dampen the effect of the recent rises in oil prices as the NZD rises. The RBNZ would still have to deal with inflation in the lower end of the 1% which has been the consistent story of inflation for the last 6 years. With China struggling on over production capacity in a global market stagnation and the rising competition from places like Indonesia, India and Vietnam. Inflation remains muted.
As NZ bank accounts start to swell in savings deposits, there would be downward pressure on interest rates. Banks would be very keen to lend out those deposits but with 40% LVR restrictions on property investment lending we would likely see interest rates fall in order for the banks to retain profitability.
With Trump creating huge political unrest in the US, it is unlikely Yellen would be raising interest rates too quickly. Business leaders are struggling with inconsistent Trump Tweeting policies, no decision is usually good decision in this time of uncertainty and when you are busy protesting in huge crowds then your labour force is busy not doing much.
LikeLike
With the Unitary Plan in limbo and partially operative due to legal wrangles in court by NIMBY groupies, developers and builders are having to deal with what can or can’t be built. Supply continues to be constrained which places upward pressure on house prices for the rest of the year. As New Zealanders return from a nasty Brexit and Australia’s economy still looking sickly, we will continue to see population growing. As the 115,000 international students re-enter NZ and need accomodating, rents start to rise and landlords will feel more comfortable and as house prices rise, the effect of of the 40% LVR starts to dwindle.
LikeLike