Designing monetary policy committees

Last week the Reserve Bank of Australia hosted a conference on Central Bank Frameworks: Evolution or Revolution.  I wrote last week about the paper by Reserve Bank Assistant Governor John McDermott, which was given at the conference.

But when the RBA yesterday released most of the rest of the conference papers, I noticed one that really should be relevant to the current New Zealand work underway reviewing and revising the Reserve Bank Act.  Unfortunately, it isn’t a fully worked-up paper, but the slides on “Robust Design Principles for Monetary Policy Committees” have plenty of content (and no equations, for those wary of what they might offer in such contexts), and should offer food for thought for the Minister of Finance and his Treasury officials as they pull together the new legislation.  Unfortunately, as far as I can see, the proposed New Zealand model is mostly quite inconsistent with the arguments of the conference paper.

The authors of the paper/presentation have plenty of central banking experience.  Andrew Levin is now a professor at Dartmouth, but spent most of his career in research and policy roles on the staff of the Federal Reserve in Washington. And David Archer was formerly head of financial markets and then head of economics at the Reserve Bank of New Zealand, and is now head of central banking studies at the Bank for International Settlements (perhaps somewhat ironic in that David was once known internally for his advocacy –  not entirely in jest –  of staffing the Reserve Bank of New Zealand with no more than 20 people, including (if memory serves) a cook).  David was also one of the peer reviewers for Iain Rennie’s review of monetary policy governance here.

Levin and Archer set out what they are trying to achieve:

  • Formulate a set of robust design principles for monetary policy committees (MPCs), that is, the decision-making body delegated with setting the course of monetary policy. 
  • These principles are intended to mitigate the risk of severe policy errorsarising from two sources: (1) political interference and (2) excessive insularity (“group-think”).

As they note,

  • The operational independence of the MPC fundamentally rests on the degree of public confidence in the legitimacy of the institution. 
  • These considerations provide a crucial rationale for ensuring the transparency and public accountability of the MPC.

As they further note, committee-based decisionmaking for monetary policy is now standard practice around the world, but

However, the benefits of having a committee can be severely undermined by group-think:

  • homogeneity of committee members
  • consensus-based decisions
  • lack of external reviews 

In light of those considerations, the MPC should comprise a diverse group of experts who are individually accountable for their policy decisions.

I’m not totally persuaded by the “experts” line myself –  one needs lots of expert input/advice to policy, but when it comes to decisionmaking, soundness is at least as important as cleverness.  But, for now, I’m mostly telling the Archer/Levin story.

They present some material illustrating the point that legislative independence can (a) be readily taken away if the central bank oversteps badly, or  can (b) be of little effect.  In the latter camp, they include the effective subservience of the Federal Reserve to the US Administration from 1933 to 1951, but –  as they were presenting in Sydney –  they could as readily have used the example of the Reserve Bank of Australia, which had legislative independence from its creation in 1959, but no effective policy operational autonomy.  Since the RBA still operates under the same legislation, perhaps it would have been undiplomatic to the hosts to make that point?

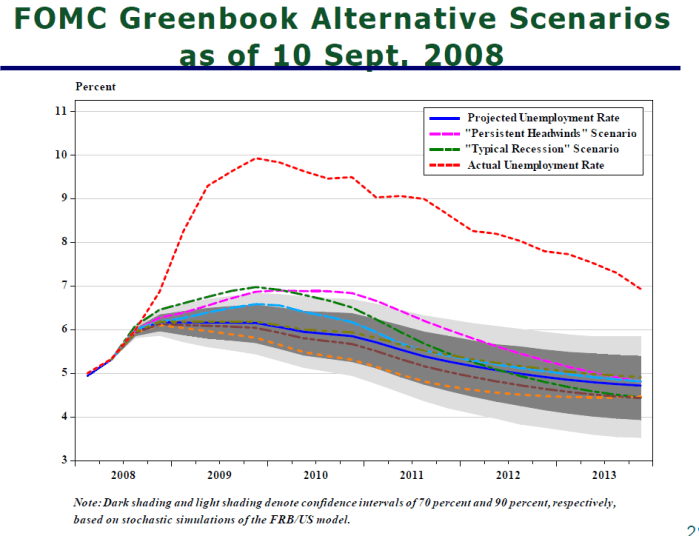
One of their big concerns is “groupthink” –  the risk that people within an institution (MPC or more generally) will all come to see the world the same way and in the process miss something really important.  They use as an example the Federal Reserve heading into the 2008/09 crisis.

  • During 2005-06, officials at the Federal Reserve and other agencies overlooked warning signs regarding the risk of a collapse in house prices. 
  • During autumn 2007 and early 2008, Fed officials misattributed the widening of interbank spreads to liquidity factors rather than counterparty risk. 
  • The FOMC met on Tues. 16 Sept. 2008, two days after Lehman’s failure, but still did not perceive that the U.S. might be heading into a financial crisis and a severe economic downturn.

And they illustrate the point with this chart
archer levin

It is a pretty staggering failure. But, to be honest, I’m not sure it is very enlightening on the question of the best possible design and structuring of monetary policy committees.  For example, I’m not sure there is evidence that central banks with governance and decisionmaking processes more consistent with the Archer/Levin preferences did less badly, in recognising emerging issues and risks, than others.  And, in many (although not all) respects, the US system fits better with their principles and preferences than those of many other countries.

But I’m jumping ahead.  What are the principles Archer and Levin lay out?  First

The MPC should be a fully public institution whose members are accountable to elected officials and the general public.

Quite a few central banks  –  including several in the euro-area, Switzerland, South Africa, and the regional Feds in the US –  still have private shareholders.  That hasn’t been an issue here since 1936. In most countries, the private shareholders have no real influence, but in the US they do still play a role through the appointment of heads of regional Feds, who in turn sit (in rotation) on the FOMC.   That should be fixed, and may even be unlawful –  an issue Peter Conti-Brown covered in his book I wrote about here.

The second principle is

The selection of MPC members should ensure diverse perspectives and forms of expertise. 

  • Earlier studies of MPCs were mostly focused on hetereogeneouspreferences (hawks/doves) or the hetereogeneity of anecdotal information. 
  • In contrast, this principle combats group-think by appointing experts with diverse educational backgrounds and professional experiences. 
  • Geographical diversity may also be crucial for fostering & maintaining public legitimacy.

And the third is

The process of selecting MPC members should be systematic, transparent, and consistent with democratic legitimacy. 

  • The process should have “checks and balances”, i.e., multiple steps involving different sets of decision-makers. 
  • Transparency mitigates the risk of undue influence by special interests. 
  • The process should foster public confidence in the integrity of the institution.

In general I agree with this, but this is an area where the US does reasonably well, at least for the core members of the FOMC, the Fed Board of Governors.  They are nominated by the President, and subject to confirmation by the Senate, one of the most open processes anywhere.   By contrast, the proposed New Zealand system will have the Governor and the Reserve Bank Board –  neither with any direct democratic legitimacy or accountability –  driving the appointment of MPC members, with the Minister of Finance having no ability to interpose his or her own candidates.  And there is no public or parliamentary scrutiny of individual members proposed, either before taking office or afterwards.

The MPC’s size and voting rules should foster genuine engagement among members and diminish the influence of any single individual. 

  • This principle mitigates the risks of autocracy, which has pitfalls like those of group-think. 
  • Previous analysis prescribed a fairly small size as optimal for engagement (e.g., 5 members), but a somewhat larger size may be needed to encompass sufficiently diverse perspectives.

In principle, the US system does well on this score.  No one on the FOMC owes or her appointment to anyone else on the committee, and many of the members are based outside Washington.

And they propose

Terms should be staggered, non-renewable, and last longer than the political cycle, with removal only in cases of malfeasance.

The non-renewability point is about limiting the risk of inappropriate political interference.  I have some sympathy with that point –  Archer elsewhere argues for single seven year terms.  Then again, non-renewability even more severely restricts the possibility of holding MPC members to account for their contribution or performance.  For my tastes, Archer/Levin lean a bit too much on the side of protecting against political interference, and bit too little on the imperative on ensuring that the appointees actually do the job they have a mandate for.

Principle 6 is a very important one in my view, and one which our Minister of Finance appears to have totally discounted.

Each MPC member should be individually accountable to elected officials and the public. 

  • Individual accountability is crucial for mitigating the risk of group-think.
  • Such accountability should occur through MPC communications, speeches & interviews, and hearings before elected officials. 
  • To avoid cacophony, the MPC must clearly explain the rationale for its decisions as well as elucidating the range of individual views.

By contrast, our Minister of Finance has plumped for consensus as far as possible, and no individual identification of the range of views.  That conduces not just to groupthink, but to free-riding (by minority external members).   There is much stronger individual accountability in the Swedish, UK, and US systems.   That said, as the example Levin and Archer used shows, no system of governance guarantees against policy mistakes.

The MPC should be subject to periodic external reviews of its strategy and operations, but not its specific policy decisions. 

  • External reviews can be invaluable in identifying and mitigating group-think.
  • Such reviews should occur on a regular schedule rather than triggered by political motives or idiosyncratic factors. 
  • These reviews should focus on assessing past & prospective performance, not on evaluating individual policy decisions.

It would seem highly desirable to build such external reviews into the system, perhaps every five years.  They should be commissioned by the Minister and Treasury, and should complement any reviews the MPC undertakes, or commissions, of its own performance.

In addition to any statutory goals, they argue

The MPC’s medium-term policy framework should be approved or endorsed by elected officials roughly once every 5 years. 

  • This framework should provide a quantitative description of the MPC’s objectives, priorities, intermediate targets & operating procedures. 
  • The approval or endorsement of elected officials is crucial for the legitimacy and credibility of the policy framework.

In a New Zealand context, it might be desirable to have the document that replaces the Policy Targets Agreement be subject to parliamentary ratification (as the –  much less important –  Funding Agreement is).

I’m less convinced of their next principle

The MPC should formulate a systematic and transparent strategy that guides its specific policy decisions over the coming year or so.

Easy enough to write down, but hard to make it mean anything particularly specific.

And their final principle is

The MPC should regularly publish reports explaining the rationale for its specific decisions in terms of its policy framework and strategy. 

These reports should explain the rationale for the majority’s decision along with concurring and dissenting opinions that clearly convey the range of individual views.

I agree.  A good comparison is with the decisions made by higher courts, which in effect sit as a committee.   Majority and minority opinions are published, and groups of members may come together in support of a particular written opinion, rather than all penning one each.

Perhaps they were running out of time, but the last slide only has headings

Insiders & Outsiders on the MPC 

  • Full-Time vs. Part-Time 
  • Executive vs. Policymaking Roles 
  • Differential Terms of Office

Fortunately, we know from David Archer’s comments on Iain Rennie’s draft report what he thinks on the insiders vs outsiders issue.

Turning first to the balance of internals and externals. The tendency to groupthink, with the most powerful member of the group being the “seed” of the group view, is the biggest impediment to harnessing diversity. The probability of groupthink increases with the presence of hierarchy.

F. The law should restrict the proportion of executive insiders to below half, by a big enough margin that these tendencies have a chance to be offset.

Sadly, our Minister of Finance has chosen a model –  a permanent majority of insiders, the Governor having significant influence on other appointments, and no freedom to speak externally – which will entrench hierarchy, create a strong likelihood of groupthink.

And here, from Archer’s earlier comments, are his thoughts on publication of minutes, and openness about the range of views and perspectives.

Turning now to the public presentation of committee decisions, claimed improvements in policy transmission mechanisms flowing from singular official views about future policy are ephemeral. Apparent unanimity is quickly shown to be untrustworthy spin.

The essential reason is that the future is largely unknowable, and it is foolish to pretend otherwise. Consider the records of the few central banks – including the RBNZ – that publish forward policy interest rate paths. Forecast paths are almost always poor predictors of reality, even in the RBNZ case where unanimity about the outlook exists by construction. Being honest about the limited predictive powers of even highly paid specialists is likely eventually to increase their trustworthiness, at least relative to the results of repeated false marketing of ostensible consensus. With unknowable future shocks, the real predictability problem relates to how policy will react to new events. To predict that, one has to know policy preferences and the mental frameworks used to process new information (as well as forming a view on what new information might arrive). Given clear legal objectives supplemented by PTAs, the range of policy preferences in play should be constrained. The main thing then is to allow people to observe the variety of analytical frameworks being deployed. That is not helped by delaying the publication of minutes. Gains in withholding minutes are thus small, if they exist at all. At the same time, requiring members to withhold from expressing their true views in public, at least for non-trivial periods around policy decisions, may damage their ability or willingness to articulate alternative perspectives.

How can cacophony in communications be avoided without some formal constraint? One approach would be focus members’ attention on agreeing minutes that accurately reflect their individual contributions. Fairly full minutes, with attributed reasoning, can provide a better public platform for dissenters’ subsequent public utterances than can the soundbites of “managed” disclosures about policy decisions. If such minutes will be available soon, members are more likely to refrain from immediate but partial expressions of their views.

As I hope is clear, I don’t agree with everything in the Archer and Levin presentation but there is plenty of material here that really should be thought about by our Minister and Treasury officials, to a much greater extent than was evident in the papers published to date.  It isn’t too late to rethink these details, and doing so would be likely to lead to a better central bank –  better on substance, and more accountable and thus more enduringly legitimate.

As it happens, the Herald this morning has a first “interview” with the new Governor Adrian Orr.   It is a typical Herald piece as regards the Reserve Bank: giving the Governor a platform to speak, rather than showing signs of any searching or awkward questions.  I thought it was interesting for three things:

  • all the focus appeared to be on monetary policy, even though more of the Bank’s staff now work on the financial system regulatory and supervisory roles,
  • there was no mention of the scathing feedback on the Reserve Bank, regarding those same regulatory/supervisory activities, in the New Zealand Initiative report, and
  • while there was plenty of talk about broader perspectives etc, there wasn’t much (any) talk about doing the basics better.

Thus Orr talks grandly of leading the world

“We need a broader view of the what the central bank is really about. We’ve got an enormous amount of grey matter in here — that can be used more effectively,” Orr said.

“So what is global leadership in managing a small, open economy, what is global leadership in ensuring a sound financial system, what is global leadership in the delivery of the means of exchange?”

But not at all of the miles he –  and the Bank –  have to go just to catch up and come closer to doing excellently the basics Parliament has charged them with: keeping inflation near target, and supervising the financial system in a way where the analysis and regulatory actions consistently command confidence.  There was a lot of talk of “leading the world” back in the 1990s, and in some small areas, almost inadvertently, we did.  But I’m not sure it is a goal New Zealand taxpayers should be actively seeking to fund, and especially not when the domestic basics leave quite a bit to be desired.


(It is the school holidays, and my 11 year old daughter wants to tell people that instead of reading “all the boring stuff my Dad writes you should listen to Ed Sheeran instead”.  Personally, I’ll take Mozart or Handel over monetary policy –  let alone Ed Sheeran – any day.)
 

Immigration policy and wellbeing

Last week BWB Books published Better Lives: Migration, Wellbeing and New Zealand by Peter Wilson and Julie Fry, two consulting economists (as the authors explicitly note, one has lived overseas for a long time now, and the other is an immigrant to New Zealand).    It is an attempt to think about New Zealand immigration policy, and experience, in a framework broader than just economics.  And “wellbeing” is the new flavour of the year –  at the heart of The Treasury’s (questionable) Living Standards Framework, adopted by the government as nice-sounding rhetoric and a lens for next year’s Budget.  And, of course, there are various scholars overseas, and international agencies, doing work in the area.  In fact, the OECD’s Better Life Index provides the list of categories –  other than aggregate economic out-turns –  that Fry and Wilson use to frame their discussion of immigration policy.

Julie Fry has now been writing about New Zealand immigration policy for several years (having initially worked on it as a young Treasury economist 25 years previously).  There was the paper she wrote for Treasury, subsequently published as a Treasury Working Paper.  That paper had an explicitly economic focus (and I was quite involved with her work at that time). Her abstract for that paper concluded

More work is required to assess the potential net benefits of an increase in immigration as part of a strategy to pursue scale and agglomeration effects through increased population, or whether a decrease in immigration could facilitate lower interest rates, a lower exchange rate, and more balanced growth going forward.

At the time, the paper was quite controversial within Treasury because it wasn’t automatically supportive of the “big New Zealand” approach.

A couple of years ago Fry and Hayden Glass published a book (also by BWB) called Going Places: Migration, Economics and the Future of New Zealand .  That book seemed generally positive about the –  modest – economic contribution of immigration, but argued that any such gains could be maximised by focusing on bringing in as far as possible people who could make a real difference (noting that many of those coming under current policies don’t).

Our view is that New Zealand should seek more people who will contribute to economic transformation. By their nature, these are people who do not just fit in: we are looking for those who might disrupt, transform, provoke and cajole, connect New Zealanders with others and change the way this country does things.

Things like the Global Impact visas –  launched a year or two ago – fitted this description.

And then Fry and Wilson teamed up to do this new work, attempting to look at immigration policy through a wellbeing lens, including an attempt to find a way to think better about the potential relevance of the Treaty of Waitangi to the issues (my own early thoughts on some Maori dimensions of this policy issue are here).  As I understand it, the work began with some modest NZIER funding –  from their “public good” programme –  for an article on the issue.  It grew into a 275 page book (admittedly, BWB Texts pages are quite small) –  a big commitment by the authors.

They have had quite a bit of coverage.  There was a nice introduction to it on interest.co.nz, the authors were interviewed on Newshub Nation on Saturday, and The Treasury invited them in for a guest lecture last week (which I attended).

I haven’t read the book yet, and I don’t want to write about it substantively until I have done so.  Nine months ago I gave them extensive comments on a draft of what later became the book, but I expect that much will have changed since then.

Having said that, I’m instinctively sceptical of the wellbeing approach – especially if it is anything more than a relabelling of the economist’s basic tool, utility maximisation.   That doesn’t mean I think non-economic considerations are, or should be, irrelevant, but I’ve not yet seen any convincing sign that these proposed frameworks are generally very enlightening in helping shape policy positions.  Often they seem to provide cover –  sometimes unwittingly – for whatever cause or preferences the particular analyst favours (eg in The Treasury’s recent working paper on social capital I saw the suggestion that cars might perhaps be discouraged as being invidious to this particular analyst’s conception of “social capital”).  In this case, I think some pro-immigration people are sceptical that applying a wellbeing approach to immigration policy is not much more than an attempt to justify less immigration even if there are economic benefits.  Since I don’t believe that in New Zealand’s case in recent decades there have been such benefits, I’m probably more concerned about the (possible lack of) rigour of any attempt to broaden out the range of considerations, and uneasy that one or other component of the framework will be latched onto to make the case for more immigration (when what we’ve had looks to have been economically costly to New Zealanders as a whole).

But, as I say, I want to withhold substantive comment until I’ve finished the book –  so most likely I’ll write about it next week.  This post was prompted by various comments to other posts highlighting the new book, seeking comment, and in some case I thought unfairly criticising the authors.  I’d recommend people read the book –  it is pretty cheap –  or at least the article-length version of the argument published in Policy Quarterly, the Victoria University publication, in its pre-election issue last year.  Here was their conclusion in that article

Migration has been good for New Zealand, but it has not been great. We think using a well-being framework has the potential to make it better. Focusing on smaller numbers of more highly skilled immigrants, and considering important broader issues that a simple focus on per capita GDP allows us to ignore, should lead to more effective and more sustainable immigration policy for New Zealand.

As you imagine, I have mixed feelings about that conclusion, but it is worth reflecting on and engaging with.

Scathing feedback on the Reserve Bank

Late last week the New Zealand Initiative released its report Who Guards the Guards? Regulatory Governance in New Zealand which has a particular focus on the Financial Markets Authoritiy, the Commerce Commission, and (in its financial regulatory/supervisory roles only) the Reserve Bank.  All three are important economic regulators and, if we are going to have such entities, it is important that they are well-governed, and performing excellently (with associated accountability and transparency) the roles Parliament assigned to them.

As part of putting together the report, the New Zealand Initiative undertook a survey

To assess how well our regulators are respected, we surveyed New Zealand’s 200 largest businesses by revenue, together with those members of The New Zealand Initiative not otherwise included as members of the ‘top 200’. In practical terms, this approach allowed adding a sample of New Zealand’s leading professional services firms – accountants, lawyers and investment bankers – into the pool of businesses covered by our survey.   Only one response per organisation was permitted.

And this is what the survey covered

We asked survey respondents both to:
a. rank the regulators they interact with based on their overall respect for them; and
b. rate the performance of the three regulators most important to their respective businesses against a range of KPIs.

The KPIs were based on a combination of the best practice principles identified by the Australian Productivity Commission’s Regulator Audit Framework, and from a similar survey to our own commissioned by the New Zealand Productivity Commission for its 2014 report. The questions were designed to obtain a broad view of regulatory performance, and as such did not enquire into the merits of individual regulatory decisions or the fitness-for-purpose of individual regulators.

Rather, the KPIs cover issues like commerciality, communications, consistency, predictability, accountability, and so on.

For some regulatory agencies –  there were 20+ covered –  there were lots of responses: some regulation is pretty pervasive.  For others with a very sector-specific role, including the Reserve Bank, there were only a relatively small number of responses (8) –  but it seems likely that all the major banks and some other smaller institutions will have responded.

The Initiative is clear that it is a survey of the regulated.  That is not the only, or even the most important, perspective in assessing a regulatory agency.  Regulatory agencies are supposed to work in the public interest, as defined by Parliament, and that means constraining the actions/choices of individuals and firms.  Regulation is intended to prevent people doing stuff they would otherwise choose to do, or compel them to do stuff they would otherwise not choose to do.  In other words, one should worry if a regulator is popular with those it regulates.  Indeed, one of the big risks in any regulatory system is that the regulator and the regulated form too cozy a relationship  –  in which there is some mix of regulators making life easy for the the regulated (eg coming to identify more with the interests and perspectives of the regulators) or regulators in effect working with the bigger and more connected/established of the regulated entities to make new entry and competition less easy than it should be.

The Initiative acknowledges the point to some extent

Of course, we can expect regulators to be unpopular at times with the businesses they regulate. It is, after all, their job to place boundaries on what businesses can and cannot do. But just as we expect communities to respect the police, we should also expect the regulators of commerce to have the respect of the businesses they regulate.

Personally, I’m not sure I’d go that far. I don’t expect “communities to respect the police”, but expect (well, vainly wish) the Police to earn the trust and respect of the community.  But whether or not “respect” is quite the right word, regulated entities should be able to offer some insights that are useful in evaluating regulatory institutions.  And that is perhaps particularly so when, as in this exercise, the survey covers a wide range of regulatory institutions at the same time.   If one institution scores particularly badly relative to others –  particularly others in somewhat similar fields –  it should at least provide the basis for asking some pretty hard questions about the performance of that agency, and of those responsible for it (officials, Boards, Ministers etc).

In this survey, the Reserve Bank’s financial regulatory areas scores astonishingly badly.   I first saw the results months ago when I was asked for comments on the draft report, but even with that memory in mind, rereading the Reserve Bank results (from p 60) over the weekend made pretty shocking reading.

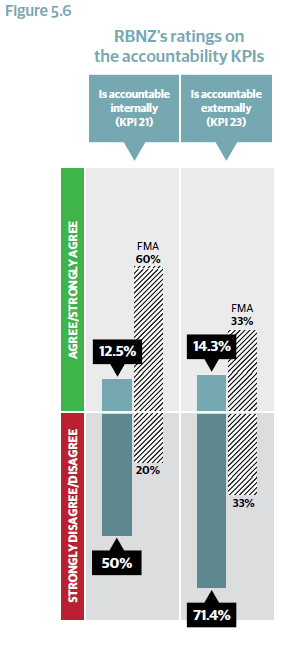
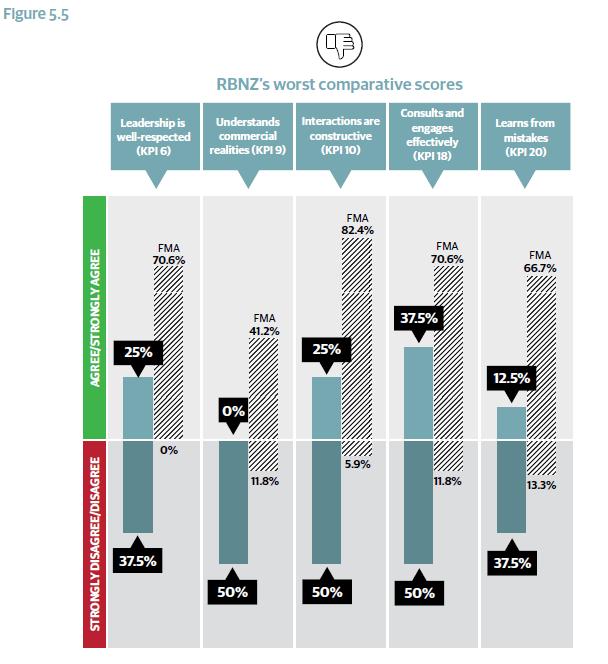
Here is one chart from the report, comparing Reserve Bank and FMA results for the KPIs where the Reserve Bank scores worst.

partridge 1

In summary

In the ratings, the RBNZ’s overall performance across the 23 KPIs was poor. On average, just 28.6% of respondents ‘agreed’ or ‘strongly agreed’ that the RBNZ met the KPIs and 36% ‘disagreed’ or ‘strongly disagreed’. These figures compare very unfavourably with the FMA’s average scores of 60.8% and 10.3%, respectively.  They also compare unfavourably (though less so) with the Commerce Commission’s averages of 39.9% and 25.8%, respectively.

There simply isn’t much positive to say.

One of my consistent themes has been the lack of accountability of the Reserve Bank, across all its functions.  The regulated entities seem to share those concerns.

partridge 2

As part of the survey, interviews were also conducted to fill out the picture the data themselves provided.

Like the survey results, the views of interviewees were also largely [although not exclusively] negative.

The criticisms related both to the RBNZ’s capabilities and processes, and the substance of its regulatory decision-making.
In relation to process and capability, criticisms included the following issues:
a. Lack of consistency in process: One respondent noted that the internal processes of the RBNZ’s prudential supervision department, which is responsible for prudential supervision, can be ‘random’. The respondent referred to long delays between steps in a process involving regulated entities, followed by the imposition of requirements for more-or-less immediate action from them.
b. Lack of relevant financial markets expertise among staff: This was a common
theme. One respondent noted that until the 2000s, there was “regular interchange
of staff between the banks and RBNZ,” meaning RBNZ regulatory staff had firsthand finance industry expertise. But this has changed with the banks moving their head offices to Auckland and the RBNZ based in Wellington. As one respondent said, “They will always struggle to get good people [with financial markets expertise] in Wellington, especially with the banks now in Auckland… this makes interchange impossible.” Another said, “RBNZ [staff are] completely divorced from the reality of how things are done.”  More colourfully, another said, “[RBNZ] is all a little archaic… Entrenched people don’t get challenged.” Another said, “On the insurance side, the level of capability is less than with the banks. There is a potential risk to policyholder protection. RBNZ ends up just focussing on the minutiae.”
c. Lack of commerciality: This concern is allied to both the expertise issue noted above, and the materiality issue noted below. As one respondent said about the RBNZ’s ‘deafness’ to the need for a materiality threshold before a matter becomes a breach of a bank’s conditions of registration, “RBNZ says, ‘If it’s not material just disclose it’. But that’s a regulator way of thinking. They don’t understand the commercial, reputational implications.”
d. Unwillingness to consult or engage: As one respondent said, “I would call them out for not truly consulting.” Another said, “The RBNZ upholds independence to the point that it precludes constructive dialogue.” Several respondents drew a contrast with the FMA, noting that the RBNZ was happy to issue hundreds of pages of “prescriptive, black letter requirements,” but “without much or any guidance” for the banks on their application. One respondent did note, however, that the RBNZ “isn’t resourced to spend time doing this [issuing guidance].”
e. Lack of internal accountability: Several respondents perceived a lack of oversight from the most immediate past Governor, Alan Bollard, in either engaging with the banks over concerns about prudential regulation or trying to resolve them. One respondent noted, “Staff are often running around doing things without serious scrutiny from above.” Another said there is a group “with no accountability within the RBNZ… They favour form over substance and seem to enjoy exercising power.” Another commented it was “unclear how much information flowed up to the RBNZ Board,” but that if the Governor were accountable to the board for prudential regulation, then the board “could be useful in pulling up entrenched behaviour.” Another noted that the RBNZ’s  governance structure meant it did not benefit from outside perspectives: “[t]he value of diverse thinking is to challenge, so you don’t get capture by one person’s view.”

Two main criticisms were made in relation to substance:
a. Materiality thresholds: Several respondents highlighted the lack of a ‘materiality
threshold’ before RBNZ approval is needed either for:
• changes to banks’ internal risk models in the Conditions for Registration of
banks; or
• changes to functions outsourced to related parties.
One respondent noted that without a materiality threshold, the new requirement
for a compendium of outsourced functions – and for approval of any change to
outsourcing arrangements with a related entity – could lead the Australian-owned
banks to cease outsourcing functions to related entities, thereby increasing costs and
harming customers.  Several respondents noted that the lack of a materiality threshold could be attributed to a lack of trust in the banks by the RBNZ staff responsible for prudential regulatory decisions. As one respondent put it, this led the RBNZ to “insist on approving absolutely everything.”

Although this view was not shared by all banks, one respondent noted that even
APRA – long regarded as a more heavyhanded, intrusive regulator than the RBNZ
– was “now more reasonable to deal with than the RBNZ.”

b. Black letter approach: Along with the lack of a materiality threshold in the RBNZ’s
regulatory regime, several respondents commented on the RBNZ’s “black letter”
approach to interpreting its rules: “If RBNZ had two or three public policy experts
who could bring a ‘purposive approach’ to interpretation, that would be hugely positive.”   Another said, “[The RBNZ] has an overly legalistic approach which ignores the purpose of the legislation,” and that “what they’re doing undermines [public] confidence over things that are of no risk.” Several survey recipients noted that this was in stark contrast to APRA’s approach to public disclosure in Australia.

Another respondent put the concern differently, saying the problem was less
about the RBNZ’s ‘black letter’ approach to its rules, and the opaqueness of the rules,
and more about the lack of guidelines from the RBNZ explaining them, an issue the
respondent put down to a lack of resources.

There is more detail there than most readers will be interested in. I include it because the overall effect builds from the relentness of the critical comment.   I’m not even sure I agree with everything in those comments –  but they are clearly perspectives held by regulated entities –  and I suspect that reference to Alan Bollard is really intended to refer to Graeme Wheeler.  But taken as a whole, it is an astonishingly critical set of comments and survey results, that most reflect very poorly on:

  • former Governor, Graeme Wheeler,
  • former Head of Financial Stability (and Deputy Governor and “acting Governor” Grant Spencer),
  • longserving head of prudential supervision, Toby Fiennes
  • the Reserve Bank’s Board, including particularly the past and present chairs, Rod Carr (who had had a commercial and banking background) and Neil Quigley.

And given the enthusiasm of the Bank to emphasis the role of the Governing Committee in recent years, it probably isn’t a great look for the new Head of Financial Stability, and Deputy Governor, Geoff Bascand – he of no banking/markets experience, no commercial perspective, and little regulatory experience – who sat with Wheeler and Spencer on the Governing Committee over the previous four years.

One would hope that the new Governor, the new Minister, and the Treasury and the Board, are taking these results very seriously, and using them to, inter alia inform the shaping of Stage 2 of the review of the Reserve Bank Act.  I’ve not heard any journalist report that they’ve approached the Reserve Bank  –  or the Board or the Minister – for comment on the report and the Bank-specific results.   But such questions need to be asked, and if the Bank simply refuses to respond or engage that in itself would be (sadly)telling.

In the report the New Zealand Initiative authors make much of comparisons with the FMA.  In respect of the survey results, that seems largely fair.  The data are as they are.  But as I’ve noted in commenting a while ago on an op-ed Roger Partridge did foreshadowing this report, I’m not entirely convinced (nor am I fully convinced about the criticisms of the FMA’s predecessor the Securities Commission, which was asked to do a different job).

Partridge cites the Financial Markets Authority as a better model.  In many respects, the FMA is structured like a corporate: the Minister appoints (and can dismiss) part-time Board members, and the Board hires a chief executive.  But it is worth remembering that the FMA has quite limited policymaking powers: most policy is made by the Minister, whose primary advisers on those matters are MBIE.   The FMA is largely an implementation and enforcement agency.  That is a quite different assignment of powers than currently exists for the Reserve Bank’s regulatory functions (especially around banks).  Also unaddressed are the potentially serious conflict of interest issues around the FMA Board, in its decisionmaking role. More than half the Board members appear to be actively involved in financial markets type activities (directly or as advisers), and even if (as I’m sure happens) individuals recuse themselves from individual cases in which they may have direct associations) it is, nonetheless, a governance body made up largely of those with direct interests that won’t necessarily always align well with the public interest.

Reasonable people can reach different views on the performance of the FMA. I gather many people are currently quite pleased with it, although my own limited exposure –  as a superannuation fund trustee dealing with some egregious historical abuses of power and breaches of trust deeds – leaves me underwhelmed.  It is certainly a model that should be looked at in reforming Reserve Bank governance –  it is, after all, the other key financial system regulator –  but I’m less sure that it is a readily workable model for the prudential functions, even with big changes in the overall structure of the Reserve Bank, and some reassignment of powers.  It certainly couldn’t operate well if both monetary policy and the regulatory functions are left in the same institution.  It doesn’t seem to be a model followed in any other country.  And it isn’t necessary to deal with the core problem in the current system: too much power is concentrated in a single person’s hands.  In a standalone regulatory agency, I suspect an executive board –  akin to the APRA model –  is likely to be an (inevitably imperfect) better model.

Whatever the precise model chosen, significant reform is needed at the Reserve Bank.  Some of that is about organisational structure and governance –  I’ve made the case for a standalone new Prudential Regulatory Agency –  but much of it is about organisational culture, and that sort of change is harder to achieve.  I hope Adrian Orr has the mandate, and the desire, to bring about such change.  I hope Grant Robertson insists on it.

Readers will that early last year, Steven Joyce – as Minister of Finance –  had Treasury employ a consultant to review aspects of the governance of the Reserve Bank, particularly around monetary policy.  Extracting details of the review, undertaken by Iain Rennie, from The Treasury proved very difficult.  It took almost a year for the report to be released.  I’ve had various Official Information Act requests in, including for the file notes taken from the (rather limited) group of people outside The Treasury that Iain Rennie engaged with (within New Zealand it turns out that he talked to no one outside the public sector).  That one ended up with the Ombudsman.  A week or so ago I finally got an offer via the Ombudsman’s office –  Treasury would release a document summarising those meetings if I discontinued my request for the full file notes.  Somewhat reluctantly –  balancing the point of principle, against getting something now – I agreed, and last Friday Treasury released that summary to me.  For anyone interested it is here.

Rennie review Summary of discussions with External Stakeholders

There is some interesting material there, including on meetings with the Reserve Bank Board –  where he showed no sign of having grilled the Board on what it accomplishes or adds –  and with some overseas people Rennie talked to.  But what caught my eye was the record of a meeting Rennie (and Treasury) held with the Reserve Bank management (Wheeler, Spencer, McDermott and a couple of others) on 14 March last year.  At the meeting, the Bank seems to have set out to minimise any change and sell Rennie on the virtues of the current informal advisory Governing Committee.

Here are relevant bits of the record (as summarised now by Treasury)

Current Governing Committee (GC)
o The GC reflects public sector reforms, there are checks and balances, which help with accountability.
o It has become important to focus more on the Reserve Bank as an institution, rather than just on the Governor, as the Reserve Bank has taken on more and more responsibilities over time.
o Discussed different overseas models, including strengths and weaknesses of different approaches.
o The approach to decision-making and communications needed to be consistent with the Reserve Bank’s approach (e.g. must be appropriate in the context of forward guidance).

Codification of the Committee Structure
o Codification’s advantage was that it could prevent a future Governor from moving back to a single decision-maker. However, that hasn’t been a problem in Canada, and it would be difficult for a Governor to roll the current committee approach back.

Effectiveness
o The cohesion of the GC and the cooperative nature were identified as the most important factors in its success. The GC was relatively informal with collective responsibility, and that worked well.
o Discussed how the current committee operated, and some strengths and weaknesses of the approach.
o Discussed the effectiveness of different options for decision-making and communications design, such as voting and minutes (neither supported).

Some of this is almost laughable, a try-on that surely they should not have expected anyone to take very seriously (and, to Rennie’s credit, he came out with recommendations that went far further than the Bank liked, earning him soe quite critical comment from the Bank).

Take that very first bullet, the claim that the Governing Committee model “reflects public sector reforms”.  I’m not sure how.  It has no basis in statute, the members are all appointed by and accountable to the Governor, and there is no transparency, and no accountability.  The Bank has, for example, consistently refused to release any minutes of the Governing Committee –  on any topic –  if indeed, substantive minutes are even kept.

Or the fourth bullet, the suggestion that “the approach to decision-making and communications needed to be consistent with the Reserve Bank’s approach”, which is a typical bureaucrat’s attempt to reverse the proper order of things.  The Reserve Bank is a powerful public agency, created by Parliament and publically accountable (well, in principle).  The design of the governance and accountability arrangements should reflect the interests and imperatives of the principal (public and Parliament), not those of the agent (the Bank itself).  Officials work within the constraints Parliament establishes.

Or the third to last bullet, about the cohesion of the Governing Committee, collective responsibility etc.  Again, I’m sure they believed it, but on the one hand, we build public institutions to provide resilience in bad times (or bad people) not so much for good times, and on the other there is no collective responsibility –  the Governor alone has legal responsibility, and there is no documentation at all on the Governing Committee processes.  And legislating to entrench a committee in which the Governor appoints all the members, might be a recipe for cohesion, but it is also a high risk of a lack of challenge, debate and serious scrutiny.

And, finally, just to confirm that consistent opposition to anything approaching serious scrutiny, in that final bullet, the Bank reaffirms its opposition to published minutes –  something most of central banks now manage to live with, in some cases with considerable detail.

At one level, these comments no longer matter much.  Graeme Wheeler and Grant Spencer have moved on, and the new government has made decisisions on the future governance of monetary policy.  But they nonetheless highlight the sort of closed culture fostered at the Reserve Bank over the past decade or more, whether on the monetary policy side or on the regulatory side (the latter vividly illustrated in the NZI report).  Comprehensive reform is overdue.  It would make for a better Reserve Bank internally – and/or a better Prudential Regulatory Agency –  and one more consistently open to scrutiny, challenge, and debate, which in turn will reinforce the impetus towards better policy, better analysis, and better communications.


Population size and GDP per capita: US states

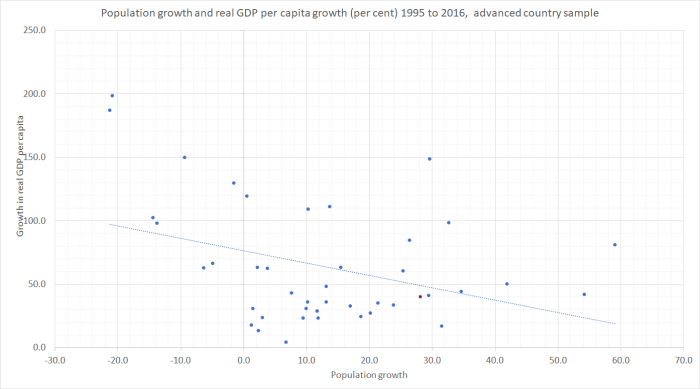
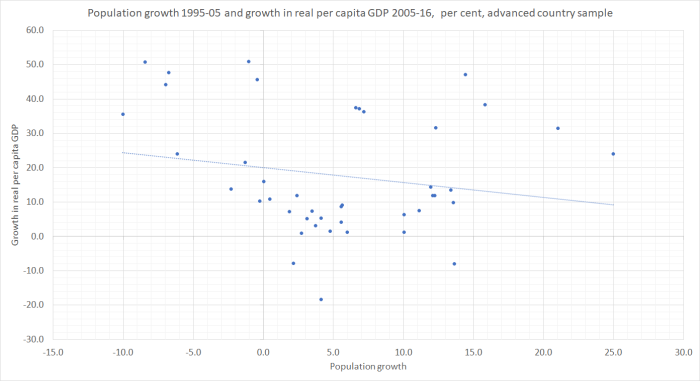
There have been a few posts here (here, here, and here) in the last week or so around the issue of population size and GDP per capita –  not because my prior is that there is any such relationship but (a) because I think there isn’t, and it is worth occasionally illustrating that across countries, and (b) because even some officials in the New Zealand government still appear to believe that our (small) size is a material element in the story of what holds New Zealand back.   There are arguments why, in theory, a larger population might result in better long-term economic performance (higher productivity), but whatever the merits of those arguments they seem to have been outweighed by other factors.  In the world we currently live in, the average big country is no more economically successful than the average small country, and that is so whether one throws all 190 countries into the mix at once, or looks only at advanced countries, only at European countries,  only at moderately-sized countries (eg excluding China and India) or whatever.  And one might imagine a plausible story in which economic success might have led to more population (migration or natural increase) rather than the other way round.

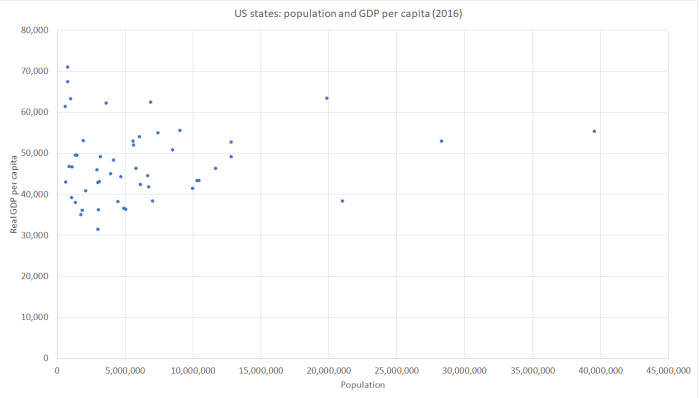
But what does the picture look like for US states?  Across all 50 states (one dot per state) here is the cross-sectional picture.

US states 2

And again, no obvious or statistically significant relationship.   In fact, to make the dots a bit easier to see, I left off the (non-state) District of Columbia which with about 600000 people has per capita GDP of about $160000.

The US case is interesting because –  unlike the situation with comparisons across individual countries –  there is no legal obstacle in the way of US citizens (and residents) moving within the country (across state lines) to pursue opportunities.   In that sense one might have (actually I initially did) expected to see more populous states also being more economically successful, if only because of internal migration.  But the relationship between population size and GDP per capita seems about as weak across US states as it does across countries.

I wouldn’t want to make anything much of these US state comparisons –  I just did them because the data were there, and having dug it out I thought I’d share it.  After all, in various places, big metropolitan areas straddle two or more states (New York is the best known example).   Then again, there is more policy similarity across US states than there is even across member states of the EU –  so a few more things are help constant when one looks at the simple scatter plot this time.

Whatever the theoretical arguments, a bit of history suggests we shouldn’t be surprised at the lack of any sustained relationship between population and economic performance.  After all, at its 14th century peak –  as probably the richest place in Europe – Florence is estimated to have had a population of fewer than 100000 people.


“12 Angry Men” and the Reserve Bank

It wasn’t me that introduced that wonderful 1957 movie to discussions about Reserve Bank governance, but them.  I’ll get back to that.

Yesterday the Bank released its first on-the-record speech of the Orr era, although it must surely have been largely written before the new Governor came on board.  Chief economist John McDermott and one of his staff had prepared a paper for a Reserve Bank of Australia conference.  The title of the paper was Inflation targeting in New Zealand: an experience in evolution.   

I’ve not typically been a fan of McDermott’s speeches (eg here) but this one reads quite well.  It is mostly a background account of how inflation targeting developed and evolved in New Zealand, culminating in some brief, and fairly innocuous, comments on  the pending changes to the Reserve Bank Act that the government has recently announced.  For anyone looking for background or longer-term context on New Zealand monetary policy in recent decades, I’d happily suggest it as a reference (in fact, I just did for one reader).

I don’t have much problem with the description of the history –  and they draw on an old article of mine on the origins of inflation targeting – and although I’d describe a few things differently I think it is mostly a fair account.  As ever, I think the Bank tends to caricature the early days of inflation targeting to some extent, suggesting that things were done fairly rigidly or mechanically when the truth is –  whatever some of the rhetoric at the time – quite the opposite.    Then again, as I reflected on the speech I realised that there is –  as far as I can work out –  no one now at the Reserve Bank who was involved at all in monetary policy for the first seven or eight years of inflation targeting.  I guess it is a quarter of a century ago now, but even so that took me a little by surprise.  The Governor, for example, first joined the Bank in mid-1997 just in time to share responsibility for one of the more embarrassing episodes of the last 30 years, the Monetary Conditions Index.  (I’ve been meaning to write up that episode, which seems to me not well-documented, and now that Orr is back at the Bank perhaps it is time to do so.)

As it happens, the Monetary Conditions Index –  when for a year or more we set things up in a way that foreseeably introduced extreme short-term volatility to interest rates –  remains the only mistake the Bank seems willing to concede over almost 30 years (“the MCI was a branch that we lopped off fairly quickly”).  Certainly nothing about the persistent failure, over seven years now, to have core inflation near the 2 per cent focal point of the inflation target –  or the attempt to aggressively tighten policy in the midst of that –  all while, on their own numbers, unemployment was above estimates of a NAIRU.

But the prompt for this post was mostly some comments McDermott made about the planned introduction of a statutory Monetary Policy Committee, finally moving away from the single decisionmaker model that has few/no parallels among other central banks and financial regulators, and none among other New Zealand public sector agencies.

This was the paragraph that caught my eye

Of course, the creation of a formal (or indeed informal) committee does not guarantee superior outcomes. How the MPC will operate in practice is also extremely important. Committees are more successful when they have processes in place that aim to minimise various human biases, such as the pressure to conform, confirmation bias, and a tendency to rely on the most recent events to a greater extent than is sometimes warranted.[24] The Bank will continue to ensure our internal processes aim to maximise the benefits that committees can provide.

The footnote 24 reads as follows

24  The movie 12 Angry Men (1957, MGM) provides an excellent demonstration of how ‘committees’ (a jury in this case) should not behave, for example publicly revealing individual priors at the start of the meeting.

Of course, I agree that simply creating a legislated committee does not guarantee superior outcomes.  Much of the time it shouldn’t make much difference at all to the setting of the OCR –  whether for good or ill (thus the former Governor wanted his internal committee enshrined in law, and since it was gung-ho for tightening in 2013/14 as advisers, it is hard to believe they’d have taken a different collective view as decisionmakers).  Committees are, in large part, about institutionalising resilience, to protect us to some extent against idiosyncratic or bad actors (in this case, a bad Governor –  but it generalises in that Prime Ministers govern in Cabinets, higher courts operate as benches of judges, and so on).   Layers of review –  eg appeal courts –  can perform much the same sort of function.  Committees can help instill confidence, perhaps especially when –  as with the higher courts –  all judges are free to record, and have published, their considered opinions.   In many of these areas –  probably including the setting of the OCR – there is no objectively right or wrong answer, only a final one (for now).

McDermott rightly notes that there can be problems that undermine the effective contribution of legislated committees.  He notes “the pressure to conform, confirmation bias, and a tendency to rely on the most recent events to a greater extent than is sometimes warranted”, but there are others, including the possibility of individual committee members free-riding.  But he makes no attempt to relate the structure of committee that the government has chosen –  which seem to largely mirror the Bank’s preferences –  to the sort of biases and risks he is concerned with.  How does the chosen structure allay those risks?

Thus, the government has chosen to adopt a model in which:

  • outsiders will always be numerically dominated by insiders,
  • the Governor –  an insider in these terms – chairs the committee and controls all the resourcing of, and paper flow to, the committee, and where
  • the Governor will have a big influence on all the appointments to the committee (several will be his own staff, appointed on his recommendation, and the others will be appointed by the Minister on the recommendation of the Bank’s Board –  but with the Bank’s Board historically having served mostly to assist the Governor).
  • and outsiders (and insiders for that matter) will be unable to articulate their individual views in public, and won’t be held individually accountable for those views (or for their contribution to the committee).

In the hands of an exceptional Governor –  one genuinely open to debate and challenge, through the worst of times –  none of that might matter.  But we don’t legislate on the presumption that men are angels.   For a typical Governor –  moderately competent, moderately defensive, moderately arrogant –  it is a recipe for something as close as possible to the status quo.   And, frankly, for typical other members: insiders won’t see much payoff in resisting a Governor with a strong view, collegiality among management will encourage caucusing and a fairly common insider view, and anyone willing to take appointment as an outside member might be readily content to settle for the prestige, and the inside view of the process, rather than supposing that they have much chance of making much difference.   There will be no cost to just going along, and in the papers the Minister raised the threat of being dismissed if an outside member does make life awkward for the Governor.

I don’t want to overstate things. But the chances of getting the real benefits of a committee on this particular topic (monetary policy) have been undermined by the choices the government has made and the Bank appears to have supported.  Bureaucratic interest appears to have trumped the public interest.

And that footnote concerned me on a number of counts.  It obviously wasn’t just a throwaway line –  having been deliberately included as a footnote in a published text, which will have gone through numerous drafts.   It is an odd example to use in many ways. For example, a jury is a one-shot game (jurors typically don’t know each other previously, they decide one case, and then may never see each other –  let alone meet for another deliberation –  again).  Monetary policy decisions, by contrast, are a repeat game: the OCR is reviewed every six weeks or so, and the same individual or group of people make the decision for years at a time.  They bring their priors, their experiences, their past mistakes to the table, and are encouraged to do so.   It is also deliberating on issues where everyone –  inside the committee and outside –  has access to the same information, and no information is inadmissible. (And where the financial markets are trading that information continuously.)

McDermott seems to take as the lesson of 12 Angry Men that members of a committee should not outline their individual initial views at the beginning of the meeting.  Perhaps that is arguable (in principle), but in the case of the jury in question the “meeting” began only after all twelve jurors had been exposed to all the evidence in court –  defence and prosecution.  In that sense, the start of the jury deliberations in the movie reminded me quite a bit of OCR Advisory Group meetings I sat on for years:  we’d have spent several days listening to presentations, asking questions, listening to the questions of others, and then the small group would retire.  And often the Governor would go round the table and invite each member in turn to outline their view.  When we wrote our formal advice to the Governor, we were all supposed to do so independently –  and not read anyone else’s until we’d sent off our own.  And when the group reconvened there was never an opportunity to seriously debate the issues, or challenge the arguments that (say) an 11:1 majority of the Governor’s advisers were using.  In some ways, it felt a lot like 12 Angry Men, except without the heroic denouement in which truth was outed, and the majority converted.

The parallels are weaker than they might look.  For a start, no one’s life is on the line (as in the movie).  Perhaps more importantly, an OCR decision made today can be, and is, revisited 6-8 weeks hence.  And if all the members aren’t necessarily expert they at least have some ongoing familiarity with the subject matter, and exposure to the views of equally capable people outside the institution, in real-time.

But the challenge remains for the Bank (and the government).  How does it propose that the new committee will overcome the tendency for the Governor’s preference –  backed by resourcing, control of pay etc for internal members, an inbuilt majority, and an appointment procedure that will encourage the appointment only of house-trained outsiders –  to go on dominating, whether the Governor’s view (or the collective inside view) is right or not.  Sometimes it will be right, but those arguments should prevail on their merits, not on institutional biases that strengthen the hand of one dominant individual and his clique, and make unlikely the prospect that a single outsider will ever be able to make the sort of difference the (heroic) 12th juror in the movie made. Of course, it is only a movie…..then again, it was the Bank that introduced the reference, not me.

Far better to institutionalise a system more explicitly designed to air, test, and challenge the full range of views:

  • all members appointed directly by the Minister of Finance,
  • a majority of the members being non-executive outsiders,
  • those outsiders having access to (a limited amount of) resources to do/commission their own analysis research,
  • individual OCR votes being recorded, and published, by name,
  • full minutes –  with views attributed on a named basis –  be kept and published (paralleling the Swedish system, and –  in a slight different way –  the way the higher courts work),
  • individual members being free to engage externally (including making speeches) articulating openly their views and questions.

In the nature of the monetary policy issues –  repeat game, same information base open to everyone, huge uncertainty –  it seems like a model better designed to get the most from a committee system, and to be consistent with commitments –  from the government –  to more open government.  Of course, the Bank –  at least under the previous management –  never really wanted more than an fig-leaf committte. Any analysis of bureaucratic incentives means that shouldn’t be a surprise.  From McDermott’s comments yesterday, it isn’t clear that anything has yet changed.  But the bureaucrats –  with interests to protect –  shouldn’t be the ones driving the reforms.

Bus drivers and Essential Skills visas revisited

Last week I wrote a bit about bus drivers.  Not a usual topic here, but there were media stories about Ritchies in Auckland apparently being unable to recruit New Zealanders (or foreigners with existing work rights) to staff the new bus routes they’d won through the Auckland Transport tender programme.  My suggestion was that the company had probably deliberately bid at a price at which it could make money only if it could use government immigration policy to hire migrant labour.

In a typical market, there aren’t sustained physical shortages –  the price adjusts.  If in this case the price (driver wages) wasn’t adjusting –  if anything there was a suggestion Ritchies would be paying less than the previous operator –  it suggested the plan was to close the gaps another way (bringing in more relatively unskilled people from abroad.)    Ritchies has moral agency in that –  they made a choice to bid that way, and should live with the consequences if it doesn’t work (if, for some reason, MBIE turns down their application to bring in relatively unskilled workers from abroad).   But I didn’t want to focus on the individual company, since they are responding to incentives set up by various arms of government –  Auckland Transport offering the contracts, and even more so MBIE (as part of the New Zealand government) in making immigrant labour relatively readily available for what are really quite unskilled roles.    And it isn’t as if Ritchies is the only company operating this way.   Another operator has won most of the bus routes in Wellington, to take over in July, apparently operating on very similar assumptions about access to new immigrant labour.

(Just to clarify one thing.  My view is that managerial changes, or new technologies, that improve efficiency and/or lower the demand for labour in a a particular firm or industry are generally a good thing.   They aren’t always easy for the people concerned, but over time productivity –  the essence of higher living standards –  involves getting more output from the same inputs or (in many individual firms, industries) getting the same output with fewer inputs.   There are many fewer telephone operators or night soil collectors, and that is unquestionably a good thing.  Productivity gains make possible new firms, and new industries, and overall employment rates remain high.  Real wages, across the economy are far higher than they were a century ago –  and that too is a good thing.  It is a desirable outcome of economic progress.   If there were serious inefficiencies in the bus industry, I’d not be concerned out at all about those being rooted out.  But that doesn’t seem to be the issue here.)

In addition to the various visible comments on the post, I had some comments directly from people involved in the industry, on both sides.  In substance they were making quite similar points.  As one observed, demand growth (in this case for bus drivers) can always be met by expanded capacity (immigration) or higher prices (or wages).  They went on to argue that the ability of some companies to import drivers meant they won contracts, and that it was as clear a case of immigration driving down wages as you could find.

Of suburban driver jobs, I observed last week

It is a responsible role, but not one requiring huge amounts of skills or training (according to the story I linked to above 6 to 8 weeks training suffices).    It isn’t the sort of role one naturally thinks of when officials and ministers talk about skills-focused immigration programmes.

One driver confirmed that training story noting that his employer

…took me on with just a car licence. They spent about 8 weeks training me up and paid for the costs of getting a heavy traffic licence and a P endorsement (essentially a “fit and proper” test.)

In terms of (price-based) evidence of labour market pressures, this driver observed that over five years or so his basic hourly rate has increased by only around 1 per cent per annum (if so, that would be less than the average rate of CPI inflation, so a reduction in real wage rates).

There seem to be a variety of ways to spin the story as to how much bus drivers are being paid, and what the new entrants (Auckland and Wellington) are offering or planning to offer.   On old contracts there are basic hourly rates (pretty modest –  in fact about (in real terms) what the government wants the minimum wage to be a couple of years from now), but there are also shift allowances and penal rates for weekend work.  Relative to what the new operators are proposing/offering, there also appear to be differences on rules around split shifts (maximum number per day) and whether drivers get paid for the time positioning buses (to the start of a run or back to depot).    There doesn’t really seen to be much dispute that the new operators –  claiming an inability to find sufficient local labour –  are not offering drivers more than the current operators.  Indeed, the general sense seems to be that pay for equivalent effort would be less than at present.

And in a typical, well-functioning, market, when demand exceeds supply –  and not just for a day or two  –  the price of the product or service in question will rise (not fall).   Quite how much the rise will be will depend on the elasticities of supply and demand –  maybe a lot more potential drivers would emerge for slightly higher wages (or maybe not), and maybe bus patronage would drop away sharply with slightly higher fares (wages are by far the largest component in bus company costs) or maybe not.  But you wouldn’t expect to see the relevant price –  bus driver wages –  under downward pressure when there is incipient excess demand for drivers.

(It is not as if the outgoing operators have had abundant labour.  As one correspondent noted “Go wellington have about 340 drivers for the current contract but even with huge active recruitment and training from scratch they only get 100 new per annum which is as many as they lose”.)

In fact, the way the bus driver labour market exists seems to be possible only because our governments –  present and past –  have opened up a channel through which supply can be increased, at or below the current price.  Open up incipient excess demand at current –  or lower –  than prevailing wages, and then get in workers on a (so-called) Essential Skills visa.

Bus drivers aren’t an occupation that appears on the official “skill shortage list” (if they were there would no further labour market test involved for any firm wanting to hire foreign labour).  Occupations such as bricklayers, plasterers, bakers, and jockeys are on the list.   But not being on the list doesn’t mean bus companies can’t hire foreign drivers.  There are just more hoops to jump through –  which is why employers who think they might have multiple vacancies (like the bus companies) are strongly urged (by MBIE) to seek an “approval in principle”.

MBIE’s employer guide is here.   You’ll see that for unskilled or modestly skilled jobs, part of the required test is to check with WINZ as to whether there are New Zealanders seeking work they can refer to the employer.   Bus drivers are in that category.

Here is the Work and Income process, as MBIE describes it

You can contact Work and Income at the same time (or before) you advertise the vacancy. Once the vacancy is submitted to Work and Income it will be listed immediately. Work and Income will search its database for suitable clients, and suitable candidates will be referred to you for consideration. Candidates referred can either have the required skills, or be readily trained to do the work on offer. If you don’t believe the candidates referred are suitable, you should discuss the results with Work and Income.

If you want to support a work visa application, you should request a Skills Match Report. Work and Income will gather information about unsuccessful candidates and complete a Skills Match Report. Work and Income will provide the Skills Match Report to you and Immigration New Zealand within five working days of the date they close the vacancy.

Which sounds reasonable enough, if rather bureaucratic.   But given the huge increase in the number of people here on temporary work visas over recent years –  even as the unemployment rate has been at or above typical NAIRU estimates – it doesn’t seem to have been much of an obstacle to enabling firms to bring in workers to fill roles that aren’t particularly highly-skilled.  It isn’t clear that bus drivers roles will be any different (certainly there has been no change in government policy signalled since the change of government.)

Then you have to advertise the roles (which, I gather, the bus companies have already done).  There are various restrictions –  you can’t expect, for example, to get a work visa approval if you only advertise in Samoan (say) or in media that only foreigners are likely to read.  In the official guide to employers, wage or salary rates don’t seem to be part of the relevant test at all, although if you dig far enough there is an operations manual in which it states

For the purposes of these instructions an employer is not considered to have made genuine attempts to recruit suitable New Zealand citizens or residence class visa holders if:

  • the employer has advertised the work in such a way that no New Zealand citizen or residence class visa holder will or is likely to apply e.g. making foreign language skills a requirement when it is not necessary for the performance of the work; or
  • an employer has advertised the work at terms and conditions that are less than terms and conditions New Zealand citizens or residence class visa holders typically receive for equivalent work.

That looks mildly encouraging.  You can’t just offer the minimum wage (for a job in New Zealand typically paying $5 an hour more than that) and expect to get your approval in principle to bring in foreign workers.   But if your wage contract is a little different from other operators (perhaps base rates are a bit higher, but other payments are lower?)  or even if you can find one other company somewhere in the country paying the same overall rate, you have to wonder (based on total numbers approved if nothing else) how rigorous MBIE is in enforcing the test.  And why, for example, it isn’t given more prominence in their guide to employers?

Because, you see, MBIE is really keen that firms hire foreigners.    In fact, they have whole website pages devoting to extolling the virtues of immigrant labour –  so much so that one has to wonder whether they really see themselves working in the interests of New Zealand citizens.    Employers are told

“Hiring migrants is a great way for you to maintain and grow your business”

And then the first item under that “Why hire migrants?” employers are told

Migrant workers can do more than just fill a gap in your staffing. They bring with them an international perspective and connections, provide support to up-skill local employees, add diversity, and generally can help businesses to stay ahead of their competition.

The “international perspective and connections” being oh so important for bus drivers, bricklayers, or even the cafe or retail managers or aged care nurses (occupations topping the work visa approval list).    There is no hint for example that there might be any disadvantages –  eg lower returns to New Zealanders in similar occupations, or the simple fact that, in aggregate, migrants add more to demand pressures (including for labour) than they do to supply in the short-term.

If we are going to have government officials administering something like a mass market Essential Skills visa scheme, and deciding who does and doesn’t get approval, surely a key aspect of any labour market test should be something along these lines?

“has the effective wage or salary rate for this occupation risen materially faster than wages and salaries more generally in New Zealand over the past couple of years?”

If not, how can you seriously use the term “skill shortage”?    Even if wages in a particular occupation have risen faster than the norm, it takes time for locals to respond and shift occupations, so one wouldn’t necessarily want to jump at the first sign of a bit of real wage inflation in a particular occupation, but if after a couple of years the pressures were persistent then some sort of Approval in Principle for temporary migrant labour –  at wages at or above those now prevailing in the domestic market – might make some sense as a shock absorber.  But MBIE seems perennially averse to markets adjusting in ways the generate higher real wages, even though that outcome is one core part of what we look for from a successful economy.  Successive Ministers of Immigration –  from both main parties –  seem to buy in to the story, and believe that central planning by them and MBIE bureaucrats is going to work better than the price system.  It wasn’t a good system in the Soviet Union, and it isn’t here.

I can’t see a reason why we should be giving Essential Skills visas for suburban bus drivers, and we shouldn’t be creating a system where firms are encouraged to bid in the expectation that they can use that system, rather than pay a market-clearing wage for New Zealand resident workers.

More generally, I don’t think there is particular merit in a system in which officials are picking and choosing which firms can and can’t hire short-term workers.   As I noted in my previous post I favour something along these lines

To that end, I’ve argued previously for a system in which Essential Skills visas are granted on these terms:

a. Capped in length of time (a single maximum term of three years, with at least a year overseas before any return on a subsequent work visa, with this provision to apply regardless of skill level).

b. Subject to a fee, of perhaps $20000 per annum.

If an employer really can’t find a local hire for a modestly-skilled (or unskilled) position, they’d be able to get someone from overseas, but only by paying (to the Crown) a minimum annual fee of $20000.  It is pretty powerful incentive then to train someone local, or increase the salary on offer to attract someone local who can already do the job. If you can’t get a local to do a job for $40000 per annum, there might well be plenty of people to do it for $50000 (and still cheaper than paying the ongoing annual fee for a work visa employee).

There are lots of operational details that would need to be refined, but as a starting point it seems like a pretty attractive system.  In the current situation, if bus companies really can’t find New Zealanders to drive, they could hire foreigners, but would have to pay an additional annual fee to the Crown of $20000 for each approval (but also wouldn’t otherwise have to jump through bureaucratic hoops, legal fees etc).  I’d be really surprised if there were any bus drivers then on Essential Skills visas or –  reprising the list from my previous post – kitchenhands, waiters, or massage therapists.  But, you never know.   If the market price adjusted that much that it was still better to hire a foreigner, that price adjustment might be a pretty compelling argument for a rather more genuine “skill shortage” than what we have now.

Perhaps in the end, MBIE won’t allow the bus companies to hire immigrant labour to fill the vacancies.  I’d welcome that, but the bigger issue isn’t any particular role, but how the system as a whole is designed and operated.

(And, to be clear, the overall wage effects of high immigration are ambiguous, in part because in aggregate immigration boosts demand more than supply in the short run, and there are repeated waves of migrants, and thus repeated short-runs.  I am not one of those arguing that immigration policy is driving wages systematically down.  This post is about the impact in specific localised markets, and even more about the rules regarding labour market tests.)

Hiring migrants is a great way for you to maintain and grow your business

Hiring migrants is a great way for you to maintain and grow your business

Hiring migrants is a great way for you to maintain and grow your business

A visiting Australian politician

A fairly prominent Australian politician was in town last week.   Andrew Leigh was previously a professor of economics at ANU, and for the last eight years has been a Federal Labor MP.  He is the Shadow Assistant Treasurer, Shadow Minister for Competition and Productivity (and spokesman on various other minor portfolios), and so presumably fairly likely to become a Federal government minister if the next election result follows the polls and Labor is elected.

Leigh was here to give a couple of lectures in the series being sponsored by the NGO Presbyterian Support Northern on topics related to child poverty and wellbeing.  As it happens, next month I’m also giving one of the lectures in this series –  on the role productivity growth plays in ending poverty – and if anyone is interested you can book  one of the (free) sessions here   (there is one in Auckland and one in Wellington).

I didn’t get to hear Andrew Leigh while he was here, but both his Auckland text  and his Wellington text are available on line.   The substance of both addresses is well worth reading –  he is a widely-published researcher on inequality (the Auckland address) and has just published a book about the use of randomised control trials as a tool in better evaluating which policy interventions might work and which don’t (the focus of the Wellington address).   I don’t claim to be a fan of the Australian Labor Party, but politics is likely to be better for having at least a few people, preferably on both sides of politics, able to address serious issues this seriously.

Having said that, I was mildly amused by the introduction to his Wellington speech.   I guess it is standard advice to butter up, and flatter just a bit, your audience.

New Zealand has turned out to be a pretty good predictor of what’s likely to happen next in Australia.

New Zealand women won the right to vote nine years earlier than Australian women.

Your country enacted same sex marriage four years before we did.

You even gave Barnaby Joyce citizenship before we did.

So to be in New Zealand isn’t just a chance to see the sun rise a couple of hours earlier – it’s also an opportunity to get a sneak peak into some of the things that might shape Australia’s future.

And I have to say that as a member of the Labor opposition in Australia, I’m keenly hoping that this year or next will see Australia’s voters follow your lead in electing a progressive government.

I’m pretty sure that, even if it got a good laugh, he is wrong about Barnaby Joyce –  a citizen by birth of both countries, and there was only a single birth.

But no mention at all –  none, as far as I could see across two speeches –  of the most striking area of New Zealand/Australia comparisons where Leigh must surely hope that New Zealand doesn’t offer a “sneak peak” into Australia’s future.  And that is the, not trivial, matter of relative productivity and prosperity.

As I noted yesterday, for 100 years or so (from the time of our gold rushes onward) New Zealand and Australia are estimated to have had average real per capita incomes that were much the same.   Each country had specific idiosyncratic events and influences, so that at times we did better, and then for a time they did better.  Those differences were reflected in the trans-Tasman migration data –  at times the (significant) net flow was one way, and at times the other way.

The standard collection of such data is that by former OECD researcher Angus Maddison  Here is the chart of the data he judged best (no doubt far from ideal in both cases), starting from 1870 when he first reports annual numbers for New Zealand.  (Maddison died a few years ago so the data aren’t updated to the present.)

aus vs nz real gdp pc

The red line is the average of the series for the full period 1870 to 1970: on average, on these measures, New Zealand had very very slightly higher average incomes than Australia.  On different measures you might get a slightly different picture, but the overall story won’t change much.  The performance of our two economies was pretty similar.  But it is no longer.   The IMF’s current estimate is that New Zealand real GDP per capita, converted at purchasing power parity exchange rates, is about 76 per cent of that of Australia.

We don’t have a time series of productivity data for the historical period, and although Australia has an official series of real GDP per hour worked back to 1959, here official data can only take us back to the late 1980s.    In this chart, I’ve shown the relative performance of labour productivity (real GDP per hour worked) in the two countries since 1989 (for New Zealand, using the average of production and expenditure GDP measures, and the average of the QES and HLFS hours series, as in earlier posts).

real GDp per hour aus vs nz

In 29 years, we’ve lost a lot more ground –  15 percentage points-  relative to Australia.  It isn’t a particularly steady process (at least as represented in these data) but the trend decline shows no sign of ending, let alone reversing.

And thus when, as in one of his speeches, Andrew Leigh notes that

It is not as though the child poverty rate is noticeably different in our two countries. According to the OECD, the child poverty rate – measured as the share of children living in households with disposable incomes of less than half the median – is 13 percent in Australia and 14 percent in New Zealand.

what he is omitting is that incomes in Australia are a lot higher, and thus so too is the relative poverty line measure he is using.  Australia’s poor should be less badly off than our poor, because Australia’s relative economic performance is so much better.

For Australia’s sake, I hope New Zealand’s path doesn’t foreshadow their own.  Then again, in some respects it already has.    On the Maddison numbers, back in 1870 both New Zealand and Australia were more prosperous than the United States.  As recently as 1938, we were about equal with the US.  And now, we do particularly poorly, but Australia’s relative performance is nothing to write home about.

rel to US

Interestingly, Leigh touches on one possible aspect of the story.

Third is to recognise the role that foreign investment plays in sustaining employment. As you know, the antipodes enjoyed among the highest wages in the world at the end of the nineteenth century. One reason for this was the high amount of land per person. While Europeans lived cheek-by-jowl, there was plenty of room to swing a sheep in Australia and New Zealand. In economic terms, one reason that wages were high was that the capital to labour ratio was high.

Today, both Australia and New Zealand have strong immigration programs. Migrants can fill skill gaps and start businesses, boost innovation and encourage exports. But they also have the inevitable impact of lowering the capital to labour ratio. To the extent that migrants are adding to the number of workers available to do a given job, this may put downward pressure on wages.

It was former Treasury Secretary Ken Henry who pointed out to me that foreign investment has the opposite effect. By increasing the available capital, it pushes up the capital to labour ratio. So by accepting foreign investment as well as migrants, a country can keep its capital to labour ratio constant, and therefore its wage rates.

I think that is partly true and partly not.  As he notes, in the 19th century what marked out both countries was abundant land – which in turn attracted both migrants and foreign investment.  These days, foreign direct investment can help improve prospects –  and I’m strongly supportive of us being open to FDI –  but FDI doesn’t add to the stock of land and natural resources (even if it can help exploit those resources more fully), and even when regulatory restrictions are out of the way, it flows in the direction of opportunity.  Neither country has been particularly successful in seeing internationally competitive industries not based on our natural resources develop.  Attractive opportunities in either location don’t seem thick on the ground,

It is, nonetheless, good to see a left-wing politician openly addressing these issues.  Would that it were happening here.

Leigh’s other speech was devoted to the merits of randomised trials of proposed or actual policy interventions or welfare programmes.  In many areas, they are the single best way of identifying what works and what doesn’t.  Here are a couple of examples from his text (in this case, of programmes that proved not to work).

In some cases, the Education Endowment Foundation trialled programs that sounded promising, but failed to deliver. The Chatterbooks program was created for chil­dren who were falling behind in English. Hosted by libraries on a Saturday morning and led by trained reading instructors the program gave primary school students a chance to read and discuss a new chil­dren’s book. Chatterbooks is the kind of program that warms the cockles of your heart. Alas, a randomised trial found that it produced zero improvement in reading abilities.

Another Education Endowment Foundation trial tested the claim that learning music makes you smarter. Students were randomly assigned either to music or drama classes, and then tested for literacy and numeracy. The researchers found no difference between the two groups; suggesting either that learning music isn’t as good for your brain as we’d thought, or that drama les­sons are equally beneficial.

In a similar vein, a recent randomised trial of free school breakfast programs in New Zealand schools found that it reduced hunger rates (by 8.6 units on the ‘Freddy satiety scale’, in case you’re curious). However, free breakfasts did not improve school attendance or academic achievement for low-income children.

Unfortunately, attractive as this approach is, it isn’t really an option for most of the sorts of policy interventions I write about here, which are economywide by construction.  One can’t split the country into 100 different monetary regions, and apply different OCRs to each (chosen randomly) –  and nor, frankly, should one want to.   Even if some global dictator could do it across countries, there are far too few countries (and so many differences across them) for the results to be anything as valid as those from an evaluation of (say) a school music programme with (say) 500 kids split randomly into groups participating and not participating in the programme.  The same goes for aggregate fiscal policies, or immigration policies.  One might, perhaps, be able to do randomised trials around small aspects of, say, the Essential Skills visa programme, but not about overall approaches to immigration.  I

Instead, we are forced back onto looking what is really a small range of countries (say 40 advanced countries), over relatively short periods of history (the last couple of hundred years), and –  given that and all the other individually confounding factors –  it is perhaps less surprising that people of goodwill still differ on quite what role some of these policy interventions have to play, and what their overall effects are.  Of course, many other areas of policy are much the same –  think foreign affairs and defence –  and the difficulty of reaching of conclusive results doesn’t change the importance of ongoing analysis, research and debate, testing and evaluating the relevant comparisons and insights that history (our own and others), theory, and current experience appear to be offering.

Small size simply isn’t the issue

Just yesterday I wrote, in response to a comment, that

My point simply was that there is no obvious correlation, in the cross section, between population size and GDP per capita (or productivity). I’m not aware of any serious observer arguing otherwise

At the level of very simple correlations, I’d illustrated this lack of relationship –  whether for all countries, just advanced countries, excluding the handful of extremely large countries, or whatever.  Bigger countries (by population) don’t, on average, have higher per capita incomes than smaller countries.

But then I went to a seminar at the Productivity Commission yesterday afternoon, attended by various private and public sector people.  The substance of the seminar –  a new MBIE report on the manufacturing sector, and the discussion of it and of possible policy responses –  is embargoed until David Parker releases the report next week.   But I hope I’m not breaching any rules in simply reporting that I noted around the room an almost unquestioned acceptance that size (small) is one of New Zealand’s economic problems.  Normally I might barely have noticed it, but having been writing about the topic in the last few days, it niggled away at me.

The more I’ve thought about that issue over the years, the more I’ve concluded that those who hold it are simply wrong, and perhaps in the thrall of the political equivalent of Keynes’s “defunct economists”  –  the long tradition of political leaders, dating back at least to Vogel, who’ve wanted, as a matter of policy, a lot more people in New Zealand, believing (presumably) that New Zealanders would be better off as a result.  There doesn’t seem to be much –  any? –  evidence in support of any economywide economic benefits flowing from this preference.

One hears talk in such discussions of ideas like “markets work better in big economies”, or even talk of economies of scale –  or opportunities for specialisation – in government/regulation.  In principle, the arguments sound plausible enough.

But they rarely seem to confront the simplest stylised data.  For example, Australia and New Zealand are almost equally remote (on standard measures), but Australia’s population has been consistently much higher than ours, and yet for a century (say 1860 to 1960) material living standards (GDP per capita) were much the same on the two sides of the Tasman.

Or we could look at some advanced countries where distance/remoteness is much less of an issue.  In what follows I’ve looked at the OECD member countries in Europe (continental plus the UK and Ireland).  There are 24 of them, ranging in population from Germany’s 82 million to Luxembourg’s 0.6 million.  Five of these countries – New Zealand’s size or smaller – didn’t even exist as independent states thirty years ago.

In this chart –  for 2016 –  I’ve ordered those 24 countries by population size and shown the real GDP per capita for each.  I’ve also shown the median (so not distorted by Luxembourg, or issues around Irish tax) for the group of countries with a population less than 10 million, and also the median for the large European OECD countries.

europe real GDP and popn

If anything, the typical larger country has a lower per capita income than the typical smaller country.  Of course, these are small samples, so not much weight should be put on them, but there is nothing to suggest bigger countries are performing better than smaller countries.  And if one insisted on excluding the former communist countries – even though they are now 25 years on as market economies –  the gap (in favour of the smaller countries) – is larger.

In many respects,  real GDP per hour worked  (labour productivity) is a better metric of economic performance.  Here is the same chart, for 2016, using the OECD’s data on productivity.

europe real gdp phw and popn

I could exclude Ireland and Luxembourg, I could exclude the ex-communist countries, I could add to the “small” category the countries (Portugal to Belgium) with populations just over 10 million, and it won’t change the story.  There is nothing in the simple stylised facts of European OECD countries suggesting that bigger countries do better than smaller ones.  Even at the most prosperous core bit of Europe (London is the richest –  by income –  region in Europe), Belgium, Switzerland, Denmark and Austria do really well.  And so do France and Germany (the UK less so).

Of course, there are lots of other things that help explain any individual country’s performance. Norway, for example, wouldn’t rank so high without oil, or Ireland without the features of its corporate tax policy which see a lot more economic activity booked in Ireland than directly results from economic activity occurring in Ireland.  One issue, of course, is the quality of policy.  There are lots of different dimensions of that, and sometimes one sees a story in which small countries try harder, regulate less, or whatever to overcome the alleged disadvantages of size.   One widely-used indicator is the OECD’s index of product market regulation.  As it happens, the PMR score for the median small country in OECD Europe is less good (ie more less-liberal regulation exists) than in the median large country.

Smarter people with richer datasets and serious econometric skills can produce much more complex models, encapsulating a lot more information simultaneously.  But whatever the results of such models –  which often end up depending on the modellers’ embedded assumptions –  it is always worth bringing them back to check against the simplest stylised facts.  Even in a region where distance is much less of a differentiator among countries (it isn’t nothing –  Portugal and Greece would have it tougher than Belgium and the Netherlands even with great policy) population size doesn’t seem to be an advantage, and isn’t associated with either higher GDP per capita or higher productivity.

For decades, I’ve used the line that if only we could detach New Zealand from the ocean floor and relocate it –  land and all –  in the Bay of Biscay, just off the coast of France we’d be much better off materially, all else unchanged.  Perhaps the North Sea would be even more propitious.  But the point remains, the biggest handicap to economic success in New Zealand is our distance/physical remoteness –  in an age when, across the board (although with individual pockets otherwise) distance isn’t becoming less of an issue, but perhaps even more of one.    A modest number of people probably can do very well here, but not many.   And yet our policymakers –  aided and abetted by official advisers –  keep driving policy to locate ever more people in a really quite unpropitious –  even if beautiful and (now) peaceful –  location.

There is simply no evidence supporting the notion that our small size is “the problem” (or even a material part of it), and when the story continues to be invoked it simply serves as a distraction –  mostly unwittingly so –  from a focus on the real issue, responding realistically to the unchangeable (absent quite different technologies) constraints of our physical isolation.

Labour’s fiscal commitments

There has been plenty of talk in the last few days about the fiscal pressures the government finds itself facing.   There are echoes of the great “fiscal hole” controversy from last year’s election campaign.   And so it seemed like a good time to revisit a post I did back then on these issues.

In that post I first explained what Labour had done

Labour has laid out their numbers in a series of summary tables.  They have explicitly identified numbers for each of their (revenue and expenditure) major policy initiatives, and made explicit summary provision for the cost of a group of less expensive policies.  And they identified how much (or little) still unallocated money they would plan to have available.   The resulting operating surplus numbers are almost identical to those in PREFU, but where they do take on a bit more debt –  to fund NZSF contributions and the Kiwibuild programme – they also allow for additional financing costs.

And then they had BERL go through the numbers.    People on the right are inclined to scoff at BERL and note that they are ideologically inclined to the left.  No doubt.  But all they’ve done on this occasion is a fairly narrow technical exercise.  They haven’t taken a view on the merits of any specific policy promises or even (as far I can see) on the line item costings Labour uses.  And they haven’t taken a view on the ability of a Labour-led government to control spending more broadly.   They’ve taken the Labour numbers, and the PREFU economic assumptions and spending/revenue baselines, and checked that when Labour’s spending and revenue assumptions are added into that mix that the bottom line numbers are

“consistent with their stated Budget Responsibility Rules and, in particular

  • The OBEGAL remains in surplus throughout the period to 2022
  • Net Core Crown debt is reduced to 20% of GDP by June 2022
  • Core Crown expenses remain comfortably under 30% throughout the period to 2022.”

An economics consultancy with a right wing orientation would have happily signed off on the same conclusion.

But, so I argued, that wasn’t the real issue.   I won’t blockquote all this, but what follows is just lifted from the earlier post.

But where there is more of an issue is that Labour’s spending plans on the things they are [explicitly] promising mean that to meet these surplus and debt objectives, on these [PREFU] macro numbers, there is very little new money left over in the next few years.     That might not sound like a problem –  after all, why do they need much “new money” in the next few years when the things they want to do are already specifically identified and included in the allocated money in the Labour fiscal plan?      The answer to that reflects the specifics of how the fiscal numbers are laid out, and how fiscal management is done.   Government departments do not get routine adjustments to their future spending allowances to cope with, say, the rising demands for a rising population, or the increased costs from ongoing inflation (recall that the target is 2 per cent inflation annually).   Rather, they are given a number to manage to, and only when the pips really start squeaking might a discretionary adjustment to the department’s baseline spending be made.  Any such discretionary adjustments comes from the “operating allowance” –  which thus isn’t just available for new policies.

You can see in the PREFU numbers.   Health spending rose around $600 million last year, and is budgeted to rise by around $700 million this year (2017/18).  And then….

$m
2017/18 16432
2018/19 16449
2019/20 16481
2020/21 16396

No one expects health spending to remain constant in nominal terms for the next three fiscal years.  But there will need to be conscious decisions made in each successive Budget to allocate some of the operating allowance to health –  some presumably to cover new policies, and much to cover cost increases (wages, drugs, property etc, and more people), all offset by whatever productivity gains the sector can generate.

And here is why I think there are questions about Labour’s numbers.  By 2021, they expect to be spending $2361 million more on health than is reflected in these PREFU numbers.     About 10 per cent of that increase is described as “Paying back National’s underfunding” and the rest is labelled as “Delivering a Modern Health System”.

This is how they describe their first term health policies

Reverse National’s health cuts and begin the process of making up for the years of underfunding that have occurred. This extra funding will allow us to invest in mental health services, reduce the cost of going to the doctor, carry out more operations, provide the latest medicines, invest in Māori health initiatives including supporting Whānau Ora, and start the rebuild of Dunedin Hospital.

That sounds like an intention to deliver materially more health outputs/outcomes (ie volume gains, or reduced prices to users).

In response to Steven Joyce’s attack, Grant Robertson is reported as having told several journalists that Labour’s health (and education) numbers include allowances for increased costs (eg rising population and inflation  –  and inflation in the PREFU is forecast to pick up) as well as the costs of the new initiatives.   Perhaps, and if so perhaps a pardonable effort to put a favourable gloss on the proposed health (and education) spends –  ie sell as new initiatives what are in significant part really just keeping with cost and population pressures.  I say “pardonable” because governments do it all the time.

In this chart, I’ve shown core Crown health expenditure as a share of GDP since 2000, and including Labour’s plans for the next three budgets.  (Labour show total Crown numbers, but I’ve taken their policy initiative numbers –  ie changes from PREFU –  and applied them to the core Crown data, which Treasury has a readily accessible time series for.  The differences between core and total Crown in this sector are small.)

Labour health

In other words, on these numbers health as a share of GDP over the next three years would be less than it was for most of the current government’s term, and virtually identical to what it was in Labour’s last full year in government, 2007/08.    Some of the peaks a few years ago were understandable –  the economy was weak, and recessions don’t reduce health spending demands.  But even so, we know that there are strong pressures for the health share of GDP to increase, as a result of improving technology (more options) and an ageing population.  Treasury’s “historical spending patterns” analysis in their Long-term Fiscal Statement last year had health spending rising from 6.2 per cent of GDP in 2015 to 6.8 per cent in 2030.

Without seeing more detail than Labour has released there really only seem to be two possible interpretations.  Either Labour hasn’t allowed for the ongoing (ie from here) population and cost increases in their health sector spending numbers, or there must be much less in the way of increases in health outputs than the documents seem to want to have us believe (eg “reversing years of underfunding”).  One has potential fiscal implications.  The other perhaps political ones.    Glancing through Labour’s health policy, which seems quite specific, I’m more inclined to the former possibility (ie not allowing for population and cost pressures), but I’d be happy to shown otherwise.

Eyeballing that chart –  and as someone with no expertise in health –  it would look more reasonable to expect that health spending might be more like 6.5 per cent of GDP by the end of the decade, in a climate where a party is promising more stuff not less, and with no strategy to (say) shift more of the burden back onto upper income citizens.

2018 commentary resumes here:  in other words, despite all the talk in their own campaign documents and rhetoric about systematic underfunding of health, Labour’s proposed spending on health –  carefully laid out numbers – as a share of GDP just wasn’t consistent with the rhetoric.   They – and perhaps even the previous government –  may not have been specifically aware of, say, the Middlemore problems, and perhaps more generally things really are worse than they could have realised in Opposition.   But it seems implausible to think that a party talking up underfunding –  and well aware, for example, of the constant pressure on DHBs to produce surpluses come what may –  could have supposed that, on their proposed delivery models and views on entitlements, operating spending on health of only 6 per cent of GDP could have been enough.     That was stuff they should have recognised and acknowledged going into the election.

As I noted in last year’s post, one could do the same exercise for education.  This is another quote from that post:

One could do much the same exercise for education.  Labour has seven line items in its “new investments” table.  Most of them are very specific (including increased student allowances and the transitions towards zero-fees tertiary education).     There is a general (large) item labelled “Delivering a Modern Education System” but in the manifesto there are a lot of things that look like they are covered by that.    There isn’t any suggestion that general inflation and population cost increases are included, but perhaps they are.  But again, here is the chart of education spending as a share of GDP, including Labour’s numbers for the next three years.

labour education.png

I’m not altogether sure what some of those earlier spikes were (perhaps something to do with interest-free student loans), but again what is striking is that Labour’s plans appear to involve spending slightly less on education as a share of GDP than when they were last in government.  And that more or less flat track from here doesn’t suggest a party responding to this stuff

National has chosen to undermine quality as a cost-saving measure. After nine years of being under resourced and overstretched, our education sector is under immense pressure and the quality of education is suffering. The result is a narrowing of the curriculum, more burnt out teachers, and falling tertiary education participation.

and at the same time committing to flagship policies around things like student allowances and fee-free tertiary study.

Again, it begins to look as though Labour has included in its education numbers the ongoing multi-year costs of its own new policies, but not the ongoing cost increases resulting from wage and price inflation and population increases.  Again, I’d happily be shown otherwise.

Of course, there is some unallocated spending in Labour’s numbers, but the amounts are very small for the next few years, and some of these sectors are very large.  And although population growth pressures are forecast to ease a little in the next few years, inflation is forecast to pick up and settle around the middle of the target range, so there are likely to be increased general cost pressures (including, for example, wage pressures if as Labour state in the fiscal plan document “by the end of our first term, we expect to see unemployment in New Zealand among the lowest in the OECD, from the current position of 13th”).

How much does it matter?  After all, we don’t know many specifics on the policy initiatives National (and/or its support partners) might fund in the next term, and there was the strong suggestion the other night of a new “families package” in 2020 (which would come from any operating allowance).  Quite probably the next few years will be tough, in budget terms, for whoever forms the government.  After all, the terms of trade isn’t expected to increase further, and inflation is.  And there is a sense that in a number of areas of government spending things have been run a bit too tight in recent years.      On the other hand, Labour participated in this ritual exercise and it looks as though they may have implied rather more fiscal degrees of freedom than were actually there, if –  critical point –  they happened to want to produce a surplus track very like National’s.

2018 commentary resumes again. But all that led me to wonder quite why Labour had made the commitments it had.  Here is a final, slightly shorter, quote

……perhaps the bigger question one might reasonably put to both sides is why the focus on (almost identical) rising surpluses?   These are the numbers.

labour surplusWhen net core Crown debt is already as low as 9.2 per cent of GDP –  not on the measure Treasury, the government and Labour all prefer, but the simple straightforward metric –  what is the economic case for material operating surpluses at all?   With the output gap around zero and unemployment above the NAIRU, it is not as if the economy is overheating (the other usual case for running surpluses).   Even just a balanced budget would slowly further lower the debt to GDP ratios.   One could mount quite a reasonable argument for somewhat lower taxes (if you were a party of the right) or somewhat higher targeted spending (if you were a party of the left, campaigning on structural underfunding of various key government spending areas).
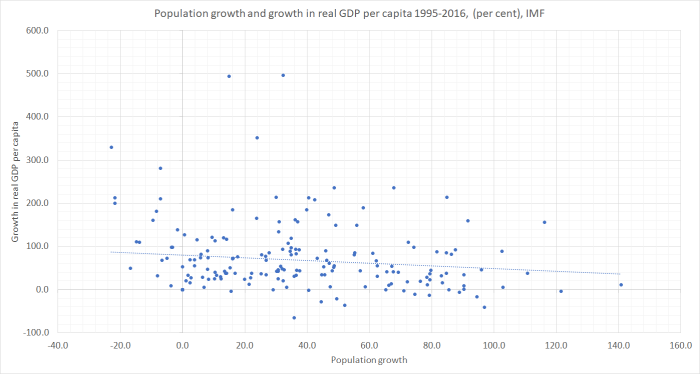
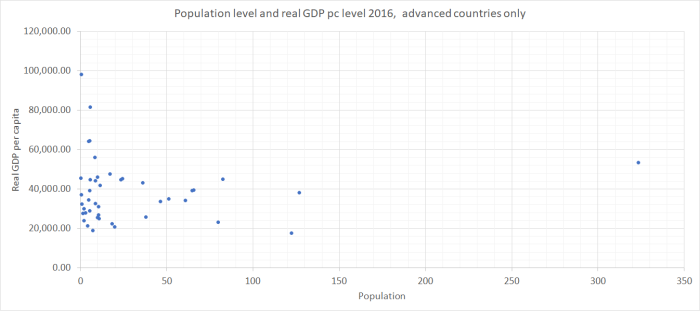
Labour is promising to spend (and tax –  thus the surpluses are the same) more than National.  But their commitment (rule 4) was to keep core Crown expenditure “around 30% of GDP”, not “comfortably below 30 per cent”.

labour spending

28.5 per cent is quite a lot lower than 30 per cent (almost $5 billion in 2020/21 – not cumulatively, as GDP is forecast to to be about $323 billion). And 30 per cent wasn’t described as a ceiling. And in the last two years of the previous Labour government, core Crown spending was 30.6 per cent of GDP (06/07) and 30 per cent of GDP (07/08).

It is a curious spectacle to see a party campaigning on serious structural underfunding of various public services and yet proposing to cut government spending as a share of GDP.  It would be difficult to achieve –  given the various specific policy promises –  but you have to wonder, at least a little, why one would set out to try.     We simply aren’t in some highly-indebted extremely vulnerable place.

Here endeth the quotes from last year

I’m not one of those persuaded by the siren calls that the government should be borrowing heavily because interest rates are low.   For a start, our interest rates are still among the very highest in the OECD.   And interest rate outcomes aren’t the result of some random-number lottery: they are low for a reason (having to do in no small part with future expected rates of growth).   I’m also cautious about the lack of “policy space” to cope with the next serious recession.   But in the debate around this year’s Budget, or the next couple, most aren’t suggesting the government should rush out and adopt fiscal parameters that might deliver net debt of 50 or 70 per cent of GDP a decade hence.   Instead, Labour simply bound itself to the same, arbitrary, net debt target as National had run with, just achieved a couple of years later than National planned to do so.

I don’t agree with everything in this extract from Matthew Hooton’s Herald column the other day, but the gist seems about right.

Robertson has convinced himself that sticking to his commitment is essential to maintain the confidence of the business community and financial markets.

He remembers the Winter of Discontent of 2000 and is determined to avoid at all costs investors and business becoming actively hostile to the new regime.

But this just shows Robertson’s naivety about the business and finance communities and woeful ignorance of what drives confidence in either.

At a net 22 per cent of GDP, New Zealand’s debt is already low compared with the rest of the world. If carefully signalled and communicated by Robertson and his Treasury officials, it is implausible that a further extension of the 20 per cent debt target to, say, 2025, would provoke a materially adverse reaction from the business community or financial markets, especially if emphasis was placed on investments in infrastructure and human capital.

Moreover, the business and financial communities well understand and accept that the fundamental difference between Labour and National governments — at least theoretically — is that the former believes in bigger government than the latter.

And yet –  see the graph immediately above- Labour campaigned on continued reductions in government operating expenditure as a share of GDP, all the time claiming that core services were underfunded.   And in her press conference yesterday, the Prime Minister indicated that Labour would be sticking to its self-imposed Budget Responsibility Rules.  As I illustrated above, under the operating spending limb of those Rules there is plenty of slack, but the binding rule on this occasion is the net debt goal they have committed to.  And net debt isn’t just affected by any increase in operating spending, but also in any action the government takes to address claims of (previously unrecognised) backlogs in capital investment.

Labour seem to have first got themselves into this hole from (a) a desperate desire not to leave room to be painted as irresponsible potential economic managers, and (b) an inability to persuasively make an alternative case.  And all of this was laid down at a time when, perhaps, it seemed that the chances of having to actually deliver, in government, were slim.     But, in the old line, the first rule of holes is “stop digging”.  At present, Labour –  while claiming things are much worse than even they realised –  seem to be setting out to dig themselves even deeper in.   In a way, perhaps, it is admirable that they seem to want to follow through on a pre-election commitment.  But that narrative about fixing public services, and reversing what they regarded as severe underfunding in many areas (now worse, they claim, than they previously recognised) seemed quite like a pre-election commitment as well, even if it didn’t have precise numbers and dates on it.

(And yes, my natural inclinations are towards smaller government.  There are plenty of things I would cut back on, notably addressing NZS issues.  This post isn’t an unconditional advocacy for bigger government, or any sort of statement of faith in the likely quality of much government spending, just pointing to the tortured, almost indefensible, logic of the government’s own position.   And for those who worry about the interest rate consequences of higher net debt, I tackled that in another post last year.)


More on population and per capita GDP

My quick post on Saturday, in response to someone’s comment, was designed simply to illustrate what should have been quite an obvious point: looking across countries in any particular year, countries with large populations don’t tend to be richer (per capita GDP) than countries with small populations.  Just among the very big countries, the United States is towards the top of the GDP per capita rankings (beaten by a bunch of small countries), and China, India, Indonesia, Pakistan, and Brazil are not.   Since both the physical sizes of countries, and their populations, are the outcomes of all sorts of historical factors, it wasn’t an observation about immigration policy or (wince) “population policy”.    And, of course, GDP per capita isn’t everything: moderately well-off large countries are typically more powerful (defence or offence) than small rich ones.

But, continuing to play with the same data download from the IMF WEO database (190 or so countries and territories) for the period since 1995, is there any obvious relationship betweeen population growth rates, and growth in real per capita GDP?

Here is the chart

population 9 Aug 1 all countries

Actually, I’ve left out three extreme outliers –  all oil producers.  Equatorial Guinea had growth in real GDP per capita of about 2500 per cent over the period, and UAE and Qatar had population growth of 300-400 per cent (in one case, with falling real GDP per capita, and in the other with a moderate increase).

There is basically no relationship between the two series –  again, each dot is a country.  The simple linear regression line is downward-sloping but that probably wouldn’t be a statistically significant relationship.  Bear in mind though that simply charting population growth and per capita GDP growth for the same period could have shown an upward-sloping relationship even if there was no causal link from faster population growth to faster per capita economic growth: countries with rapid growth in real GDP per capita might be expected to attract more people (immigrants flow towards opportunity) and perhaps even induce higher birth rates.   But there is no sign of even that sort of relationship, across all countries, and over this period of 20 years or so (this sort of reverse causality is a big problem looking at annual data, but much less so looking at long periods).

The full sample of countries includes a huge range of types of countries –  from war-torn poverty stricken basket cases (Syria, Somalia, Afghanistan) to tiny remote islands (Tuvalu), as well as places with strong institutions, good connections, and an established record of economic performance.   How do this simple bivariate relationships look if we focus just on these latter countries?

In various posts over the years, I’ve used a sample of about 40 fairly advanced countries, encompassing the members of the OECD and the EU, as well as Taiwan and Singapore.   There is still a lot of difference among these countries: places that were non-market communist economies only 30 years ago, the odd place (eg Mexico) that is more like an honorary member of the group of advanced countries, as well as the places with very high productivity (France, Germany, United States, Ireland, Norway).  And there are countries as small as Malta or Luxembourg, and as large as the United States.  This group leaves out countries that appear to be rich only because of oil.

Here is the simplest plot: of the levels of population and GDP per capita in 2016.

popn advanced 1

This time, the simple regression line is very slightly upward sloping.  Remove the US and it changes sign.  Remove all the countries with more than 50 million population and it is still downward sloping.

But what about growth rates?  For quite a few of these countries, GDP per capita is pretty shaky before about 1995 (communist-era and immediate post-communist transition).  That’s why I’ve done all these charts for just the last 20 years or so.  But that also happens to be a period when there has been a lot more population movement between advanced countries (especially in Europe).

popn advanced 2

Recall that even if there was no causal relationship running from population growth to growth in real GDP per capita, there was a possibility that we might have seen an upward-sloping relationship simply from any link between successful economies drawing in more people (as happened in Ireland most obviously –  net immigration rising well after the boom in per capita GDP and productivity).  But, in fact, across these 40 or so advanced countries, any relationship is downward sloping.  Across these countries in this period, faster population growth has been associated with slower real per capita GDP growth. (For the eagle-eyed among you, New Zealand is the red dot.)

And in this final chart, I’ve broken the period in two.  I’ve charted, for each country, population growth in the first 10 years of the period (1995 to 2005) against real GDP per capita in the second half of the period (2005 to 2016).  In other words, none of the population growth variable is directly caused by the growth in the real per capita GDP variable.

popn advanced 3

The downward-sloping relationships is weaker this time –  less of the variance in GDP growth is explained simply by prior population growth –  but again it is downward-sloping, and not the upward-sloping line many of the immigration-policy boosters in New Zealand would like us to believe.   I forgot to mark New Zealand on this chart –  we are one of the dots a bit below the line with 12 per cent population growth –  but there is nothing unusual about New Zealand’s place on either chart.

If one wants to get more sophisticated, one could look at growth in labour productivity or total factor productivity, rather than just real GDP per capita.  Especially for TFP, one becomes dependent on the model used in estimating TFP and the available sample of countries drops away,  As for labour productivity, in earlier posts I’ve illustrated the lack of a positive relationship between population growth and productivity growth (and recall that New Zealand has managed better real per capita GDP growth than productivity growth, by working longer hours), and that –  for example –  if anything business investment as a share of GDP has been negatively correlated with population growth across advanced countries.  That is the opposite of what might been expected if population growth –  and immigration –  was typically boosting the productivity and per capita income prospects of recipient countries.

It is past time we started backing our own people, not looking to replace or augment them with a mythical group from across the water.  Part of that involves the government getting serious about facing up to the disappointing economic outcomes of our long-running Think Big economic and social experiment with large scale immigration.  As part of that, in turn, a serious review of immigration policy by the Productivity Commission –  there have been two in Australia in the last 15 years –  would be a good place to start.