A very strong economy driven by the strong economic plan?

The latest quarterly GDP data came out just before Christmas, and they included substantial revisions to the data for the last few years, flowing on from the annual national accounts data released in November.

The actual level of GDP is now a bit higher than had previously been reported, but what caught my eye was the reported claim from the former Minister of Finance, Steven Joyce, that the new data suggested that there was no productivity growth problem after all.   You’ll recall that for some time I –  and others –  have been highlighting data suggesting that there had been basically no productivity growth at all in New Zealand for the last five years.

Here was Steven Joyce’s specific claim

Mr Joyce says the figures released today finally put to bed the fallacy that New Zealand was having a ‘productivity recession’.

and he went on to claim that

“These figures provide clear confirmation that the new Government has inherited a very strong economy driven by the strong economic plan of the previous Government.

So what do the productivity numbers look like on the revised GDP data?  You may recall that I’ve been calculating nine different measures of real GDP per hour worked (using the two quarterly measures of GDP, and the HLFS and QES hours data, and an average measure).    Since GDP for the last few years had been revised upwards and the hours numbers weren’t touched, productivity growth was inevitably going to be a bit stronger than previous estimates had suggested  (which was a relief, because the previous estimates had, if anything, suggested a modest fall in the level of productivity and that didn’t really ring very true).

Here is how the average measure of real GDP per hour worked has behaved over the almost 10 years since 2007 q4 (just prior to the 08/09 recession).

GDP phw worked NZ Jan18

Over the last 10 years (less one quarter), total labour productivity growth has been 6 per cent.    Over the last five years, New Zealand’s total productivity growth has been 1 per cent (ie about 0.2 per cent per annum).   It is a little better than the previous iteration of data has suggested, but……it isn’t much to boast about.

Using the same average measure, I calculated the average annual rate of productivity growth for a few historical periods:

  • Under the National-led governments in the 1990s,  average annual productivity growth was 1.2 per cent (quite dismal enough, given how far behind we had slipped),
  • Under the Labour-led governments of 1999 to 2008, average annual productivity growth was 1.0 per cent,
  • Under the National-led governments of 2008 to 2017, average annual productivity growth was 0.8 per cent, and
  • (as already noted), over the last five years, average annual productivity growth was 0.2 per cent per annum.

And here is the comparison with Australia, on the newly-updated New Zealand data.

AUs and NZ reaL gdp PHW

Australia’s numbers seems to have been flat for the last couple of years, but even over that short period we’ve done a bit worse than they have.

If these results are what Steven Joyce had in mind in talking of a “very strong economy driven by the strong economic plan” one can only really shake one’s head in despair.   If there was a plan to lift overall productivity performance, it clearly didn’t work.  Economic policy was simply misguided, and seems to have paid no attention to the severe limitations of our location.   Perhaps more depressing –  given that Joyce and his colleagues are in Opposition –  is that there is little sign that the new government has any more convincing a strategy  (and where is the deeply-grounded persuasive advice of MBIE and Treasury?).   One hopes –  but is that just against hope –  that they care.

On more mundane matters, I had cause to wonder about even the cyclical strength of demand when, over the holidays, one evening my wife and I walked from Epsom to Parnell and back, and were staggered by just how many empty shops there were in both Newmarket and Parnell.    Any reader insights into just what is going on (or not) in those up-market shopping districts would be of interest.


A few HYEFU thoughts

At the time the PREFU was published in August, I ran a short post illustrating that not even Treasury seemed to believe there was any prospect of increasing the export share of GDP in the next few years.  Their projections were that, on the then-government’s policies, the decline in the export share would continue unabated over the years to 2021.

The next set of Treasury forecasts were published in the HYEFU yesterday.  We have a new government  –  even a Minister for Export Growth –  so I was curious to see what the updated forecasts looked like.

This chart captures the actual export share of GDP, now through to the June 2017 year, and shows separately the PREFU and HYEFU forecasts.

exports hyefu

There is a bit of a lift between PREFU and HYEFU, but interestingly the downward trend is still in place in the last set of numbers.

What has changed?  Mostly the exchange rate.   Here are the assumptions/projections for the exchange rate in the two sets of forecasts.

TWI hyefu

Over the full forecast horizon, the exchange rate is now assumed to be around 5.5 per cent lower than was previously assumed –  more or less just treating the fall in the last few months as if it will be sustained.   Some of that fall will flow through into the domestic price level, but it is still a real exchange rate fall of around 5 per cent.    But even though that fall is assumed to be sustained for several years –  4.5 years to the end of the forecast horizon –  there is no sign of the decline in New Zealand’s export share of GDP being reversed.  Presumably it would need (policy changes that brought about) a much larger sustained decline to really begin to make a substantial difference.

I know some commentators think the exchange rate could soon fall quite a bit further –  after all if the US keeps on raising interest rates, they’ll soon have a Fed funds target rate equalling our OCR.   But Treasury doesn’t think that is likely: they still have large increases in the OCR (and 90 day rates) forecast for the next few years, far larger (and sooner) than anything in the Reserve Bank’s numbers.   Frankly that still seems unlikely, but these are the projections/advice of the government’s leading economic advisory agency.  On their numbers, the prospects for the tradables sector don’t look good.

There are other sobering aspects in the numbers.   Take this chart for example.

output gap hyefu

The solid line is the Treasury estimate –  on their numbers the output gap is still estimated to be negative, bringing to 10 years the period in which our leading economic advisers think the economy has been running below capacity.   When things like that happen –  and they shouldn’t –  it is usually an adverse reflection on macroeconomic management.  It also isn’t very clear why things should suddenly come right next year –  with a forecast of the biggest change in the output gap in the last decade, suddenly moving the economy into an excess demand situation.  We’ll see.

And there are also some heroic forecasts for productivity growth.  Recall that we’ve had no productivity growth at all for five years now.  Treasury don’t expect any this year either.  But then suddenly things come right, and over the subsequent four years growth in real GDP per hour worked is expected to exceed 1.5 per cent per annum.  On quite what basis –  other than wishful hope –  it isn’t really clear.  Apart from anything else, the optimistic assumption probably flatters the fiscal numbers.

But in some ways the biggest mystery in the entire document is the bottom line fiscal numbers themselves. As I noted before the election, I found it hard to conceive that people voting for a change of governmnet, for a left-wing government, were really voting for government spending as a share of GDP to keep on falling.  On the government’s – perhaps over-optimistic numbers, core Crown expenses in the last forecast year is expected to be smaller, as a share of GDP, than in any year of the previous National-led government.    To be sure, lower government spending will keep some pressure off the real exchange rate, but there are other ways to deliver that outcome.   And it is curious to think that the governing parties campaigned on the existence of all sorts of deficits in the provision of public services, and yet their fiscal numbers keep net debt (including the assets in the NZSF) dropping away to almost nothing.

net debt

I doubt it will happen: the economy is likely to be weaker (and it would be unprecedented if we got to 2022 without a recession) and spending pressures are likely to be greater than allowed for in these numbers, but these are plans the government is articulating and defending.  I’m not entirely sure why.

But that is something to speculate on next year.  This is the last post from me for the year.  I imagine I’ll have found interesting stuff to write about  –  and the urge to do so –  by the second week of January or even earlier, but it might depend on whether the glorious Wellington summer continues.


Exports in a cross-country perspective

Across the advanced world, exports have been becoming a larger share of most countries’ GDP.  This chart shows the median export share for OECD countries going back to 1971.

export % of GDP OECD

The OECD only has complete data for all its member countries since 1995, but in that time total exports as a share of total OECD GDP have risen from 19.5 per cent to 28.3 per cent.

There is some short-term variability –  I’m not sure what explains the 2016 dip –  but the trend has been pretty strongly upwards.  That’s encouraging: trade (imports and exports, domestic and foreign) is a key element of prosperity.

For quite a while, New Zealand’s performance was very similar to that of the median OECD country

export %

and then it wasn’t.    The last time New Zealand’s export share matched that of the average OECD country was around 2000/01, when our exchange rate was temporarily very low (and commodity prices were quite high).   At very least, we’ve been diverging for 15 years now, although it looks to me that the divergence really dates back at least 20 years to the early-mid 1990s.

Once upon a time –  well before these charts –  New Zealand traded internationally much more than most other countries.   With a high share of exports in GDP, and a high GDP per capita, a common line you find in older books was that New Zealand had among the very highest per capita exports of any country.    These days, not only is GDP per capita below the OECD median, but so is our export share of GDP.

Small countries typically have a larger share of exports in their GDP than large countries.  That isn’t a mark of success for the small country, just a reflection of the fact that in a small country there are fewer trading partners.  If your firm has a great world-beating product and yet is based in the US quite a large proportion of your sales will naturally be at home.  If your firm is based in Iceland or Luxembourg, almost all your sales will be recorded as exports.  US exports as a share of GDP are about 12 per cent at present, but divide the country into two separate countries and even if nothing else changes the exports/GDP shares of both new countries will be higher than those of the United States.   The median small OECD country currently has gross exports of around 55 per cent of GDP  (New Zealand 26 per cent).

On the other hand, we also expect to see countries that are far away do less international trade than countries that are close to other countries (especially countries at similar stages of economic development).   That isn’t just a statistical issue, an artefact of where national boundaries are drawn.  Distance is costly –  there are fewer economic opportunities for trade.     That has become over more apparent in recent decades as cross-border production processes have become much more important: in the course of producing a complex product, component parts at different stages of assembly may cross international borders (and be recorded as exports) several times.   This has been a particular important possibility in Europe, and has been part of the success of formerly-Communist countries like Slovakia.    Distance is an enormous disadvantage –  enormous distance (such as New Zealand suffers) even more so.

The OECD is now producing data on the share of domestic value-added in a country’s exports.  The data only go back to 1995, and are only available with quite a lag (the latest are for 2014) but you can see the difference between New Zealand’s experience and that of the median OECD country.

value-added

These opportunities (gains from trade that weren’t economically posssible a few generations ago) generally aren’t available to New Zealand based firms.  Then again, a widening in this particular gap isn’t the explanation for the divergence between New Zealand’s export performance over the last decade and that of the median OECD country (since the gap hasn’t widened further).

New Zealand has just been doing poorly.

Here is one comparison I found interesting.

nz vs fr

France has more than ten times the population of New Zealand and yet its foreign trade share now exceeds that of New Zealand.    The United Kingdom –  similar population to France –  also now has a higher trade share than New Zealand.   And the difference isn’t just down to components shuffling back and forth across frontiers in the course of manufacturing (eg) Airbus planes.  New Zealand’s exports have a larger domestic value-added share than those of the UK or France, but adjust for that and all three countries now have export value-added shares of GDP of around 21 per cent.  In a successful small country you would expect –  and would typically find –  a much higher percentage.

Remoteness looks like an enormous disadvantage for New Zealand, at least for selling anything much other than natural resource based products  (even our tourism numbers aren’t that impressive by international standards).   Here is the comparison with another small remote country, Israel  (it is both some distance from other advanced country markets, and made more remote by the political barriers of its location/neighbours).

nz vs israel

The Israel series is more volatile than New Zealand’s –  probably partly reflecting the extreme macroeconomic instability in the Israel earlier in the period –  but the overall picture is depressingly similar (and that in a country where R&D spending is now around 4 per cent of GDP).    The other similarity with New Zealand: very rapid immigration-driven population growth, into an economically difficult location.  As I’ve illustrated in previous posts, Israel has struggled to achieve much productivity growth and has a similarly low level of real GDP per capita.

Looking back over the last few decades, it is sobering to note that natural-resource dependent advanced economies are foremost among those that have struggled to achieve higher international trade shares of GDP.    It isn’t some sort of fixed rule: if, like Australia, vast new deposits of minerals become economically exploitable, a remote natural resource dependent economy can see its export share of GDP rise.  And if you have enough natural resources and few enough people, you can be very well-off indeed, even if the export share of GDP isn’t rising (Norway is the only OECD country where exports have’t risen at all as a share of GDP since 1971).  But if you are very dependent on natural resource exports –  and that dependence doesn’t seem to be changing –  then you’d probably want to be very cautious about actively using policy to drive up the population unless –  as with Australia –  there are new waves of nature’s bounty to share around.

New Zealand –  apparently structurally unable to secure rapid growth in exports based on anything other than natural resource –  looks not only like the last place on earth, but the last place in the advanced world to which it would make sense to actively set out to locate ever more people.  And yet is exactly what one government after enough does, apparently blind to paucity of economic opportunities here.    They might wish it was different, and perhaps one day it even will be, but for now there is just no evidence to support their strategies.  Every year, in following that course, governments make it harder for New Zealanders as a whole to prosper.

Oh, and what changed in the last 20 years or so –  to go back to that second chart?  After 20 years of quite low levels of immigration, active pursuit of large non-citizen immigration targets became a centrepiece of policy again.   Without great economic opportunities here –  already or created by the migrants –  that renewed population pressures just made it even harder, despite all the good work on economic reform in the previous decade –  for outward-oriented firms to succeed, and made the prospects of ever closing the income and productivity gaps to the rest of the OECD more remote than ever.

No fix for the flawed fundamentals

I’ve had fairly low expectations of what a change of government might mean for overall economic policy, but at present the new government seems to be charting a course to under-deliver even those low expectations.

The Minister of Finance yesterday gave his major public speech since taking office, explicitly selling it as an outline of the government’s economic strategy.     Sadly, there wasn’t very much there, and much of what was there focused –  as his speech title did –  on sharing and redistributing, with very little on reversing the decades of dismal economic underperformance.   Simply cutting the pie differently is no long-term solution to the sort of failure that has seen almost a million New Zealanders (net) leave New Zealand for a better life, for them and their families, abroad.

During the election campaign I was somewhat critical of Labour for simply accepting the National government’s narrative that the economy was basically doing fine.  But at least then I could sort of understand why they might do it –  something about not scaring the voters in the centre ground and not coming across as alarmist when they didn’t have much of a solution.    It is bit more surprising, and much more disappointing, to see that narrative carried over into office.

Here is what the Minister of Finance had to say this morning

While the fundamentals of our economy were, and are, strong, the purpose of it had become lost.

Again, perhaps after some bad business confidence numbers he doesn’t want to scare the horses.  But (a) you don’t produce better outcomes without actually facing what has gone wrong in the past, and (b) it is starting to seem as though the Minister of Finance actually believes the story on some level.

Grant Robertson was born in 1971.  Even by then, our economy had been in relative decline for a couple of decades –  and all the contemporary experts knew it.  But if we were no longer among the most productive and wealthiest of the then advanced economies, at least we were still in the middle of the pack.  Since then, we’ve just lost further ground –  the relative decline was particularly bad in the 1970s, but there has never been a sustained period since then when we’ve looked like reversing any of the relative decline.  Not under National governments, and not under Labour government’s either.    When Grant Robertson went off to university, eastern and central Europe was still Communist-run, with highly inefficient poorly-performing economies.    These days, the better performing of those countries –  Slovakia, Slovenia, the Czech Republic – are closing in on New Zealand levels of productivity/income, and places like Hungary and Poland aren’t that further behind.   Turkey is on the brink of going past us.   They’ve done quite well, but still have a long way to go to catch up with the West European leaders.  We’ve just done really rather badly; mediocre at a (generous) best.

Economies that are performing well  are typically ones in which the tradables sector of the economy is growing.   Local firms are finding more products and services which they can sell to, or compete with, the rest of world.   But we’ve had no growth in real per capita tradables sector GDP since around 2000.  Exports are a share of GDP are, as I illustrated the other day, now at the lowest level since 1976.

Over the last quarter century – even after the economic reforms –  our productivity growth has been among the lowest in the OECD (and we started from a bad position).  Most starkly –  and this a point that Robertson does mention –  we’ve had no productivity growth at all for the last five year.

And then, of course, there is the disastrously dysfunctional housing/land market: a country with so much land nonetheless has some of highest house price to income ratios anywhere in the advanced world.

Frankly, the “fundamentals of our economy” are pretty poor, especially if what we care about is the ability to support high incomes (fairly shared) for all of our people.  Yes, there are some things we can chalk up on the other side:  we’ve largely avoided a domestic financial crisis, our government accounts are sound, our people are pretty highly skilled (we’ll come back to that one), and our unemployment rate isn’t too bad (even if it is still above a NAIRU).   But mostly those are ‘inputs”: the “outputs” and “outcomes” don’t look very attractive at all.  And that makes it all the harder to deal effectively with some of the pressing social (and environmental) issues.

You might think an incoming government was well-positioned to point this stuff out.  But I guess there is no point in doing so if you haven’t got a strategy that is likely to be (a) materially different from what went before, and thus (b) likely to produce material different outcomes.

Instead, they seem to want to play down the dismal economic data and follow The Treasury down the not-particularly-well-grounded path of the Living Standards Framework (which I wrote about a couple of weeks ago)

I have asked the Treasury to further develop and accelerate the world-leading work they have been doing on the Living Standards Framework.  This focuses on measuring our success in developing four capitals – financial, physical, human and social. These give a rounded measure of success and of how government policy is improving our well-being.

This is a far better framework for judging our success.

As I’ve suggested previously, it looks more like a way of avoiding confronting our really bad long-term economic performance and the very large trend outflow of our own people.

The Minister of Finance claims they will keep a focus on productivity.

Low productivity has been a cloud over the New Zealand economy for decades and previous governments have failed to tackle this issue – this government will not.

Which sounds okay, perhaps even momentarily encouraging.  But how are they going to do this?  The Minister identifies only two areas.   The first is skills.

Lifting the skills of our people is critical to solving the productivity challenge.

In fact, there is not the slightest evidence for this proposition, which would lead the reader to suppose that skill levels in New Zealand lagged behind those in other, more economically successful, OECD countries.   No doubt we can do better (and there are specific pockets of underperformance), and there have been some disconcerting developments in the PISA results in recent years.  But the OECD produced data only last year suggesting that New Zealand workers were among the two or three most highly-skilled in the OECD.      They used three measures and this was one of them

oecd problem solving

As I summed it up at the time

Looking across the three measures, by my reckoning only Finland, Japan, and perhaps Sweden do better than New Zealand.

Increased subsidies for tertiary education (the policy Robertson then advances) will, no doubt, serve a redistributional function (even if one of questionable merit –  and I say that as a parent with three kids likely to go to university in the next eight years).  But there is little evidence they will do anything to close aggregate productivity gaps –  which, in New Zealand, aren’t about the skills or energies workers bring with them, or even about our legal institutions, but about the profitable business opportunities firms can find here.

And the second strand to Robertson’s response to our productivity failure is R&D.

Also critical for lifting productivity is increased investment in Research, Development and Innovation. The first step in this is the introduction of an R and D Tax Credit.  Beyond that we will move to work smarter, adding value to change the mix of our exports and using and creating new technologies.

I’m not aware of any serious observer, even among supporters of R&D tax credits, who believe that such credits are likely to make a transformative difference.

This is the data from the national accounts (March years) for research and development spending as a share of GDP.

R&D

It would be interesting to know quite what was going on in the 1970s, but really ever since then there hasn’t been much change in the share of GDP devoted to R&D (as captured by Statistics New Zealand).  Interestingly, the most recent year saw the highest R&D share in the 45 year history of the series.

Many observers point out that New Zealand is relatively unusual among advanced countries in not having an R&D tax credit.  There are various other countries, including Denmark and Switzerland, but on the extreme far end of the OECD’s chart of a summary indicator of such matters are New Zealand and Germany.

And yet here is the OECD’s data on R&D spending.  For this particular series they don’t have data for New Zealand for every year, but the picture is still clear enough.

R&D 2

The New Zealand R&D spend (as a share of GDP) is well below the OECD total, and Germany’s has been consistently above (as are those in Denmark and Switzerland).   And neither country has R&D tax credits.  In fact, when the OECD totted up all the different sorts of government support for business R&D, the New Zealand government was considerably more generous than Germany.

It suggests, as I’ve argued here for some time, a need to stand back and think about what it might be in the New Zealand economic environment that means so little R&D occurs here.  Firms typically take the risk of investing in R&D when they think the opportunities for profitable businesses are good.     That doesn’t appear to have been the case in New Zealand (in contrast, say, to Germany), and consistent with that overall business investment as a share of GDP in New Zealand has been low by advanced country standards, for decades, even though our population growth rate has been much faster than that in the typical OECD country (more people will typically require more business investment if living standards are to keep pace).   This is not the place for a lengthy discussion of factors that might discourage firms from investing here, but high interest rates (relative to those abroad), an out of line real exchange rate, and being the most remote advanced country on earth (at a time when personal connections, value-chains etc seem to have become more important) might be things to think about.  Not one of them appears in the Minister’s speech.


Perhaps the closest he comes is in a summary of the government’s approach

In other words, we’ll be swapping out population growth and the buying and selling houses to each other as our two main growth drivers for much more sustainable ones. That sounds like a good description of our plan.

But they aren’t changing the medium-term immigration targets at all (and various media report that the Prime Minister isn’t even keen on implementing Labour proposed changes re student and work visas),  and simply buying and selling houses has never, of itself, been a “growth driver”.

There is the beginning of an idea here, but sadly nothing in government policy –  as outlined so far – is likely to represent any sort of fix.  After all, a key thrust of government policy is to build lots more houses, and they plan to just keep on keeping on issuing 45000 residence approvals a year for people to settle in such a remote, unpropitious (from an economic perspective) location.  Perhaps worse still, they seem keen on continuing, and beefing-up, the previous government’s misguided approach of trying to steer migrants to places other than Auckland (which is, on my telling, to put the cart before the horse).

One gets to the end of the speech confident that the government knows how it wants to redistribute more/differently than what went before (much the same could be said of Phil Twyford’s housing speech yesterday), but without any sense of a compelling strategy that is likely to do anything to reverse New Zealand’s long-term economic underperformance, to fix those flawed fundamentals.  I hope they really care about fixing the fundamentals and are just keeping quiet because they don’t have any compelling ideas –  and aren’f finding them in The Treasury’s post-election advice.  I fear that, a bit like their predecessors, it is some mix of putting the problems in the too-hard basket, and of no longer really caring that much.

An underwhelming top 200

In last Friday’s Herald there was a weighty supplement headed “Dyanamic Business”, reporting/celebrating the results of the annual Deloitte Top 200 (companies that is) business awards.  It seemed to be an opportunity for mutual self-congratulation, bonhomie, and a bit of virtue-signalling thrown in as well (eg the MBIE-sponsored award for “diversity and inclusion”).  And a few oddities as well: the award for “excellence in governance” went to a company that is majority state-owned and subject to quite real moral hazard risks (see 2001), and I don’t suppose the Reserve Bank will have been best-pleased to see the chair of Westpac New Zealand Limited –  the subsidiary just last week subject to Reserve Bank sanctions for failures of governance –  as a runner-up the “Chairperson of the Year” stakes.

But what caught my eye flicking through the supplement was this table for the top 200 (non-financial) companies in New Zealand.

Annual % growth 2016/17
Revenue 4.3
Pre-tax profits -6.4
Tax paid 22.7
EBITDA 2.9
Assets -5.7
Equity 2.9

(Tax aside) those numbers didn’t look very impressive.  Total revenue was up 4.3 per cent (and the accompanying article says that in the previous year revenue actually fell).  Profits and total assets actually fell, and both EBITDA and total equity were up by 2.9 per cent.

And what happened to the whole economy?  The Top 200 numbers use the latest audited accounts of each company, so there is a mix of balance dates.   But in the year to June 2017 (the latest quarterly data we have), nominal GDP rose by 5.9 per cent.  The last annual national accounts came out late last week: on those numbers, nominal GDP has risen 6.2 per cent in the year to March 2017, and 5.1 per cent in the year to March 2016.   Against that backdrop, the performance of the top 200 companies was, if anything, surprisingly weak.

Big companies, in aggregate, doing less well than the economy as a whole needn’t be a concern.  It could, after all, be a sign of thrusting new companies surging ahead and displacing the tired old giants.  But there isn’t really much sign of that sort of process in at work in New Zealand –  see, for example, the tech sector.   And, of course, our overall per capita growth in real GDP (let alone productivity growth) has been pretty deeply underwhelming.

In a way, a simple list of the top 10 most profitable companies (dollar value of profits) is quite revealing:

Fonterra
Spark
Air NZ
Ryman Health
Kaingaroa Forest
Auckland Airport
Transpower
Z Energy
Meridian Energy
Mercury

Of those 10, we have four majority state-owned companies (one a natural monopoly), a chain of petrol stations, a property-boom play, and a co-op whose profits are largely driven by swings in global commodity prices.   There wasn’t much new or very dynamic about it.  In a way, the list of top 10 money-losing companies looks more interesting – in addition to Tasman Steel (No 1) and Kiwirail (No 2), it does feature Xero and Orion Health.

It is a very different list than, say, one of the top most profitable non-financials in the US, which does feature (relative) newcomers like Apple and Alphabet (Google) and where almost all the companies have a strong international focus.

I mentioned those new annual national accounts numbers.  No doubt I’ll be using the numbers in various posts in the next couple of months, but for now just a couple of charts.

I’ve noted in various recent posts the fall in the export share of GDP over recent years.  There was always the hope that some of that might have been revised away when the annual numbers were published.  But no.

X and M share of GDP

As a share of GDP, imports haven’t been lower since the depths of the recession in the year to March 1992.  Exports haven’t been lower, as a share of GDP, since the year to March 1976 –  more than 40 years ago.     There was, so it was claimed, a policy focus on increasing the outward orientation of the New Zealand economy.  If so, it failed.

And what of business investment as a share of GDP  (as previously, this is total gross fixed capital formation less government and residential investment)?

bus investment

It picked up a couple of years ago from recession-era lows, but has gone sideways since, and is nowhere the rates reached in the previous expansion.

When profit growth in our top 200 companies has been relatively subdued perhaps it shouldn’t be surprising that not very much business investment is occurring.   And those export/import numbers shown earlier strongly suggest that what business investment is occurring will have been disproportionately concentrated in the non-tradables bits of the economy, those that don’t (be definition) face much international competition.

Deloittes and the Herald might think this is a “dynamic economy” –  and I’m sure there are plenty of small exciting firms in it –  but once we stand back and look at the aggregate numbers the picture isn’t very encouraging at all.  If change is constant, the change here seems –  in aggregate –  to more akin to drifting slowly backwards.

That was the legacy of the now-departed National-led government.  That government’s policies were not, in relevant areas, materially different than those of the previous Labour-led government.    The worry now is whether there is any realistic basis for expecting something different, and better, from the new centre-left government.  At present, it isn’t obvious why the future should be any better than the performance over the last 20 years or so.


Committing pointless economic suicide?

There has been some silly nonsense published in various overseas publications about the change of government – all that on top of things like the Wall St Journal‘s weird pre-election suggestion that Jacinda Ardern was some sort of Trump-like figure.

I’ve written about some egregious examples of ill-informed commentary here.  There was, for example, Nick Cater’s piece in The Australian praising the reformist nature of the previous government, the outperformance of the New Zealand economy, and specifically John Key and Bill English who “stand as inspiration to the rest of the developed world in these anxious and volatile time”.  And then, more recently, there was the Washington Post column by an Auckland-based American lifestyle journalist who sought to convince his readers that the new government was controlled by the far-right.   It was a case, we were told, of “Ardern may be the public face, it’s the far right pulling the strings and continuing to hold the nation hostage”.

Sure we are small and remote and not of that much objective significance to the rest of the world.  But the scope for really badly-informed commentary is still a bit of a surprise: in both cases, it seemed,  involving the authors projecting onto New Zealand what they wanted to see, and causes they themselves wanted to champion (in Cater’s case, genuine reform from the centre-right government in Australia, and in Ben Mack’s case probably a desire for something well to the radical-left of what any party in Parliament stands for).

Another example of detached-from-reality commentary turned up yesterday on Forbes magazine’s website, by an American investment adviser/commentator named Jared Dillian.  I’d never heard of him before, but apparently he has a following in some circles, and is clearly willing to speak his mind.  By the look of his new article on New Zealand, doing a little basic research first might help though.

His article has a moderate enough headline, New Zealand, An Economic Success Story, Loses its Way.    In fact as a headline in 1960 it would have been spot-on.   Without the constraints of magazine editors, his message was then amped-up when he tweeted out the link to the article, under the heading “New Zealand commits pointless economic suicide”.

I probably wouldn’t have bothered writing about it, but TVNZ asked me to go on this morning and comment on it, and preparing for that involved reflecting a bit more (than the piece really deserved) on where he was wrong and why.

I suspect the author must have been raised on some mythology about the 1980s reforms, which (rightly) got a fair amount of attention internationally then and for a decade or more afterwards.

There is the gross caricature of the pre-1980s New Zealand economy for a start (“most of industry was nationalized”, “extraordinary levels of government debt” [well, not much more than half –  as a share of GDP –  current debt levels in the US]).   And then the claims about the subsequent period that are utterly detached from any sort of data: “New Zealand is a supply-side economic miracle”, “New Zealand enjoyed unprecedented economic growth”, “it became one of the richest countries in the world”.

All this in a country which over the last 30 years has had one of the lowest rates of productivity growth of any advanced country –  none at all in the last five years –  and which looks set to be overtaken by Turkey and such former communist states as the Czech Republic, Slovakia and Slovenia.   We’ve just drifted slowly further behind most of the rest of the advanced world.  Numbers of those leaving fluctuate cyclically, but over the post-reform decades we’ve had one of the largest cumulative outflows of our own people of any advanced country in modern times.

But what of the suicide note that Dillian appears to believe the new government’s policy agenda represents?

Top of his list is any changes to the Reserve Bank Act.  He is, clearly, a big fan of the Reserve Bank and of New Zealand’s lead role in introducing inflation targeting.  That’s fine, and reasonable people can differ on whether there is a strong case for change, and the extent to which possible changes (details yet unseen) might change substance (as distinct from appearance/style).   But Dillian apparently knows already.

At 4.6%, unemployment is already low, but she wants to take it well below four percent, for starters. She would rather that the central bank tolerate higher levels of inflation in order to get unemployment lower, risking all that the RBNZ has achieved over the years.

A bit of basic research would have told him that the government has repeatedly indicated that they will not be seeking to give the Reserve Bank a numerical unemployment target, and that they recognise that other structural measures are needed if unemployment is going to be sustainably lowered very much further.  And in his press conference a couple of weeks ago. Grant Spencer “acting Governor” of the Reserve Bank didn’t exactly seem to think the baby was about to get thrown out with the bathwater.  If he did think so he could easily have said; after all he is retiring in four months’ time.  And the Bank had one of their friendly foreign academics, on a retainer from the Bank, out making pretty reassuring noises the other day too.  As he points out, the rhetoric from the government talks of modelling the Reserve Bank’s goals on those used in Australia and the United States –  central banks which, mostly, behave much the same way our Reserve Bank does when it is following its current mandate.

It isn’t just goal changes that worry Mr Dillian.

She also wants to include an external committee in the RBNZ’s monetary policy decisions, which will certainly give the bank a more dovish tilt.

When central banks as diverse as those of the UK, Australia, Sweden, the United States, Israel and Norway include external members on their monetary policy decisionmaking committee, it is difficult to take seriously the suggestion that moving to such a committee will “certainly” make New Zealand monetary policy more “dovish”.   What it may, perhaps, do is reduce the risk of the sort of false starts we’ve twice had to put up with from successive Governors this decade.

Then there is the forthcoming legislative ban on non-resident non-citizens buying existing residential properties.

New Zealand has, by anyone’s measure, one of the biggest housing bubbles in the world. Banning foreign ownership of property sets the country up for a possible real estate crash.

Set aside for the moment the question of whether the market is a “bubble” (I don’t think so, on any reasonable measure) but somehow adopting the same policy as Australia has had for years is suddenly going to fix our housing market problems.  If only.

What of immigration?

Ardern also opposes high levels of immigration, along with her coalition partner, Winston Peters. It is set to drop dramatically. Immigration, especially skilled immigration, has been a big contributor to economic growth over the years.

Actually, the Labour Party policy, which will be the government’s immigration policy, does not change the number of non-citizens annually given the right to live here permanently by even one person: the target remains at 45000 per annum (or around thre times per capita the rate in the United States).  Official policy supports continued high rates of immigration.  On immigration, Winston Peters won nothing beyond the rather limited, one-off, changes that Labour has proposed.

But, yes, really rapid increases in the population, driven by net immigration numbers, have greatly boosted headline GDP over the last few years.  Meanwhile, per capita real GDP growth –  surely the metric that matters rather more –  has been pretty anaemic at best.  And –  have I mentioned it before? –  there has been no productivity growth at all in the last five years.

Dillian ends with two final predictions.   Having heralded our high rankings on some of the economic freedom indices, he now asserts that “New Zealand will probably lose its status as one of the most open, free economies in the world”.    Frankly, that seems pretty unlikely.  As I’ve shown previously, on the measure he appears to cite our score has been pretty flat for 20 years now, through the ebbs and flows of the policy changes put in place by both National-led and Labour-led centrist governments.

econ freedom

Perhaps this government will prove different, but on the evidence to date – the published policy programmes – there isn’t much sign of it.

And what of Dillian’s final prediction?

It seems likely that New Zealand will experience a recession during Ardern’s term.

As it is now seven years (or eight, depending on how you count these things) since the end of the last recession, any detached observer would have to think there is a non-trivial chance of a recession in the next three years.  Periods of expansion don’t typically die of exhaustion, but New Zealand has never gone 10 years without a recession of some sort or other (and although some Australians like to boast of their 25 year run, in fact even they have had an income recession in that time –  a sharp correction in the terms of trade in 2008 for example).   Our modern history is a small sample of events, but it wouldn’t be too surprising if something went wrong in the next few years.

Of course, most –  but not all –  of our recessions have had a significant international dimension to them.   And that is still probably our greatest area of vulnerability in the next few years –  some shock, or series of shocks, arising out of insufficiently-weighted (or priced) areas of vulnerability, accentuated by the fact that most other countries now have little room to use fiscal policy for counter-cyclical purposes and almost none to use monetary policy (most policy rates being very close to, or below, zero). When the next foreign recession hits it is going to be difficult for other countries’ authorities to respond effectively.

Could we mess things up ourselves?  It is always possible –  and monetary policy mistakes are among the possibilities –  but even if you think the new government’s policy platform will reduce potential growth (or potential productivity growth) and even if there is some sort of “winter of discontent” fall in confidence next year, it is difficult to see what in the current mix of proposed domestic policies would tip New Zealand into recession.   Lower headline GDP growth seems quite possible, but was also likely if the previous government had returned to office.

Dillian’s story seems to rest on the forthcoming “housing crash” and cuts to immigration.  But if net migration is a lot lower in the next few years than it has been in the last few that is most likely to be because the Australian economy –  our largest trading partner – is doing better.    Policy itself is designed to maintain a high average net inflow of non-citizen migrants (and is the poorer for that).  As for housing, unless/until land use laws are substantially liberalised, the idea of a crash in house prices is just a scary fairy tale –  and were land use laws to be substantially liberalised, it would be more likely to be a force for good –  including allowing some productivity gains – than one that would drag the economy down (tough as some of the redistributive consequences might be for some people).    Among our good fortunes is that if demand does look like weakening materially, the Reserve Bank still has a fair amount of room to cut interest rates –  not enough probably, but more than almost all other advanced countries.

All of which Mr Dillian could have found out with the slightest amount of digging.  If there is a “suicide” dimension to economic policy in New Zealand, it is the wilful blindness of successive governments led by both main parties, who keep on doing much the same stuff, and either believe they’ll get a different and better (productivity) result, or who just don’t care much anymore.

Looking for a successful outward-oriented economic strategy 

I could bore you with thoughts on (a) Supreme Court rulings on the duties of trustees to disclose material to members/beneficiaries, or (b) even more recondite rulings on severability (the conditions under which, having inserted an invalid and unenforceable provision into a deed, the discovery of that invalid provision invalidates (or not) the rest of the deed).  Doing so might help straighten out my thinking for a meeting this afternoon, but it would bore you witless.

Instead, I’ll just leave with a link to a piece I wrote that appeared on the New Zealand Centre for Political Research website over the weekend.

A month or so ago, on the day the new government was to be sworn in, I wrote a post here about the apparent tension between the government’s stated ambition to increase the outward-orientation of the New Zealand economy (including the appointment of a Minister for Export Growth) and various specific policies the new government seeemed committed to, which seemed likely to reduce exports as a share of GDP (all else equal).  In some cases, those policies represented overdue elimination of explicit or (more often) implicit subsidies.  In other cases, no doubt some sort of case could be made for each of the policies on their own merits.  Nonetheless, taken together they looked likely to continue to shrink the foreign trade share of the New Zealand economy (the actual outcome under the previous government, despite the regularly restated goal to substantially increase exports as a share of GDP.

In that earlier post, I included this chart, of exports and imports as a share of GDP, back to 1971/72.

trade shares

There are some data revisions due out later this week.  It would be very surprising if they changed the broad picture.  Foreign trade has been becoming less important as a share of New Zealand’s economy, even though every successful case of economic transformation I’m aware of has involved getting the preconditions right that result in more domestic firms successfully taking on the world market.

There are some unavoidable factors that explain a temporary diversion of resources towards the domestic economy: the repair and rebuild process after the Cantervury earthquakes being the most obvious. But the peak of that process has passed, and yet Treasury’s advice in the PREFU was that the downward trend (in exports/GDP) would continue.  The problems look structural.

A few days after that earlier post I was mildly encouraged to see references in the Speech from the Throne to the need to lift productivity in New Zealand.  Exports were highlighted in this paragraph

This means working smarter, with new technologies, reducing the export of raw commodities and adding more value in New Zealand. For example, by securing the supply for forestry processing, greater investment in fishing and aquaculture, increasing skills and training, and more research and development to add value to dairy and other products and to create new technologies.

I couldn’t track down old Speeches from the Throne, but it did strike me as the sort of stuff almost any government could have (and probably did) say for at least the last 50 years.   The previous government, for example, claimed to be keen on aquaculture, and removing regulatory roadblocks to it.  Forest processing as a big theme in the 1950s when the government led the formation of Tasman Pulp and Paper (and my old hometown of Kawerau).  And so on.

And yet, as the old line has it, if one does the same stuff over and over again, why would one expect a different result?  We’ve been drifting behind the rest of the advanced world –  and have had no productivity growth at all in the last five years –  and foreign trade as a share of GDP hasn’t been sustainably increased for 25 years now.

Muriel Newman, former ACT MP, at NZ CPR saw that earlier post and asked if I’d like to do something shorter, and a bit more policy-focused for their newsletter.    The result is here.

I noted that there are lots of things that could be dealt with to lift our economic performance

I hope that the new ministers are going to turn their minds pretty quickly to how they might achieve the sort of reorientation in the economy that their own campaign recognised is needed. Regional development funds aren’t likely to be the answer; in fact, over the last 15 years, “the regions” have generally done better than “the cities”.   Auckland has been the laggard (again in per capita terms).

There are plenty of things that could be done to lift the competitiveness of the New Zealand economy.  For example, we now have a company tax rate that is above that of the median OECD country.   Lower taxes on the returns to business investment are one of best ways of getting more such investment.   We also already have one of the highest minimum wages rate, relative to median incomes, of any OECD countries.  Reforming our land use and planning laws could markedly lower the cost of housing, and help ensure that people and businesses can locate in the best locations.

In response, Muriel Newman asked a bunch of other regulatory issues.  I noted that I agreed that there was plenty of room for improvement on many fronts

But it is worth remembering that things on the regulatory front are typically not worse here than in most other advanced countries (indeed, we often score a little better than average on summary measures).   There is a lot we could do to remove roadblocks in these areas, but if we are to understand why NZ has continued to do badly relative to other advanced countries, i think we need to focus on things that are different here than abroad.  As per the column, our company tax rate is now high, and our minimum wage is high (both relative to other OECD countries).  But we are also very remote, in an era when personal connections seem to matter more than ever, and we have an immigration policy that is very unusual by international standards.  Of other OECD countries, only Australia and Canada come close to our target inflow (and Israel will take any Jewis person who wants to come –  that is a different issue).

And to revert to the concluding paragraphs of the NZCPR article

Defenders of our very high target rate of immigration talk constantly about skill shortages.  But OECD data show that New Zealand workers are already among the most skilled around.  We don’t need more workers – skilled or otherwise.  In fact, because of how difficult it is to base internationally competitive businesses here, there is an almost irreconcilable tension between continuing to drive the population up, wanting to deal with the pressing environmental issues associated with natural resource exports, and still wanting First World living standards.  The best way to square the circle would be to cut back sharply on the target rates of non-citizen immigration.

There isn’t anything necessarily wrong, in principle, with a growing population.  But successive governments have been putting the cart before the horse – driving the population up in the idle hope that a bigger population might somehow spark higher productivity growth.  In a location that isn’t a natural home to lots of people, that was never very likely.  Instead, we need to focus instead on the able people we already have – and to heed the wisdom of the New Zealanders who’ve been leaving.   Without a change of course, we seem set to slowly drift ever further behind other advanced countries, increasingly unable to offer our people the world-leading living standards we once delivered and could, with the right policies, once again aspire to.

It is a shame that the new government shows no interest in tackling our anomalous, and deeply unfit-for–this-location, immigration policy (indeed, there are now reports they are in no hurry even to fix the manifest problems around student visas and associated work rights).  Unless they do so –  and in the process achieve a substantial sustained reduction in the real exchange rate –  it is very difficult to see a path through which the Minister for Export Growth will get to the end of his term and be able to point to a sustainable turnaround in performance, and a trajectory for exports (and imports) as a share of GDP that might offer some hope of New Zealand one day catching up with the rest of the advanced world again.

Competitiveness indicators well out of line

In my post yesterday, buried well down amid long and fairly geeky material, I showed this chart.

wages and nomina GDP phw an unadj.png

Using official SNZ data, it suggests that over the last 15 years or so nominal wage rates in New Zealand have risen materially faster than the income-generating capacity of the New Zealand economy (nominal GDP per hour worked –  a measure that takes account of the terms of trade).   Since a big part of what New Zealand firms are selling when they try to compete internationally is (the fruits of) New Zealand labour, it probably shouldn’t be too surprising that our tradables sector producers have been struggling. As a reminder, we’ve had no growth in (a proxy measures of) real tradables sector GDP since around 2000 –  two whole governments ago.

The OECD publishes a real exchange series, all the way back to 1970, using real unit labour cost data.  Unit labour costs are, in effect, wages adjusted for productivity growth.  The real exchange rate measures compares how our economy has done on this competitiveness measure.

OECD real ULC

(There are other real exchange rate measures in which the fine details are less stark, but the picture is very similar.)

Broadly speaking, our real exchange rate was trending gradually downwards for the first 30 years of the series.  And each trough was a bit lower than the one before it.  That was, more or less, what one might have expected.  New Zealand’s productivity performance had been lousy relative to those of other OECD countries, and countries with weak relative productivity performance should expect to experience a depreciating real exchange rate.   On one telling, the weaker exchange rate helps offset the disadvantage of the lagging productivity.  On another, given that tradables prices are set internationally, a country with a weak productivity growth performance will tend to have weaker (than other countries) non-tradables inflation.    Another way of expressing the real exchange rate is the price of non-tradables relative to the (internationally set) price of tradables.

But over the last 15 years or so, we’ve seen something quite different.  The real exchange rate isn’t trending downwards any longer.   In fact, there has been a really sharp increase.   Competitiveness, on this measure, has been severely impaired.

It is not as if, after all, productivity growth has suddenly accelerated in New Zealand relative to other advanced countries.  We’ve done no better than hold our own against the median of the older advanced economies, and we’ve been achieving much less productivity growth than, say, the former communist eastern and central European OECD countries.     But on this measure, the real exchange rate recently has been 40 per cent above the average level in the 1990s, and even higher than it was in the early 1970s.

But aren’t the terms of trade extraordinarily high too?  Well, in fact, no.     They’ve increased quite a lot in the last 15 years or so, but here is a chart showing the terms of trade back to 1914 (using the long-term historical research series on the SNZ website and, since 1987, official SNZ data).

TOT back to 1914

Current levels aren’t much different from the average level for the quarter-century after World War Two.

On this OECD measure, the real exchange rate is higher than it was in the early 1970s (the previous peak in the terms of trade).  But since then, productivity growth (real GDP per hour worked) is estimated to have been far less than the median advanced economy experienced over that period.  In other words, the median OECD country (those 22 for which the OECD has data for the whole period) managed productivity growth  of around 150 per cent over 1970 to 2015 (the most recent year for which there is data for all countries) and New Zealand managed productivity growth of only 75 per cent.  It would take almost a 50 per cent increase in New Zealand’s productivity –  all other countries showing no growth –  to recover the relative position we had in 1970.

Competitiveness is a really major issue for the New Zealand economy.  It isn’t so much of an issue for the firms that operate here now –  they’ve survived and adapted.  It is more about the firms that never started-up, or which started up and couldn’t make it, or which started, flourished and found that they could prosper rather better abroad.   As trade shares (of GDP) shrink, in many respects this is a de-globalising economy.

Which made it rather odd to hear the (economist purporting to be the) “acting Governor” of the Reserve Bank declare that he, and the Bank, were comfortable with the level of the real exchange rate after the recent 5 per cent fall.  He declared that the exchange rate was now close to “sustainable, fair value”.    Taking a real economic perspective, it is anything but.

Such imbalances don’t have anything much to do with monetary policy, but they are symptoms of policy failures that need addressing urgently if we are to finally begin to turn around many decades –  stretching back even 20 years before 1970 –  of sustained economic underperformance.


Some labour market statistics that really should be looked into

There was a curious line in the Labour-New Zealand First agreement, under “Economy”.

Review the official measures for unemployment to ensure they accurately reflect the workforce of the 21st century.

I wasn’t (and still am not) clear what the two parties had in mind.  It got some people rather hot and bothered, with suggestions of political interference to get numbers that happened to suit the government of the day.  That interpretation seemed pretty far-fetched.  Plenty of people –  politicians included –  have views on what Statistics New Zealand should collect and report data on.  And governments have to decide what to fund Statistics New Zealand for –  regional nominal GDP data got added to the mix a while ago, there are now weird (and intrusive) things like the General Social Survey, and on the other hand we still don’t have monthly CPI data, monthly industrial production data (in both cases, unlike almost every other advanced country) or quarterly income-based measures of GDP.   Rather rashly, governments and SNZ appear on course to degrade our travel and immigration data.

So I don’t have a problem if parties to a government want to have a look again at some or other area of our official statistics, and perhaps even get Treasury and MBIE to commission some expert or other to have a fresh look at indicators of unemployment etc.  I’d be even more pleased if such a review led to the allocation of a bit more money to Statistics New Zealand.  But I’m not sure there is much of a problem with the HLFS as it is, even if my confidence in the data have taken a bit of a dip since my household has been in the survey (over the last few quarters).   Oh, and when they made changes to the HLFS last year, and made no attempt to backdate the new employment and hours series, simply leaving a level shift in the official series that was a bit trying too (one always has to remember to make a rough and ready adjustment for the break – I almost forgot to in the charts below).

Is it a bit odd and arbitrary that the headline measure of unemployment doesn’t count you as unemployed if you managed one hour’s paid work in the survey week, even if that was the only hour you managed to get all quarter and you’d really like a 40 hour a week job?    Absolutely it is.    But so long as the headline unemployment measures are used either for cross-country comparisons, or for comparisons within New Zealand over time, precisely where one draws that (inevitably) arbitrary line won’t matter very much.  Other countries also calculate headline unemployment rates that way, and we’ve been using the HLFS since 1986.

It is more of a problem when complacent commentators misuse the measure to go on about how “unemployment” is “only” 4.6 per cent, as if all is rosy.   Of course, even a 5 per cent “true” unemployment rate would mean that over a 40 year working life, the typical person would be unemployed –  on the quite narrow definition –  for two years.  That is a large chunk of time, and (like me) probably few of those commentators ever spent any time unemployed on this measure.

But SNZ does now do quite a reasonable job of providing a richer array of data that enables users –  and media and other commentators –  to get a fuller picture of overall supply/demand imbalances in the labour market.  We have data on the people in part-time work who would like to work more hours.  And data on people who would like a job but have become discouraged by repeated failure, and have given up searching (to the definitions of the HLFS).  Outside the HLFS we have data on those on welfare benefits.  Now there is even an official underutilisation rate, which can also be compared across time and (with more difficulty) across countries.   At 11.8 per cent that is a pretty high number, and probably one that –  were it more widely known –  would trouble many people (as it does me).   These numbers tend not to matter much to macroeconomic commentators, focused mostly on cyclical fluctuations, since the various different series tend to move together and a demand for long-term time series drives people quickly back to the headline measure.  But it doesn’t make the other measures less valuable or important for other purposes.

It is meaningless to say that “the” unemployment rate is 4.6 per cent, but that would have been as true in 1997 as it is 2017.  Then again, it probably isn’t meaningless to say that all the measures of excess labor supply are higher than they were 10 years ago, a period over which demographic trends have probably been working to lower the long-run sustainable rate of unemployment (on whichever measure you choose).

Statistics New Zealand don’t seem any better informed about the review

[Labour market manager] Ramsay said Statistics NZ had no more information about the review apart from what was in the coalition agreement.

“Nothing at this point. No content at all.”

But if there are resources to spend on reviewing and improving labour market statistics, I’d be making a bid for something around wages data.

A repeated theme from the Labour Party during the election campaign was that wage growth has been slow, and that this needed to change.  When the Labour Party leader was, at times, challenged about this claim, her response was that people didn’t “feel” better off.    Now, I’m sure perceptions matter a lot in politics, but ideally perceptions –  and the policies of governments – will be informed and shaped by the data, rather than the other way round.

In a post a few months ago I illustrated, using national accounts data, that the labour share of income has been trending up in New Zealand over the last 15 years or so.  COE

Over that period, on official data, New Zealand’s experience has been quite different from that of the other Anglo countries (and much of the commentary we read is British or American).  Across the OECD as a whole, the labour share in the median country hasn’t changed in the last 15 years, and New Zealand has had one of the larger increases. [UPDATE: An interesting illustration of how different the Australian experience has been.]

One of the problems in making sense of what is going on is that (a) we don’t have a quarterly income-based measure of GDP, so we fall back on the published wages data, and (b) the published wages data are all over the place.

Still most widely quoted is the very-volatile Quarterly Employment Survey measure of average hourly wage rates, a measure that (by construction) is subject to compositional changes  (if, this quarter, lots more low-skilled get jobs, even at good wage rates for those jobs, average hourly wage rates will fall even though no one is earning less per hour than they were).

Then there is the Labour Cost Index (LCI) which doesn’t purport to be a series of wage rates, but rather a proxy for unit labour costs. In other words, it is an attempt to measure wages adjusted for changes in productivity etc.  It is a smooth series, and is given prominence by SNZ, but it tells us nothing at all about the growth in the hourly earnings of the people who are in employment (adjusted for changes in composition).

And then there is the Analytical Unadjusted Index.  Even the name would deter most casual users.  It is found buried among the Labour Cost Index series, and  –  at least on paper –  looks like the best series we have.  It is constructed from the raw wages data SNZ collects to generate the headline LCI series, and is constructed in a stratifed way, to eliminate (or minimise) distortions arising from compositional changes.

This is what inflation in the Analytical Unadjusted series looks like

analytical unadj nov 17

It is relatively smooth –  conforming to economists’ priors about how labour markets work –  and, of course, (nominal) wage inflation is much lower it was a decade ago.  (Remember that the tick up in the most recent quarter is the impact of the pay-equity settlement.)    Of course, CPI inflation is also a lot lower than it was then.

A couple of months ago, I did a post using the Analytical Unadjusted data, deflating it by core inflation and comparing it with growth in real GDP per hour worked.  Real wage inflation appeared to have been running well ahead of productivity growth (the latter, non-existent, in aggregate, for the last five years).

But in that chart, I didn’t take account of the terms of trade.  A higher terms of trade – and New Zealand’s have done quite well in the last 15 years or so –  lifts the incomes the economy can afford to pay.  A better way to look at things might be to compare nominal wage growth with growth in nominal GDP per hour worked.  There is a lot of short-term variability in nominal GDP growth –  as dairy and oil prices ebb and flow  – but if we look at cumulative growth over fairly long periods we might hope to find something interesting.  Over very long periods of time we might expect hourly wage rates to increase at around the rate of growth in nominal GDP per hour worked.

The Analytical Unadjusted data go back to mid 1990s for the whole economy, and to the late 1990s for the private sector.   Here is what the resulting chart looks like.  Both series –  wage rates and nominal GDP per hour worked – are indexed to 100 when the Analytical Unadjusted data start.  (Recall that we still only have q2 GDP data).   I’m showing the ratio of the two series: when the line is rising, wage rates are rising faster than nominal GDP per hour worked.

wages and nomina GDP phw an unadj.png

For the first seven or eight years, the chart looks much as you’d expect.    There is quarter to quarter volatility in GDP, which is reflected in the ratio, but broadly wages were rising at around the rate of growth of  nominal GDP per hour worked.  Wages outstripped nominal GDP growth in the late boom years –  even as the terms of trade were rising –  and have done so again, in the last five years.   Over the last 15 years, private sector wage rates –  on this measure –  have risen perhaps 12 per cent faster than growth in the value of nominal GDP per hour worked.  (And the tax switch in 2010 will have boosted nominal GDP, without any reason to expect it would change pre-tax wage rates. so the “true” increases in wages relative to underlying GDP is even larger than the chart suggests).

I find this picture plausible, and I think I can tell a sensible story about what might have been going on.  But before I tell that story, here’s an alternative chart.    The QES wages data go back further, to 1989.  And here is what the chart of QES ordinary time wages rates looks like relative to growth in nominal GDP per hour worked back to 1989.

wages and nom GDP QES

It is on exactly the same scale as the previous chart.  But on this measure, private sector wages have barely kept pace with nominal GDP per hour worked growth over almost 30 years now (and have been losing ground since end of the 1990s), while public sector wage rates have outperformed (but almost all the out-performance was in the 1990s, under those spendthrifts, Ruth Richardson and Jenny Shipley.

I just don’t believe that the QES picture is portraying an accurate picture of what has been going on in the labour market.  For a start, it is inconsistent with the national accounts (the labour income share chart, which suggests that something turned in labour’s favour 15 years or so ago).  And the labour income share chart looks more consistent with the stratifed Analytical Unadjusted based measure.

To be clear, I’m not suggesting that labour has done particularly well.  The productivity performance of the New Zealand economy has been pretty lousy –  especially in the last five years –  and the unexpected (and outside our control) improvement in the terms of trade only offsets a bit of that gap.   Absolute levels of nominal GDP per hour worked in New Zealand remain very low by advanced country standards and, thus, so do wage rates.   But given the relatively poor performance of the economy as a whole, labour hasn’t done badly at all.  If people have feelings about these things it doesn’t look as though they should be about evil capitalists (or evil governments) rapaciously transferring money to themselves or their rich mates.  Simply that poorly performing economies –  with little or no productivity growth –  shouldn’t expect much wage inflation.  If there is rage, it should be about successive governments of both parties that have done nothing to redress that failure.

There might still be some serious problems with the statistics.  But if the Analytical Unadjusted series is roughly right (even if not many commentators cite it), how might one explain what it shows?  My explanation is pretty simple: the (real) exchange rate, which stepped up sharply about 15 years ago and has never sustainably come down since.    When the exchange rate is high, firms in the tradables sectors make less money than they otherwise would have done.   The usual counter to that is that the terms of trade have risen.  But the increase in the real exchange rate has been considerably more than the higher terms of trade would warrant, and in any case much of the gains in the terms of trade have come in the form of lower real import prices, rather than higher real export prices.

And why has the exchange rate been so high?  Because the economy has been strongly skewed towards the non-tradables sector which –  by definition –  does not face the test of international competition.  Demand for labour in that sector has been strong, on average, over the last 15 years, and it is the non-tradables sector that has, in effect, set the marginal price for labour.  For those firms, in aggregate, the lack of productivity growth doesn’t matter much –  they pass costs on to customers.  But it matters a lot for tradables sector producers, who have to pay the market price for labour, with no ability to pass those costs on (while the exchange rate puts downward pressure on their overall returns).  Another definition of the real exchange rate is the price of non-tradables relative to those of tradables. Consistent with this sort of story, in per capita terms real tradables sector GDP peaked back in 2004 (levels that is, not growth rates).

Perhaps it isn’t the correct story. Perhaps there is some serious problem with the data.  But if the government is serious about the words in the Speech from the Throne

A shift is required to create a more productive economy

one (small) step towards getting there might be set out to resolve the puzzles, and apparent inconsistencies, in our labour market (wages) data.  At present though, the best-constructed series suggests a badly-unbalanced economy.  Workers haven’t done badly given the poor performance of the overall economy, but the foundations haven’t been laid for durable real income growth –  if anything, they’ve been progressively whittled away as the foreign trade share of the economy has eroded.


Why are NZ interest rates so persistently high (Part 2)?

In Friday’s post, I illustrated how persistent and large the gap between New Zealand long-term interest rates and those in other advanced countries has been (and remains).  The summary chart was this one

real NZ less G7

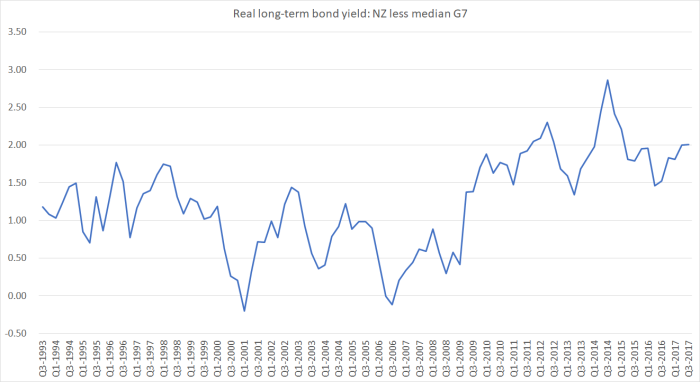
The gap is large and persistent whichever summary measure of other countries’ interest rates one looks at.

It is also there for short-term interest rates.  In this chart, I’ve shown average real short-term interest rates for the OECD monetary areas (17 countries with their own monetary policies, plus the euro-area) for the last 10 years, adjusting average nominal interest rates for average core inflation (the OECD reported measure of CPI inflation ex food and energy).

real short-term int rates oecd

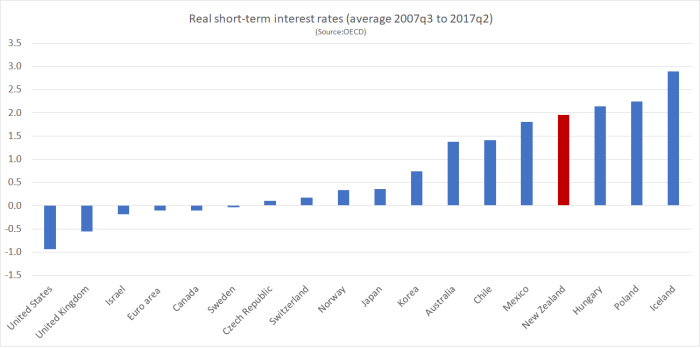
Of the countries to the right of the chart, Iceland and Hungary have had full-blown IMF crisis programmes in the last decade, and Mexico and Poland had precautionary programmes.  That isn’t meant to suggest that New Zealand is crisis-prone, just to highlight how anomalous our interest rates look relative to those of the other more-established advanced economies.

In yesterday’s post I reviewed some of the arguments sometimes advanced to explain why New Zealand interest rates have been persistently higher than those in other advanced countries.   As I noted, these factors don’t look like a material, or compelling, part of the story:

  • size (of the country),
  • (lack of) economic diversification
  • market liquidity,
  • creditworthiness,
  • accumulated external indebtedness,
  • unusually rapid productivity growth

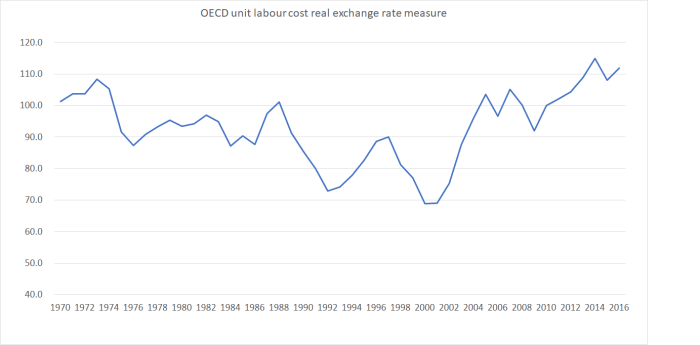
And, as I noted, none of those explanations has as a corollary a persistently strong real exchange rate.  A story that can make sense of New Zealand’s persistently high real interest rates needs to be able to make sense of the persistently strong exchange rate, and also of New Zealand’s persistently poor productivity performance.  As it is, in a country with a poor productivity performance and the disadvantages of remoteness, one might have expected to find persistently low interest rates and a persistently rather weak exchange rate.

At an economywide level, interest rates are about balancing the availability of resources with the calls on those resources.  In principle, they have almost nothing to do with central banks –  we had interest rates millennia before we had central banks.  They also don’t have anything necesssarily to do with “money”, except to the extent that money represents claims on real resources.

In any economy with lots of exceptionally attractive and profitable opportunities, firms will be wanting to do a lot of investment.  Resources used for investment today might well generate really strong returns in the future, but those resources can’t also be used for consumption (or producing consumption goods) today.  Interest rates play the role prices typically do –  acting as “rationing device”.  Higher interest rates today make some people willing to consume a bit less now, and they also help ensure that the only the investment projects with the higher expected returns go ahead.    In other words, interest rates help reconcile savings and investment plans.  (If they couldn’t adjust that way, the price level would do the adjustment –  and that is where central banks these days come in, adjusting the actual short-term interest rate to reconcile savings and investment plans while keeping inflation in check).

Sometimes the strong desire to undertake investment projects will be based on genuinely great new technologies.    Sometimes it might be just based on a pipe-dream (credit-fuelled commercial property development booms are often like that).   Sometimes, it will be based on direct government interventions (one could think of the Think Bg energy projects).  And sometimes, it will simply be based on rapid population growth –  people in advanced economies need lots of investment (houses, roads, shops, offices, schools etc).

Various factors can influence the desire to save.   If firms in your country have developed genuinely great new technologies, it may seem reasonable to expect the future incomes will be a lot higher than those today.  If so, it might be quite rational to spend heavily now in anticipation of those income gains (consumption-smoothing).  Some governments tend towards the spendthrift, and others towards the cautious end of the spectrum.  Tax and welfare rules might affect desire and willingness to save (although my reading of the evidence is that they affect more the vehicles through which people choose to save).   Demographics matter, and compulsion may also play a part.    Culture probably matters, although economists are often hesitant about relying on it as an explanation.  Business saving is often forgotten in these discussions, but can be a significant part of total savings.

But if, for whatever reason, people, firms and governments don’t have a strong desire/willingness to save at “the world interest rate”, then (all else equal) interest rates in your country will tend to be a bit higher than those in other countries.   And if firms, households and governments have a strong desire to invest (building capital assets) at “the world interest rate”, then (all else equal) interest rates in your country will also tend to be a bit higher than those in other countries.      Quite how much higher might well depend on how interest-sensitive that investment spending is (in aggregate).

Of course, we don’t get to observe actual supply curves for savings, or demand curves for investment.  We don’t know how much New Zealanders (or people in other countries) would choose to save or invest at “the world interest rate”.  Instead, we have to reason from what we do see –  actual investment (and its components) and actual savings.

Take savings rate first (and by “savings” here I mean national accounts measure –  in effect, the share of current income not consumed).  Net national savings rates in New Zealand have been similar, over the decades, to the median for the other (culturally similar) Anglo countries, but lower typically than in advanced (OECD) countries more generally.  Savings rates are somewhat cyclical, but as this chart illustrates, for some decades now they’ve cycled around a fairly stable mean (through big changes in eg tax policy, retirement income policy, fiscal policy, financial liberalisation etc).

net national savings.png

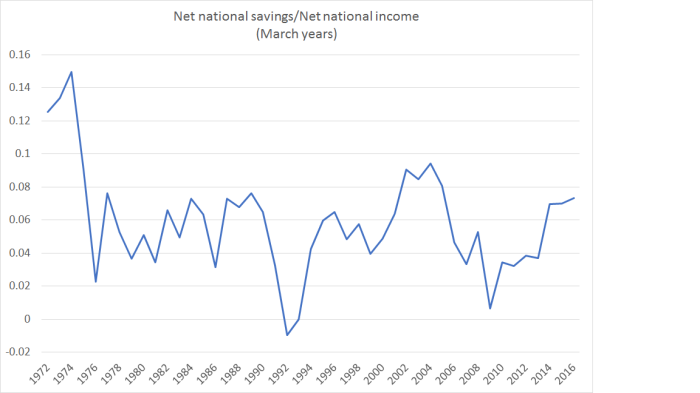
All else equal, if tomorrow we woke up and found that somehow New Zealanders had a much stronger desire to save then our interest rates would fall relative to those in the rest of the world.   But that is an illustrative thought-experiment only, not a basis for direct policy interventions.  A relatively low but stable trend savings rate over a long period of time –  especially against a backdrop of moderate government debt –  suggests something more akin to a established feature of New Zealand that policy advisers need to take account of.   A different New Zealand economy might well feature a higher national savings rate –  more successful firms, wanting to invest more heavily over time to pursue great profit opportunities, retaining more profits to reinvest –  but that would be an outcome of a transformed economic environment, not an input governments could or should directly engineer.   Higher saving rates are not, automatically, in and of themselves, “a good thing”.

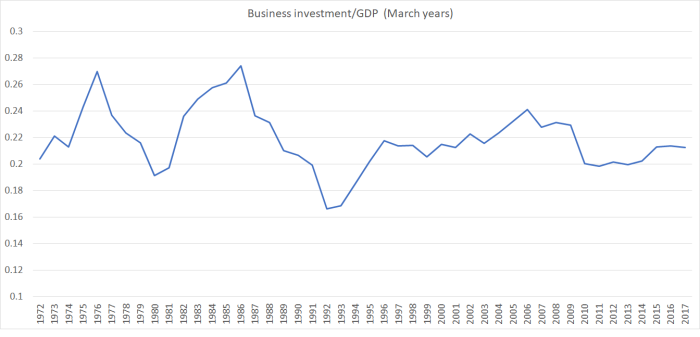
By the same token, if we all woke tomorrow and (collectively) wanted to build less physical capital (“invest less” in national accounts terminoloy), our interest rates would fall relative to those in the rest of the world.  Actually, that is roughly what happens in a recession: pressure on scarce resources eases and so do interest rates (central banks typically helping the process along).  But less (desired) investment is not, in and of itself, “a good thing”.   Nor, for that matter, is more investment automatically desirable – in the last 40 years, investment/GDP was at its highest in the Think Big construction phase.

Whether over the last 40 years, or just over the last decade, investment/GDP in New Zealand has been very close to that of the typical advanced country.  On IMF data, investment/GDP for 2007 to 2016 averaged 22.0 per cent in New Zealand, and the median advanced country had investment as a share of GDP of 22.1 per cent.

But these investment shares for New Zealand happened with (real) interest rates so much higher than those in the rest of the world.  As I noted earlier, we can’t directly observe how much investment firms, households and governments would want to have undertaken at the “world” real interest rate –  perhaps 150 basis points lower than we actually had.

We might, however, reasonably assume that desired investment would have been quite a bit higher than actual investment.  Both because some investment –  whether by firms, households or (more weakly) government –  is interest rate sensitive, and because we’ve had much more rapid population growth than the typical advanced economy.   In the last 10 years, the median advanced country has had 6 per cent population growth, and we’ve had 13 per cent growth in population.   More people need more houses, shops, offices, road, machines, factories, schools etc.    All else equal, with that much faster population growth we’d have expected more investment here (as a share of current output) than in the typical advanced economy.  But all else isn’t equal, because our interest rates are so much higher.   That population-driven additional demand is one of the reasons why interest rates have been so much higher than those abroad.  Combine it with a modest desired savings rate, and you have pretty much the whole story.

As I noted earlier, some investment is more readily deterred by higher interest rates than others (“more interest-elastic” in the jargon).    Most of government capital expenditure isn’t –  government capex disciplines are pretty weak, and if (say) there are more kids, there will, soon enough, be more schools.  And more people will mean more roads.  A lot of household investment isn’t very interest-sensitive either: everyone needs a roof over their head and (by and large) they get it.    With a higher population growth rate than other countries, on average we devote a larger share of real resources to building houses than other advanced countries typically do (albeit less than might occur with well-functioning land markets).  Business investment is another matter altogether.  Businesses only invest if they expect to make a dollar (after cost of capital) from doing so.  All else equal, increase the interest rate and less investment will occur.  That won’t apply to all sectors, because in the domestically-oriented bits of the economy not only are interest rates higher, but the underlying demand is higher (more people).  And so non-tradables sector investment probably isn’t very materially affected.  But for the bits of the economy exposed to international competition (whether exporting, competing with imports, or supplying firms that do one of those) it is a quite different story.  An increased population here doesn’t materially increased demand, and a higher cost of capital makes it harder to justify investment in the sector.

And all that is before even mentioning the exchange rate.

In an open economy, the floating exchange rate system is what allows countries to have different (risk-adjusted) nominal interest rates.  Without a floating exchange rate, higher interest rates here would offer a “free lunch”, and the interest rate differences wouldn’t last.   With a floating exchange rate, one can have differences in interest rates across countries, but the exchange rate adjusts such that, overall, expected returns are more or less equal across markets.  Higher interest rates here are, roughly speaking, offset by an implicit expectation that one day our exchange rate will fall quite a lot.  It appreciates upfront, to create room for that future depreciation.

The exchange rate, of course, also serves as a “rationing device”.    Some of the high domestic demand spills over into imports.  And the higher exchange rate makes exporting less profitable, all else equal.  And so when we have domestic pressures (savings/investment imbalances at “world” interest rates) that put upward pressure on our interest rates, not only is business investment in general squeezed, but the squeeze falls particularly on potential investment in the tradables sector.  Firms in (or servicing) that sector face a double-whammy: a higher cost of capital, from the higher real New Zealand interest rates, and lower expected revenues as a result of the higher exchange rate.

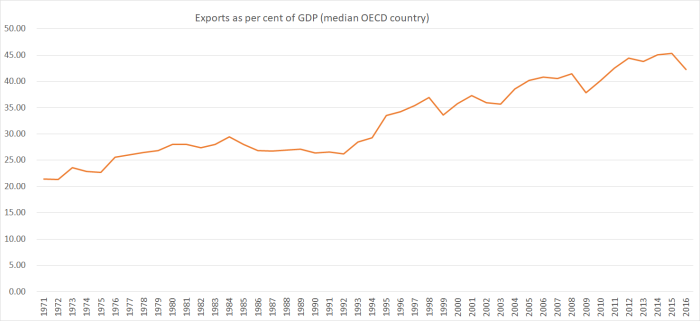
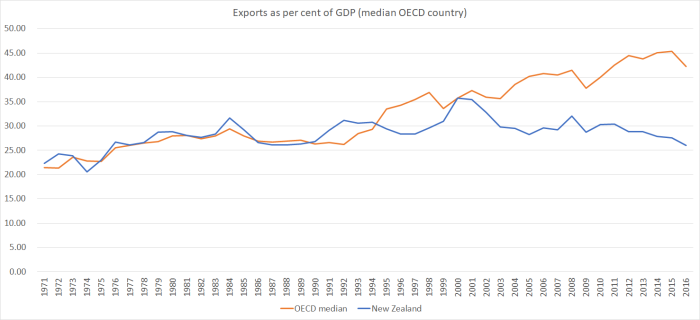
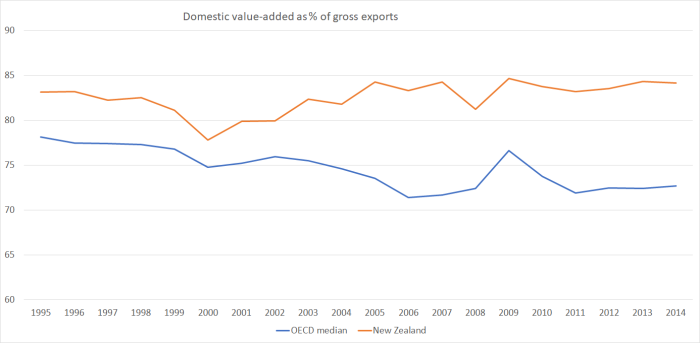
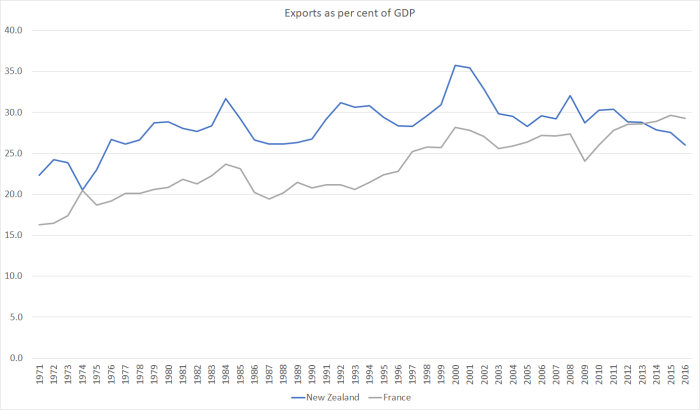
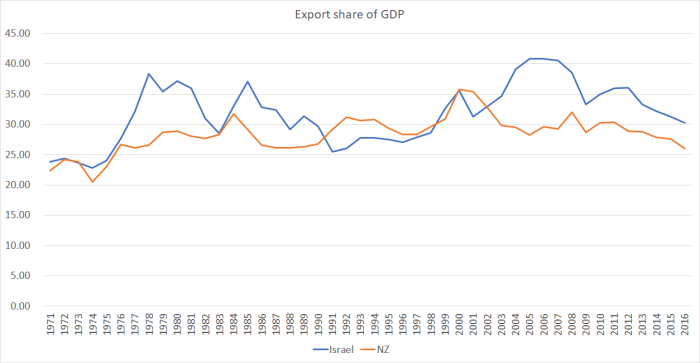
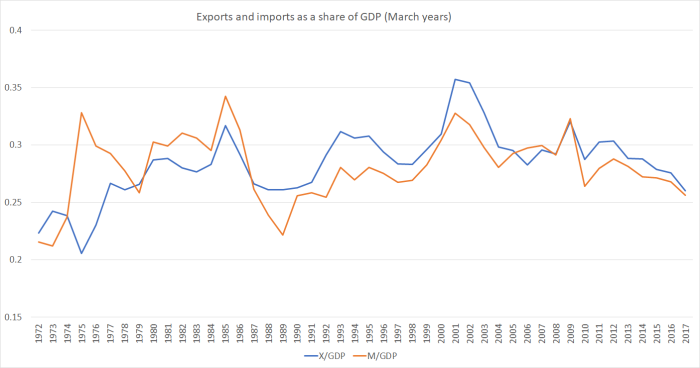
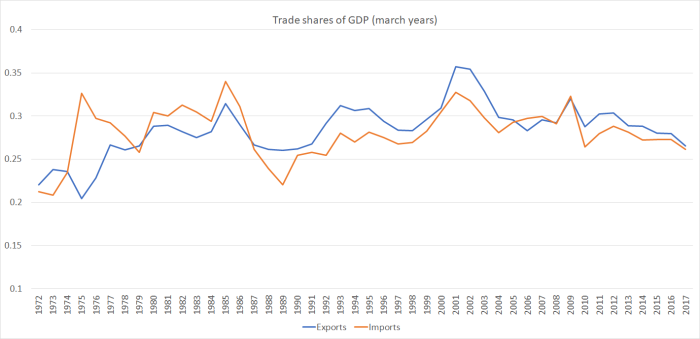
We don’t have good data on investment broken down between tradables and non-tradables sectors. But we do know that overall business investment as a share of GDP has been towards the lower quartile among OECD countries (whether one looks back one, two, three or four decades), even though we’ve had faster population growth than most.  We also know that there has been no growth at all in tradables sector real per capita GDP since around 2000, and we know that the export share of GDP has been flat for decades (even though in successful economies it tends to be rising).   Those stylised facts are strongly suggestive of a situation in which:

  • lots of government investment takes place (market disciplines are weak),
  • lots of houses get built (even if not enough –  because people need a roof over their heads),
  • a fair amount of investment occurs in the non-tradables sectors, despite the high interest rates, but
  • a great deal of potential investment in the tradables (and tradables servicing) sectors has been squeezed out.

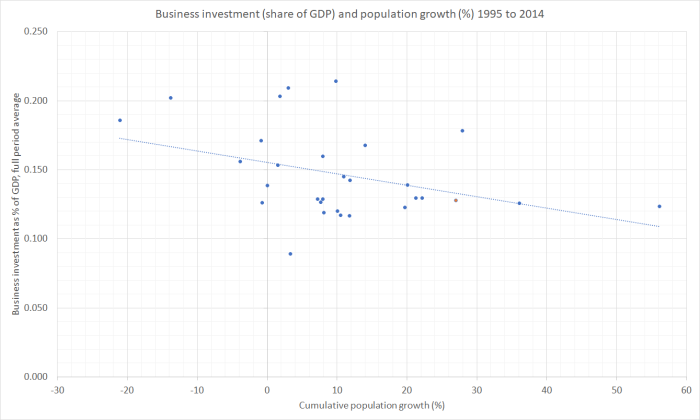
That is, roughly speaking, how we end up with rapid population growth and yet an investment share of GDP that is no different from that of a median advanced economy.  We know that population growth seems to adversely affect total business investment across the OECD (I ran this chart a few months ago)

Bus I % of GDP

And it is surely only commonsense to reason that tradables sector investment will have borne a lot more of the brunt than the non-tradables sectors.

I’m not getting into the details of immigration policy in this post.  Suffice to say that our immigration policy –  the number of non-citizens we allow to settle here –  is the single thing that has given New Zealand a population growth rate faster than that of the median OECD/advanced country in the last 25 years or so.  It is, solely, a policy choice.  Our birth rate is a little higher than that of the median advanced country, but we have a large trend/average outflow of New Zealanders.  So, on average, the choices of individual New Zealanders would have resulted in a below-average population growth rate (again, on average over several decades).  And that, in turn, would seem likely to have delivered us rather low real interest rates and a lower real exchange rate.  Real resources would have been less needed simply to meet the physical needs of a rising population, and more firms in the tradables sectors would have been able to have overcome the disadvantages of distance. And our productivity outcomes –  and material living standards – would, as a result, almost certainly have been better.

You can read about all this at greater length in a paper I did for a Reserve Bank and Treasury forum on the exchange rate and related issues back in 2013.