Once an export (and import) powerhouse

We’ve been having a bit of conversation at home – my son doing a NZ history paper at university and me reading yet another old book – about the line that pops up in almost any old book about the New Zealand economy, that New Zealand once (pre-war) had consistently the highest exports (and imports) per capita of any country.

It isn’t really a surprising statistic. All else equal, small countries tend to sell abroad a larger share of their output than large countries (there isn’t much market at home and the world, by contrast, is big). And rich and productive countries tend to do more per capita of every component of GDP. 80-100 years ago we were small and we were rich – on standard comparisons, inevitably limited as they are, among the two or three richest countries on the planet.

All else equal, we also know that countries that are more physically remote do less foreign trade than those that are close to others – one of the costs of distance. New Zealand was (of course) very distant, but so successful was this small country/economy that our exports/imports were very high anyway.

I’ve done posts here (eg here) in years past comparing exports as a share of GDP more recently, but this time I thought I might just do the same raw comparison the old books did and look at exports per capita (imports per capita on average over time will show very similar pictures). Since Covid and border closures messed up trade in foreign travel (in particular), here I’m showing 2019 numbers for OECD member countries (Luxembourg is literally off the scale, which I’ve truncated for better readability).

Not only are we nowhere near the top of the table, we are now quite near the bottom. All the countries below us are either (and mostly) much much bigger (even Australia has five times our population) or much much poorer (Colombia, Chile, Costa Rica, Mexico).

That chart is mostly for the simple comparison with decades past. These days, much more than in years past, gross export numbers for many countries – and especially those close to neighbours – include a large imported component. A car that counts as a German gross export will typically include a lot of value that was actually added in nearby countries (Poland, Slovakia). The OECD has collated data that adjust for this effect, calculating the extent of domestic value-added in a country’s gross exports. It takes time to get that data together, so the most recent numbers appear to be for 2018.

(And here I would ignore the Luxembourg numbers, because much Luxembourg economic activity uses a labour force that works but does not live in Luxembourg)

On this chart, New Zealand does better, being just above the median, but it shouldn’t be much consolation. The only one of the really rich and productive OECD countries to the left of us on the chart is the US, which has by far the biggest domestic market. Big countries all else equal will typically do less foreign trade per capita and as a share of GDP than small ones. There are small countries to the left of us (Portugal, Hungary, Lithuania, Slovakia, and Estonia), but if most of them have had more impressive productivity growth performances than New Zealand this century, that has only brought them to about New Zealand’s distinctly mediocre levels of average productivity.

By contrast, the small countries that now really count as OECD productivity success stories – Sweden, Belgium, Austria, Denmark, Iceland, Norway, Switzerland, Ireland, and Luxembourg – all export far more domestic value-added than New Zealand does. As far as we can tell, that wasn’t the case when New Zealand was once of the richest countries on the planet.

To be clear, exports aren’t good or superior for their own sake, but really successful small countries/economies tend to be ones with firms that successfully sell lots of stuff to the rest of the world (and enjoy the purchasing opportunities from the rest of the world – high exports and high imports tend over time to go hand in hand).

The previous National government sort of had some inkling of this. They articulated a goal of getting gross exports up to 40 per cent of GDP (actual now nearer 25 per cent), but had no real ideas about the sort of economic policy that might lead to such a more successful outward orientation. It isn’t obvious that the current government – or today’s National in opposition – either know or care.

Exporting: how does NZ compare?

In preparation for a meeting earlier this morning, I’d downloaded the OECD data on exports as a share of GDP. I thought it might be useful to share of a few of the charts. Most are updates of charts I’ve shown in years gone by, but it is good to be reminded of what has happened in New Zealand and how we compare with other OECD countries. In all the charts that follow I’ve excluded 2020 for two reasons: first, not all countries yet have data (at least in this database) and second, Covid, which affected individual countries quite differently and which should over time prove to be a blip. In all the charts other than the first I’ve shown data from 1995, which is when the OECD has complete data from.

Here, as context, is the New Zealand data since 1970. 1995 was not an outlier, high or low.

exports 1

Here is New Zealand relative to the median of all OECD countries (note that the OECD keeps doing its best to keep us near the more prosperous part of the OECD, by letting in new poorer countries: the latest country invited in (and now in the data) is Costa Rica).

exports 3

From the beginning of this chart, we’ve always exported a smaller share of GDP than then median OECD country has, and that gap has widened.

But, of course, one could expect the picture for other small countries to look different than one that included large countries. All else equal, large countries tend to do a smaller share of their GDP in foreign trade, just because there are relatively more opportunities at home (in the US, at one extreme, exports are equivalent to 12 per cent of GDP).

So in this chart I’ve shown (a) New Zealand, (b) the median for the G7 (larger) countries, and (c) the median for the small OECD countries (Belgium on down).

exports 4

And in this chart I’ve shown New Zealand against the small European countries (including Iceland).

exports 5

And New Zealand against the former Communist countries of eastern and central Europe, all small except Poland.

exports 6

These central and eastern European countries, all part of the EU, and often closely into supply chains for things like the German car industry, have been managed significant productivity growth, closing the gaps to some extent with the OECD leaders, over the last couple of decades.

There aren’t that many OECD countries that are both small and remote. In many respects both Iceland and Israel count, Costa Rica does, and so does New Zealand. Here are the records of those four countries.

exports 7

I’ve been increasingly intrigued by Israel which for all the reputation it has for high-tech industries, has done about as badly as New Zealand. Israel has a similar (modest) level of real GDP per hour worked to New Zealand and – coincidentally or not – has had very rapid population growth.

People are sometimes inclined to discount the central and east European story, noting (correctly) that the gross exports numbers used here don’t represent the extent of value-added in the respective economies, and thus may overstate the apparent success.

The OECD reports data on the extent of domestic value-added in gross exports, but only with a lag. The most recent data are for 2016 and that year two thirds of the exports of the median eastern/central European OECD member were domestic value-added, little changed over the previous decade. In New Zealand, by contrast, domestic value-added accounted for 87 per cent of total exports in 2016. The gap – between the export performance of New Zealand and that of the central and east European countries – is (very) real.

As I’ve said often here, exports are not uniquely special – indeed, I could have done the charts of imports and most of the pictures would have been quite similar – but that successful small economies (fast growing productivity growth ones) tend to be ones generating (or attracting) companies that find plenty of buyers for lots of their output abroad as well at home. That simply does not describe the New Zealand experience.

New Zealand: the foreign trade failure

To have listened to Winston Peters’ speech in Parliament the other day –  which wasn’t all as bad as the media reporting had led me to believe – or the joint Herald op-ed from the New Zealand, UK, Australian, and Singaporean trade ministers, you might have supposed that New Zealand’s was some great foreign trade “success story”.  I put it in quote marks because of course Winston Peters –  our Foreign Minister –  seems to want to undo some of that alleged “success”, seeking “far greater autonomy for New Zealand”.  Here is the full relevant quote

Now, New Zealand First is resolved that our future economy will have these features about it, because they’ve learnt something. One: far greater autonomy for New Zealand. In short, if we can grow it or make it at near competitive prices, then we will grow it or make it, use it or export it, rather than use valuable offshore funds importing it.

Some mix of mercantilism  (more exports good for their own sake) and insulationism (less international trade all round).

And here was a key quote from the article by David Parker and his peers

We are four independent trading nations who have derived success by operating globally. Almost two-thirds of Britain’s economy is made up of trade. One in five Australian jobs is trade related. In New Zealand that number is one in four. Nearly two-thirds of Singapore’s GDP is generated by external demand.

Success story? That would be the country that has spent 70 years slipping, sporadically but decisively (never really interrupted) down the OECD productivity league tables.  Productivity growth, after all, being the main basis for improved material living standards, and for many non-material options.

Here is foreign trade as a per cent of GDP (average of imports and exports) for each OECD country for the latest calendar year the OECD has data for (mostly 2019).

foreign trade as % of GDP

I use foreign trade (imports and exports) to make the point that, for a whole economy, we mostly export to import (some of vice versa as well).  But we are also fourth to bottom if one looks as exports alone.

Perhaps you think that doesn’t really matter much; after all, much richer Australia and the United States have lower trade shares than us.  Unfortunately for that story, larger countries tend to do a lot less foreign trade (as a share of GDP) than smaller ones –   there simply are lots more home markets for firms in the US – and even Australia has a population five times our size.

Ah, but we opened up our economy decades ago –  all that stuff Winston Peters lamented much of –  and we’ve signed all those trade agreements ministers and officials like to boast about.  Surely, then, we trade more heavily than we used to, surely we’ve improved our relative performance?

foreign trade since 1970

But no.    New Zealand’s foreign trade now is a bit less (share of GDP) than it was in 1980, and if we started behind the other small countries, we’ve lagged further behind, especially this century.

And since the OECD only has data for all countries since 1995 here is the NZ vs small countries comparison just since 1995.

foreign trade since 95

I suppose at least the gap hasn’t widened further in the last five or six years.

And then people (reasonably) point out that in some countries –  notably in Europe –  there is a lot of cross-border trade in partly-assembled products.  That is a plus for those countries, whose firms really can gain by specialisation in specific aspects of a production chain, but it does inflate the gross foreign trade numbers.

Fortunately, the OECD has developed indicators of the amount of domestic value-added in each country’s exports  (there is a range of other indicators in the value-added database as well, but here I’m just going to fall back on exports).  In some (particularly central European) countries only just over 50 per cent of gross exports represent domestic value-added.  In New Zealand (and Australia and the US) that share is close to 90 per cent.

So how does domestic value-added in exports look as a share of GDP across the OECD countries (these data are available only with quite a lag, so the latest numbers are for 2016)?

value added exports

It lifts New Zealand slightly up the league table, but all the countries below us have much larger populations –  and domestic markets –  than we do.  By contrast, all the countries to the right of the chart are small (or in the Dutch case just a bit above small).  And of the small countries – 12 million or fewer people (from where there is a step up to the Netherlands) our population is pretty close to the median.

dom value add and popn

It isn’t the tightest relationship in the world –  there is a lot else going on –  but the point that small countries tend to export (and import) more is pretty clear.  And New Zealand –  red dot –  stands out well below the line.

Our trade performance has been –  is –  woeful.  We simply don’t export (or import) much for a country as small as we are. In fact, not many countries –  even very large ones –  export/import less than we do as a share of GDP.

So the self-congratulatory lines that David Parker (and MFAT officials, and a succession of previous National trade ministers) run is deeply flawed.  But at least, in some sense, their hearts are in the right place, seeming to recognise that a more outward-oriented New Zealand is the only sustainable path to much greater prosperity.  From Winston Peters, on the other hand, the idea that we should be importing even less –  in a small country that already imports the fourth lowest share of GDP in the entire OECD –  is just headshakingly bad.

(If perhaps not quite as bad as Steve Keen who proposes that New Zealand and Australia are ideally placed to be some sort of long-term “trade bubble” –  doing as little as possible, even beyond Covid –  with the rest of the world, as if we’ll suddenly become a major market for coal, LNG, and iron ore and they will suddenly become a leading market for dairy, lamb, and export education.)


An intriguing possibility raised by the RB

I was chatting yesterday to someone about what might be in the Reserve Bank speech today on “The Global Economy and New Zealand” . I noted that whatever else the Assistant Governor might have to say we could be pretty confident that he would be repeating the line that changes in the world economy typically affect New Zealand trade – as a commodity exporter –  more through price changes (adjustments to the terms of trade) than through volume changes.  That is particularly so for dairy –  cows are still milked –  but it makes us somewhat different from economies whose external trade is heavily manufacturing in nature, often as part of multi-stage international supply chains.

Sure enough, there it was in the speech

When considering global influences on New Zealand exports, we have historically focused more on export prices than volumes.  This reflects that in the past New Zealand’s exports have been dominated by primary sector products whose production volumes are relatively insensitive to fluctuations in short-term demand.  Export prices tend to fall in tandem with the global economy—low global demand should lower prices. 

While waiting for the speech to be released I had been playing around with some numbers to illustrate the point, at least with reference to the last significant global downturn, the recession of 2008/09.   Here is a chart of the percentage change in the volume of goods exported from each OECD country from peak to trough over the 2007 to 2009 period (both peak and trough quarters differ from country to country).   Disruptions to trade finance was also a material factor in some countries during that particular period.

goods x 08

And here, by contrast, is much the same graph for the volume of services exports

services x 2008

Our services exports –  concentrated in discretionary items notably tourism and export education –  actually dropped slightly more than those of the median OECD country (as did that other commodity exporter Norway, and even Australia had a reasonably material fall in services exports).    Note how different the Japanese and New Zealand goods exports experience were but how similar the services exports outcomes.

To illustrate the price effect I’ve chosen to use the terms of trade rather than export prices.   Here is the peak to trough fall in the quarterly terms of trade for each OECD country over the 2007 to 2009 period,

TOT 08

Most of the countries with the largest falls in the terms of trade over this particular period were primarily commodity exporters.  But although our terms of trade did fall by more than the median country New Zealand’s fall was not that severe (much less so than Chile and Norway, or even Australia), and was slightly smaller than the fall Japan experienced.  (I suspect that if we could break out goods and services terms of trade separately, we might find that the services terms of trade improved (often happens, especially around tourism, when the exchange rate falls) while the goods terms of trade fell quite sharply.)

Some of these results will be idiodyncratic to the particular event, so I wouldn’t want to make too much of them, but the services chart in particular is a reminder that for some –  quiter labour-intensive – components of exports, the volume channel is just as important here as in many other advanced economies.

What of the Assistant Governor’s speech itself?    There wasn’t really that much there, and one can’t help suspecting that anything of interest was in the Q&A session afterwards, especially given the potential short-term disruptions from the coronavirus.  Recall that whereas the RBA makes available recordings of Q&A sessions after speeches by its senior managers, the Reserve Bank of New Zealand does not.  That is not very satisfactory.

I was, however, struck by a few errors and what looked like government-aligned spin.

Hawkesby asserted that 

Another development worth noting is the increasingly diverse nature of our exports, with the growing importance of our service exports and the growth in the technology sector.

Well, here is the data from the latest annual national accounts

services x annual

As a share of GDP, services exports peaked in the year to March 2003, almost 17 years ago now.  Even over the last few years, there has been a slight shrinkage.  Who knows what the Reserve Bank had in mind, but these are the official data.

Oh, and then there was the misleading statistic that will not die, because it keeps getting run out by ministers, industry advocates, journalists (who perhaps know no better), and now (apparently) the Reserve Bank.  

While our exports are still dominated by primary goods and tourism, technology is now New Zealand’s third largest export sector, with exports growing 11% to $8b 

There is a footnote on that statistic to the TIN Report.  But even the TIN people will concede, if you dig deep enough in their reports, that this simply isn’t an apples for apples comparison. It might be quite interesting to know how much New Zealand owned companies sell globally, but that is quite different matter/statistic from New Zealand exports (which are about production here, whether by foreign or domestic-owned companies).    I highlighted some of the problems in this tech story in a post a couple of years ago (when the underlying picture didn’t look flattering at all). I don’t expect the Reserve Bank to read my posts, but I do expect the Assistant Governor for economics to know what exports actually are.    As it is, his is an apples and oranges “comparison”.

In fact, if he’d wanted to give his audience a fairer picture of New Zealand the global economy he might have mentioned that overall exports as a share of GDP are weak (well below peak, well below what one might expect for a country our size) and that tradables sector output has long been similarly subdued.

And then there was the final piece of spin

Climate change is also likely to impact New Zealand’s economy in a number of ways in the future.  Growing environmental regulation of the primary sector, for example, could result in an acceleration in the diversification of our export industries.  

No doubt that final sentence is some part of the story, but it seems to rather ignore the main event: whether or not one agrees with policies the government is adopting in this area, the overall effect seems more likely to be a shrinkage in the path of primary sector production, at least relative to the counterfactual.  But I guess the Governor and the government wouldn’t have been too keen on him mentioning that.    (I’m not really suggesting he should have –  these long-term issues don’t have anything much to do with the Reserve Bank, but playing parts of the story that suit political masters wasn’t necessary either.)

But then on the final page there was another longer-term reflection that caught my eye

There are uncertainties, for example, about the future openness of international trade and labour markets.  There has been a growing geopolitical trend globally towards protectionism and lower migration.  Rising global protectionism could reduce our export opportunities and lower migration into New Zealand could dampen our growth, but might spur investments in domestic productivity.

I’m not sure that second sentence is empirically well-supported, at least as regards the migration bit.   I’m curious which countries the Assistant Governor has in mind, and noted only the other day achart highlighting the significant increase in work visas being granted in the US in recent years (and governments in other big recipient countries, notably Canada, Australia, New Zealand and Israel, don’t show much/any sign of reduced enthusiasm for immigration).  But what interested me was the final sentence and the suggestion that (structurally?) lower migration to New Zealand “might spur investments in domestic productivity”.   I think so –  it is a key element in my story, about reducing pressure on the real exchange rate, narrowing the gap between New Zealand and world real interest rates, reducing the need to focus investment (including public) simply on keeping up with population growth – but was (pleasantly) surprised to see the Reserve Bank saying so.  Intriguing, to say the least.

Perhaps unsurprisingly, there was only passing mention in the speech –  no doubt mostly finalised last week – of the coronavirus.  There was a reference to the SARS experience providing some possible parallels –  at least if the virus ends up being contained.  But it is worth remembering that the PRC is a much larger share of the global economy than it and/or Hong Kong were in 2003, that the shutdowns already seem much more extensive than happened then, and that tourism from the PRC –  almost entirely a discretionary item, much already interrupted by the PRC –  is a much more important share of the New Zealand economy than it was then.   And in 2003 SARS was one of the factors the Bank cited to justify cutting the OCR that year.

Services exports – another NZ weak spot

Various people in my Twitter feed were highlighting what appears to have been a quite interesting conference in Auckland over the weekend on external-trade related issues. I haven’t seen the papers, but at least from the various tweets I saw I was struck by an apparent air of unrealism, that doesn’t take much account of just how poorly New Zealand has been doing on the foreign trade front.  It is a bit like when MFAT and Cabinet ministers talk up this, that or the other new preferential trade agreement –  there have been a lot of them over the years – and yet we find ourselves now with foreign trade shares of GDP no higher than they were in (say) the early 1980s.   For younger readers, those were widely perceived at the time as dark days –  lots of import protectionism, terms of trade very low, CER not yet signed, and so on.

Services in one of those areas that trade experts seem to like to talk about, a lot.  Here was an MFAT tweet from the weekend conference.

In a way that isn’t surprising.  In the median OECD country, services exports are almost 13 per cent of GDP, and the median increase in that share over the last couple of decades is about 4 percentage points.

But not in New Zealand.

Among the full group of 35 OECD countries, New Zealand has the 10th lowest share of services exports as a share of GDP.   But every single one of the other nine are countries that are far bigger than New Zealand: Australia, with almost five times our population is the next smallest.  For good and fairly obvious reasons, foreign trade tends to make up a smaller share of GDP in larger countries.

But what about the smaller OECD countries?  Almost two-thirds of OECD countries have populations of 11 million or less, and we are by no means the smallest of those countries.   Here are services exports as a share of GDP for the smaller OECD countries, truncating the vertical axis because Ireland and Luxembourg are so much higher than all the other countries on the chart.

services exports small OECD

New Zealand has the smallest share of services exports in GDP of all these smallish OECD countries –  and by quite a margin.       And it isn’t as if we are closing the gap.   Over the last 20 years, services exports as a share of GDP have barely changed in New Zealand (with some ups and downs) while for the median of the other smallish OECD countries, the increase was 6.7 percentage points of GDP.

NZ services exports

Now, of course, distance materially and fairly obviously affects quite a lot of what counts as services exports –  notably, our two largest classes of services exports, tourism and export education.

Here is a long-term chart showing all our travel and transportation exports (which includes freight and export education).

T&T services X

The picture looked quite promising 20 years ago.  Much less so now.

And, on the other hand, here are all the non-travel and transport services exports.   These, in principle, should have been where much hope was reposed.

non T&T services X

It is, perhaps, a more positive story, but not very much so.   After all, despite all the technological advances, and cheaper and better communications etc, this group of services exports is still (in gross terms) less than 2 per cent of GDP, and no higher as a share of GDP than was the case at the turn of the century.    As a share of total exports these (non travel and transport) services exports have risen a bit more, but even that increase isn’t particularly impressive, as there has been no growth in these services exports as a share of total exports this decade.

Out of interest, here is the export education component of services exports as a share of GDP.

X education

Ups and downs but –  even with all the subsidies to this sector (mainly through the immigration system) –  still now below the levels reached in 2004.    And it isn’t as if our universities are relentlessly climbing the global ladder, suggesting that fresh waves of new exports –  attracted by the quality of the product – are likely from this source.

Now, as experts like to point out, there is a services component in all or most goods exports too.  But (a) it isn’t as if New Zealand has been doing well with goods exports and (b) the overall character of our goods exports hasn’t been changing much either (eg lots of fancy manufactured products with a huge design or IP component).

For all the talk, services exports –  including the higher-tech ones people like to talk about in such seminars –  just haven’t done particularly well in New Zealand.

That doesn’t surprise me.   The combination of a persistently high real exchange rate –  direct consequence of other policy choices –  and the continuing constraints of distance (even for many of what may look like “push a button and it is done” services) seem to me to pretty much explain the story.  New Zealand is just not a great location to base many outward-oriented businesses, even as our governments pursue more and more people to live here.   It shouldn’t be surprising that the relative size of the tradables sector in New Zealand has been shrinking.

On such matters, I saw that in advance of the weekend workshop/conference, the Herald the other day had a full page profile of MFAT’s leading trade official, deputy secretary Vangelis Vitalis.     Rereading that piece, and exchanging notes with someone over the weekend about public sector senior appointments and our new Secretary to the Treasury, I was left wondering why Vangelis Vitalis wasn’t appointed to fill the role.  His is an enormously impressive and energetic guy, he knows New Zealand (and is a New Zealander), is open-minded and engaging, and thinks about economic issues and risks.    Perhaps he didn’t apply.  Or perhaps he just doesn’t fit the Peter Hughes model of safe generic public sector managers.  But it does seem extraordinary that the powers that be would pass over –  rather than, say, shoulder-tap –  such a significant economic and policy talent right here among us, already in officialdom.  You can negotiate all the preferential trade agreements in the world, and it won’t matter much for economic performance –  lacklustre for decades –  unless you get to the heart of the underlying problem.


The Government’s Industry Strategy

When I heard yesterday that the now-former Economic Development minister David Parker had made an encore appearance to launch something called “From the Knowledge Wave to the Digital Age”, I wondered why he would want to remind anyone of the Knowledge Wave, a conference held under the previous Labour government in late 2001. Of course, my impression of that event was somewhat jaundiced by the fact that my boss, then-Governor of the Reserve Bank Don Brash, had made a “courageous” and somewhat ill-judged speech at the conference –  against the advice of many of his senior staff, at least as to content – that with hindsight could have been read as an audition for his post-Bank forays with the ACT and National parties (although I’m 100 per cent sure it wasn’t intended that way).

But the bigger problem is that, for all the talk, all the ink spilled, at that conference and through the subsequent Growth and Innovation Framework nothing much changed for the better.  The productivity gaps (New Zealand vs other advanced countries) didn’t start to close, the economy didn’t become more foreign trade (outwards and inwards) oriented, there were no fresh waves of greenfields FDI.   Instead, we had a reasonably strong cyclical upswing (rapid house price inflation, general inflation showing signs of getting away)…..followed by a nasty recession and a sluggish subsequent decade.

David Parker gave a speech at the launch of what is supposed to be “the Government’s Industry Strategy”, and that is going to be my focus here.  I haven’t read the full 50 page document, but I’ve skimmed through it and will include a few observations drawn from that.

Perhaps how people react to “Industry Strategy”  is one of the ways one tells them apart.  I was a bureaucrat for a long time  (but in the era in which the Reserve Bank believed in letting markets work and eschewed direct government interventions as much as possible), but when I hear the words “Industry Strategy” my heart does not leap with excitement, rather I think of the Soviet Union, the eastern-bloc, the People’s Republic of China (that not-overly-productive middle income country), or even –  more mundanely –  New Zealand’s own past failures in this regard: plans and conferences and strategies, often with little to show for it (when we are fortunate) but often enough with white elephants to mark the landscape, or memories of money just poured down the drain.  But I guess it is different in today’s Labour Party, or in today’s MBIE –  the modern version of the Department of Industries and Commerce (too many in the National Party seem to have had the same inclinations).   The government has a plan, a strategy –  or a whole series of them –  not for the economy as a whole (getting the basic structures right etc) but for individual industries.  And, with little accountability and no market discipline at all, they are keen to use your money and mine to back those strategies, boldly going where private investors have, thus far, decided not to.

As often with David Parker, there are sometimes glimpses of recognition of real problems.

I believe there is no doubt we inherited an economy based on excessive property speculation and high rates of immigration driving consumption led growth. The latest OECD report on New Zealand confirms this.

The infrastructure deficit left behind – not just schools, hospital, roads and public transport, but also private and public housing – will take a decade to catch up.

This is serious, but the adverse effect on productive investment was also profound.

Low per capita investment in our productive businesses has inhibited the diffusion of technology, and the development of innovative new products and services.

I wouldn’t frame some of it quite that way (notably that Labour trope about “excessive property speculation”) but, broadly speaking, he isn’t wrong.   Perhaps a shame there is no mention of the real exchange rate, at all, but it isn’t nothing.

The problem is, though, that this is buried deep in a speech which is mostly full of breathless energetic accounts of great things already done and great stuff the government (and industry) are about to do.

The flip side of the enormity of the 4th industrial revolution on the future of work, is the correspondingly huge potential for business.
It is an exciting time.
A myriad of new ways of new products and services are being made possible.
Most improve productivity.
Many are needed to decarbonise the world to avoid catastrophic climate change, or to combat pollution of our rivers and oceans. Others will overcome debilitating disease, improving the lives of millions.
I believe that it is the duty of every government to address both the future of work, and to maximise the up-side by chasing down as many of these commercial opportunities as we can, so as to harness the new jobs and value.

(I’m still old-school enough to think of outrages when I see the word “enormity” but let that pass).

Notice that second to last line, it is the “duty” of governments to “chase down” commercial opportunities.   In part, presumably, because in the Minister’s view it is all some sort of zero-sum game.

It is a race. Others want the prizes that we seek. 

Which isn’t the way most economists think of economic growth and development, perhaps especially not in a country that start so far behind the global productivity frontiers.

And then it just becomes completely delusional

Since the 1970s successive governments have wrestled with our productivity challenges; how we add value, upskill and diversify our economy.

We should acknowledge the important milestones and efforts of yesteryear.

They show that when we together have a plan and chart a direction, our economy strides forward.

To repeat, there is no time in the last 46 years –  say, since the UK entered the EEC (the Minister’s reference point) –  when New Zealand has made any sustained progress in closing the productivity gaps to the other advanced economies.  Instead, as I illustrated in Monday’s post, they’ve kept on widening.  They are widening now, after five years –  both governments –  of no productivity growth.

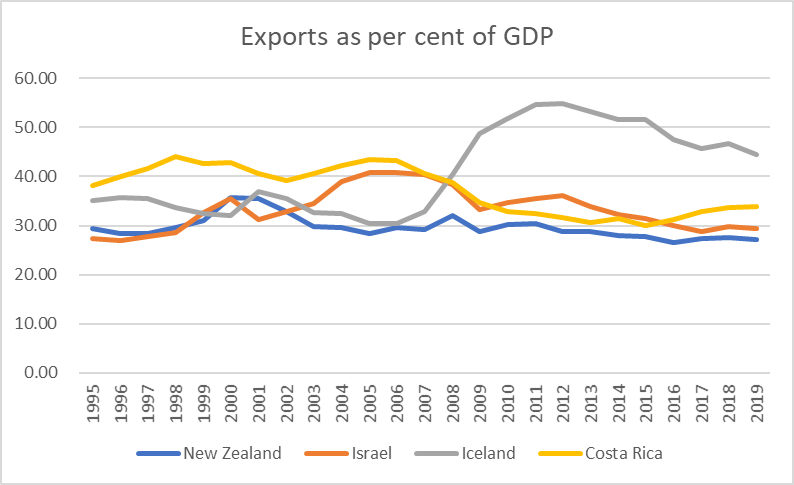
Of course, the officials themselves know this –  even if they squirm in their chairs  –  and, to his credit, Parker didn’t stop them including this chart in the fuller document.

MFP parker

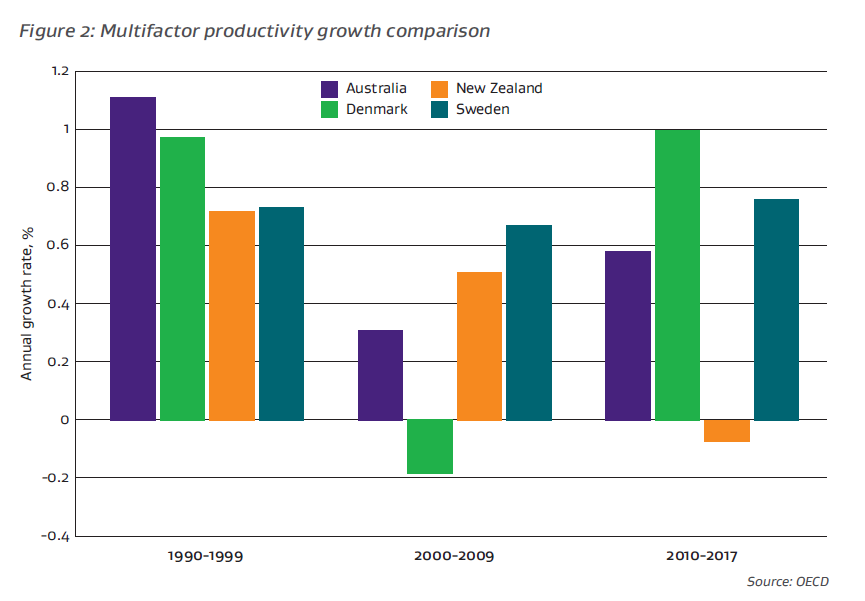
It isn’t the chart I’d have chosen myself, but it makes the point nonetheless.  And recall that all three of these countries were already materially richer, with higher levels of labour productivity in New Zealand, back in 1990.

In fairness, the Minister does have a place for the private sector

Government can direct investment towards the regions, and champion sectors where we see a comparative advantage, but it is the mobilisation of the private sector which delivers the jobs the big gains.

Better if they just left aside the picking winners –  or even propping up losers –  implicit in the first half of the sentence.

And this is where the Minister praises the Knowledge Wave and the Growth and Innovation Framework, going on to note

Our predecessors identified three priority areas. These were chosen because of their potential for export growth and because of the underlying importance that competence in the sector had to the wider economy. Spillover benefits.

The crucial sectors identified were ICT, biotechnology (with a food and beverage bent) and, thirdly, the creative sector and design.

They got it right and I am pleased to doff my cap to those who called it at the time.

Not that reference to export growth.   We get this guff

Our telco competence is a considerable achievement, and a prerequisite to the development of Xero, Vista, Coretex and a myriad of other companies that sell software as a service, which have flourished.

And the other sectors have boomed too.

Fisher and Paykel Healthcare. A2 Milk and a range of other food and beverage companies. Weta Workshops and its spinoffs. Now household names. Billions of dollars in enterprises that have helped build our country.

The Growth and Innovation framework is the GIF that keeps on giving. Computer gaming, robotics, customer service avatars, nutrient monitoring software.

The race is on.

Our TIN200 companies are growing strongly, with technology exports now our third largest export sector (after tourism and agriculture). New hires abroad as well as export sales growth are described in the TIN200 report on the table.

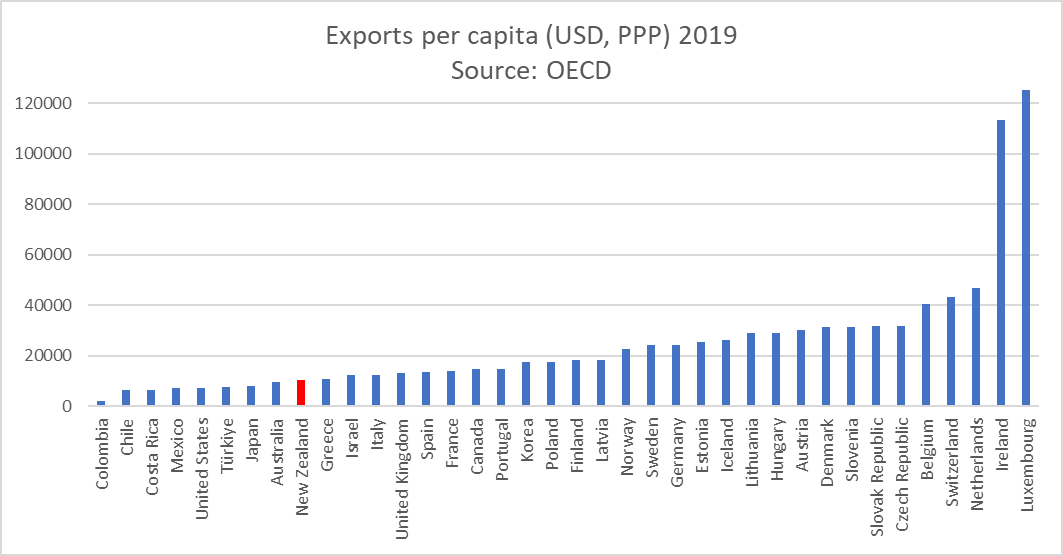
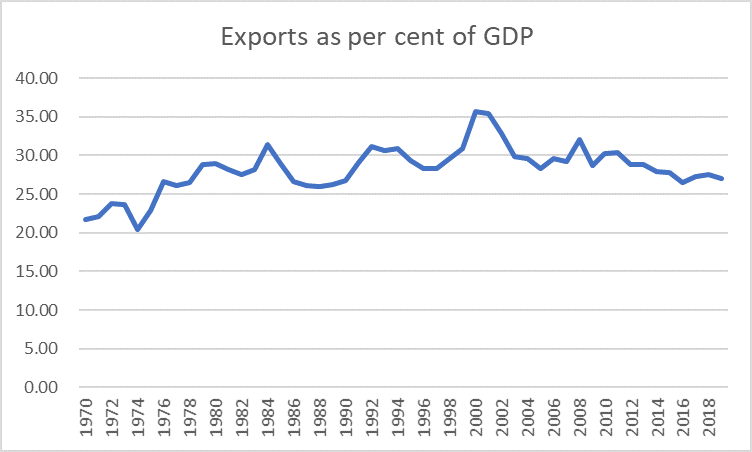
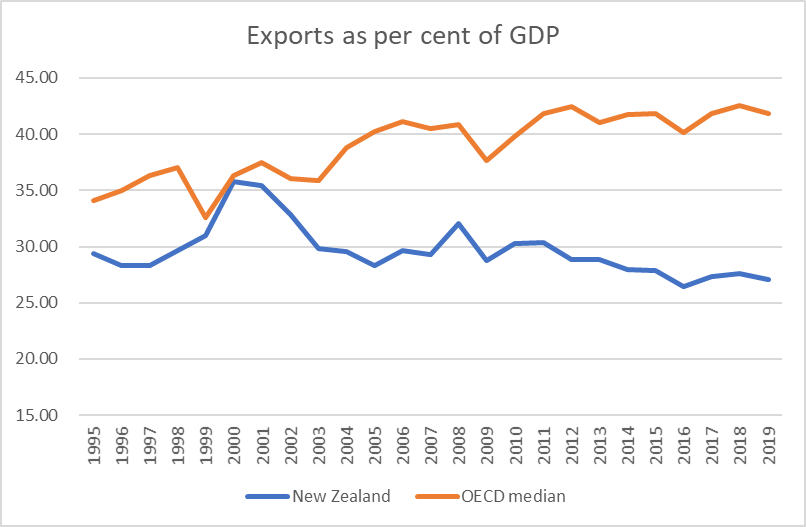
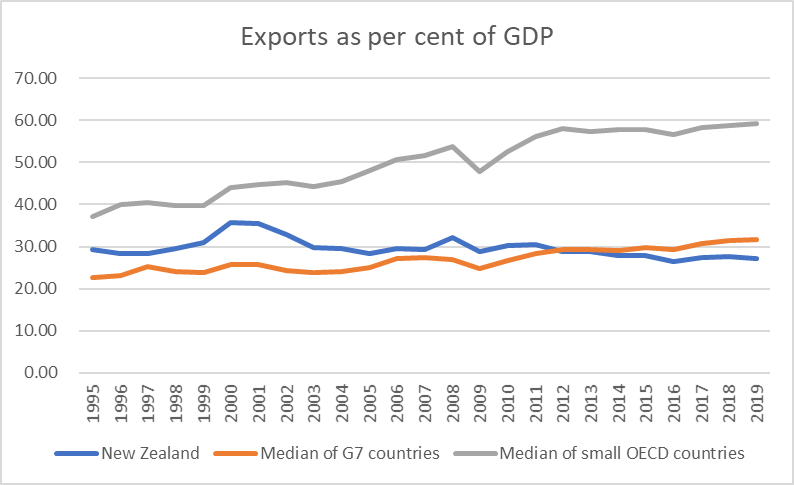
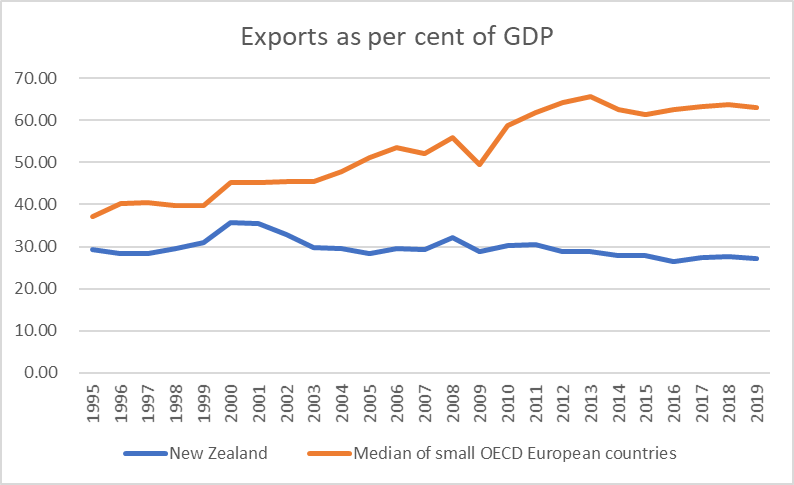
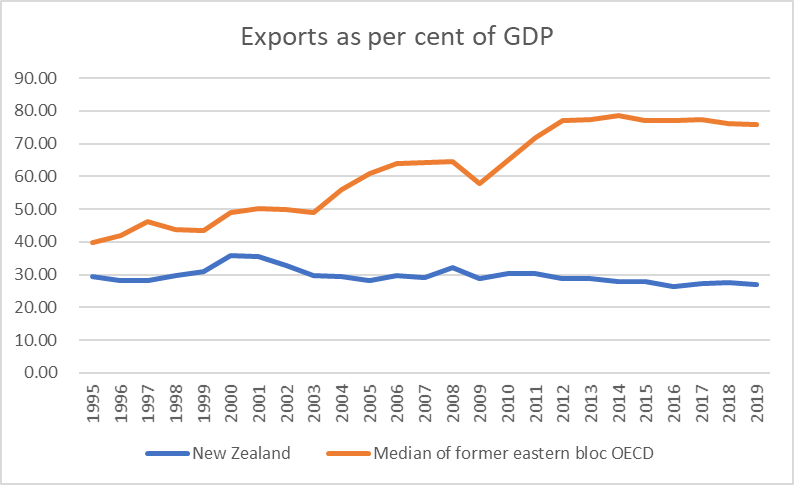
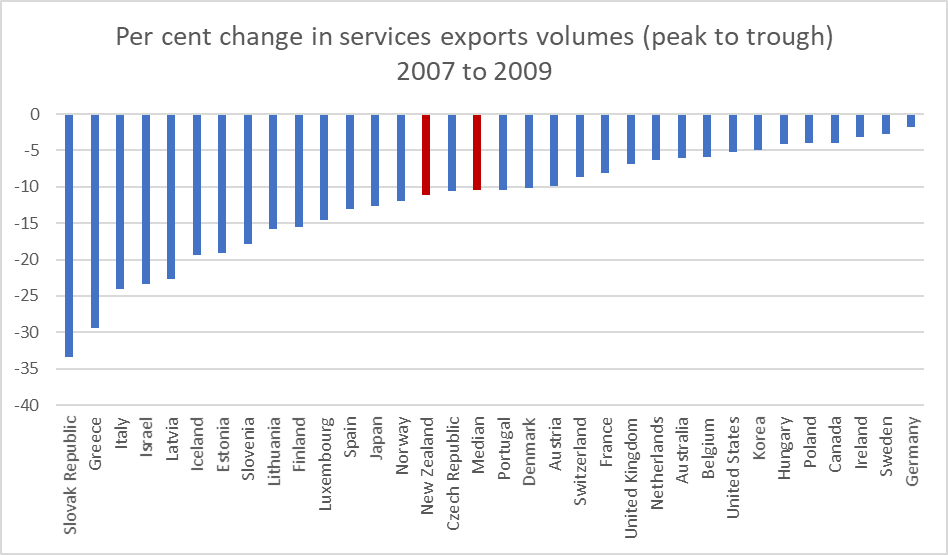
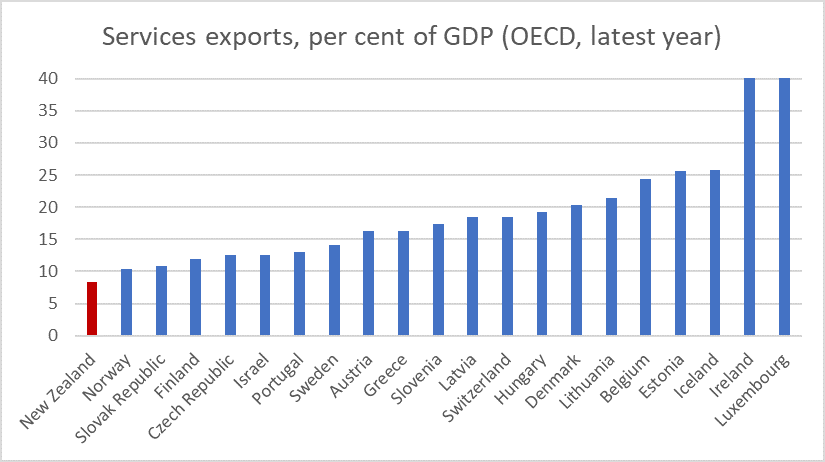
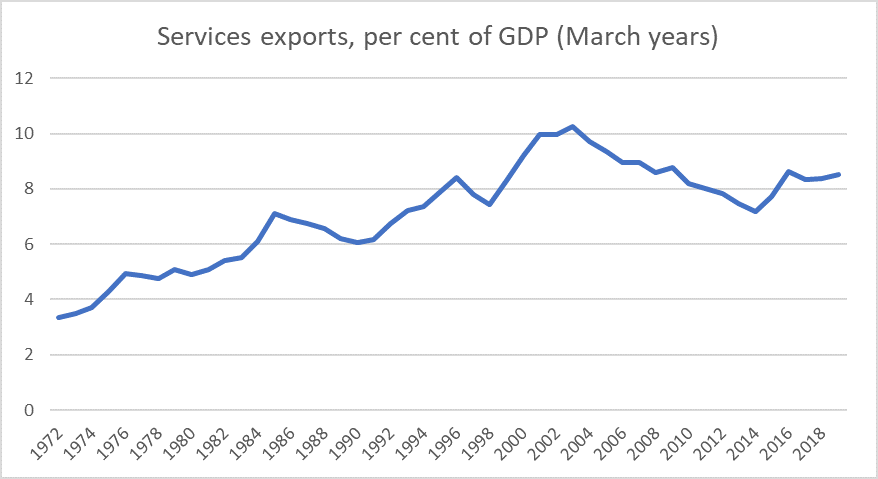
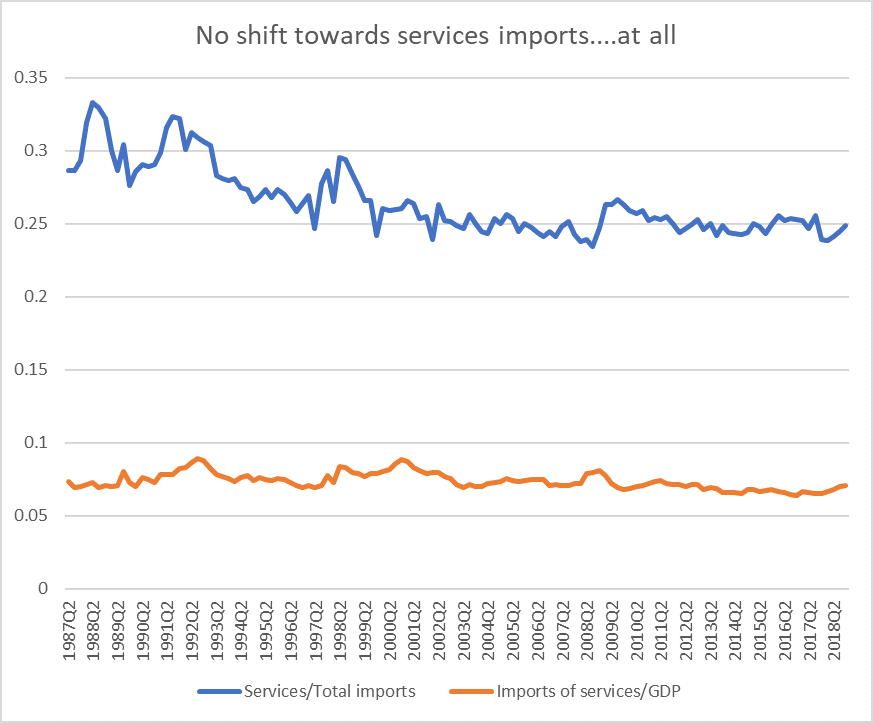
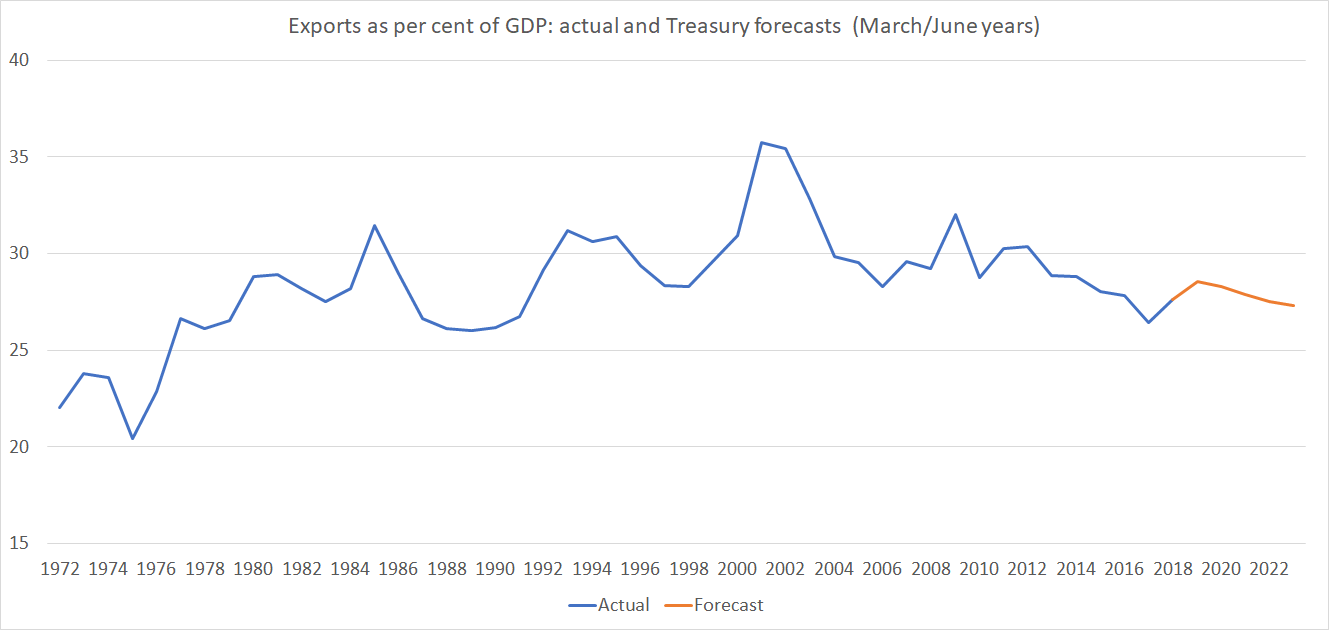
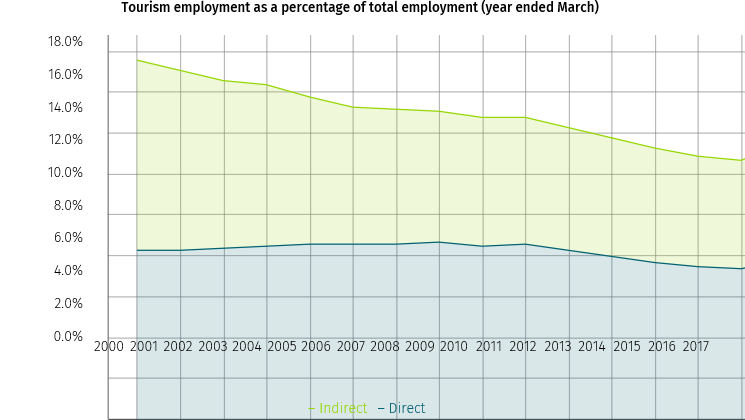
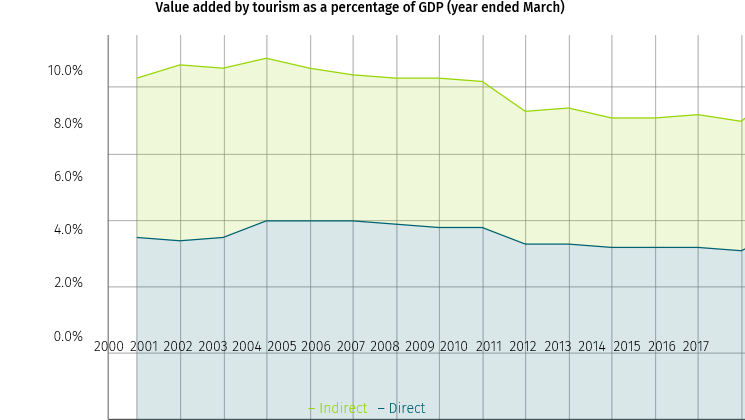
One can pick all sorts of holes in that  (massive film subsidies for example, or the fact –  as I’ve documented here before –  that on no proper statistical definition of exports are “technology exports” “our third biggest export sector.  But don’t worry about those sort of picky details.   Wouldn’t the Minister’s text lead an uninformed reader to suppose that the outward orientation of New Zealand’s economy had markedly increased since the early 2000s?   Nothing in the speech suggests otherwise, but (again) lurking in the full report was the sort of chart I run here regularly.

exports parker.png

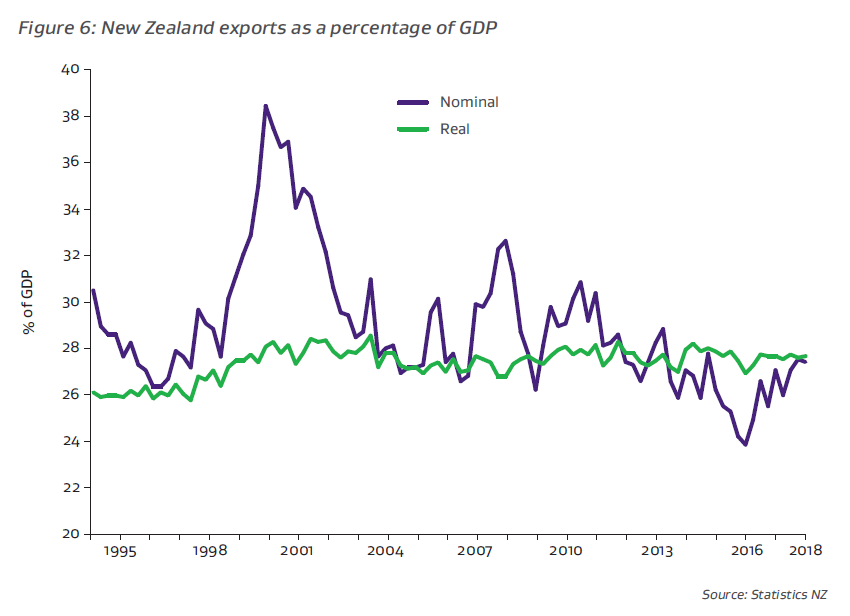
It just hasn’t happened.   There are individual success stories, of course –  as there have been throughout our history –  but it doesn’t add up to much, when productivity growth has lagged further, and our export/import shares have gone sideways or downwards.     That, apparently, was the legacy of those earlier planners (actually I doubt all their words etc added up to much at all).

But the Minister is breathless in his enthusiasm and goes on

Kiwisaver and the Cullen Superannuation Fund have deepened our investment skills and capital markets.

New Zealand Trade and Enterprise has been important in helping many exporters sector navigate their risky journey into new markets.

Our seed or angel investment capital market has matured. The innovation ecosystem has strengthened as management capability and globalisation ambitions have both grown.

We still suffer a gap in series A and B capital rounds, which this slide shows – something we have addressed in our latest Budget.

The $300m boost, and lead being shown by our largest NZ investor – the Guardians of the NZ Superfund – will attract private sector investment and help our firms to achieve their potential.

This will help to directly fill the current ‘capital gap’, and draw in other capital from NZ and abroad.

Give me leave to differ.   National savings rates haven’t improved materially, whatever NZTE has done –  let alone all those preferential trade agreements, which Parker is trying to negotiate more of – exports haven’t become a more important part of the economy, more firms aren’t showing they can foot it globally.       And when you are reduced to lauding a government money-pot, with no market disciplines and little accountability, as your catalytic hope, it is all a bit thin, and worrying to boot.      And I have no real idea what that final sentence means –  but if he means low rates of business investment, in reasonably well-run countries, private firms will invest eagerly to take advantage of profitable opportunities, when they exist.

The breathless energy continues

There is no time for delay. The seemingly exponential growth in opportunities will within just a decade or two morph into the law of diminishing returns.

At one level its simple, if we want these innovative parts of the economy to grow faster, we have to apply more of our precious resources to the task.

Don’t ask me what it means, but it would certainly good if there was some serious recognition from the top of government that our economic performance has really been pretty lousy for decades and an evident determination to get to the bottom of why, rather than just trying to pick a few more “winners”.

The gush goes on, sector by sector (you can read it for yourself), but haven’t we heard it all before.  They were probably discussing such things, enthusiastically, at the National Development Conference 50 years ago.

The speech ends with a full page on “Industry Transformation Plans”. I’m guessing they probably won’t come to much, so perhaps little harm done, except that more years pass, and more energy is devoting to avoiding the real issues.  Here is a sample of the Minister’s great enthusiasm for what government can and will do with these plans.

These describe an agreed vision for the future of a sector, and set out actions required to realise this vision.

Industry Transformation Plans are in train across large sectors of our economy – in agriculture with the Primary Sector Council for example.

Our first Industry Transformation Plan was the Construction Sector Accord. It was co-developed by an industry Accord Development Group. Industry leaders working with the Government.

Our next Industry Transformation Plans focus on four other priority sectors: food and beverage, digital technology, forestry and wood processing, and – as I have said – agritech.

The Prime Minister’s Business Advisory Council and the Future of Work Tripartite Forum will provide strategic leadership.

Key components of each plan will include assessments of the opportunities and risks from digitalisation, the future of work and skills training.

Risk sharing between government, businesses and labour to enable skills training to upskill existing workforces will be crucial to avoid the rising inequality which will otherwise flow from the future of work.

Each plan will also set out decarbonisation pathways, ways to increase exports, as well as an assessment of capital constraints. Partnerships are needed.

Business, workers and government all have a stake in every industry and we need to partner to make a real difference for New Zealand.

It is almost literally incredible.  The hubris, the lack of any apparent recognition of the limits of government knowledge, the complete absence of any sense of the benefits of vigorous competition, of creative destruction even, or market disciplines and so on.  Bill Sutch might have been proud.

It is sad in a way.  I suspect David Parker is better than this, and knows that this sort of stuff just isn’t likely to be any more transformative than the last (or first) wave of goverment talkfests.  But when you aren’t willing to even think about tackling the real issues  – the real exchange rate doesn’t appear in the 50 page document either –  I guess you need a lot of sound and fury, lest –  just a year out from an election –  it look as if the government is doing nothing, has no ideas, or doesn’t really care.  Sadly, all the talk is likely to signify almost nothing, in making a real difference, reversing the economic underperformance, and even building (in the government’s own words) “an economy that is more productive, sustainable, and inclusive for all New Zealanders”.


Australia’s foreign trade

In the wake of the upset Australian election result on Saturday, I thought it might be a good day for a quick post on some Australia/New Zealand economic comparisons.

I often bang on about New Zealand’s atrociously poor longer-term economic performance, but if Australia’s longer-term performance is less bad by comparison, we are about the only country that makes them look less bad.

At present, for example, average real GDP per hour worked in Australia is about 15th in the OECD, with quite a gap to 14th.   To New Zealand readers that probably doesn’t sound too bad, said quickly, but in 1970 –  when the OECD series starts – Australia ranked 8th.   A hundred years or so ago, on the eve of World War One, Australia’s real GDP per capita –  the only measure for which there are long-run historical estimates –  was 1st equal among the countries that now make up the OECD (with New Zealand and the United States).

But my particular focus this morning is exports, as a share of GDP.   There is an old mercantilist sort of view –  which at times seems to be held by Donald Trump –  that somehow exports are a superior form of economic activity, and that whereas exports are in some sense good, imports are bad.  That isn’t my story at all.   Exports and imports are both good –  gains from trade and all that.  In many respects, at least at a national level, one doesn’t go too far wrong in saying that we export so that we can import.  Of course, firms export not countries, but over time and in the aggregate, our appetite for cars, jet aircraft, overseas holidays or Hollywood movies is only able to be met if we find other products and services we (firms based here, employing us etc) can successfully sell to the rest of the world.  And since, especially for small countries, there is a lot bigger market in the whole world (even just the whole advanced world) than at home, export success often tends to go hand in hand with wider economic success: it isn’t that the exports, per se, make you prosperous, but that you’ve been able to generate (or even dig up) products and services that other people will pay for: you’ve passed the (demanding) market test.   Empirically, countries that have sustainably caught up –  in GDP per capita or GDP per hour worked terms –  almost without exception have had strongly performing export sectors.

But what about New Zealand and Australia?

Here is the (nominal) share of exports in GDP for the two countries for the period since our quarterly data starts in 1987 (as the paeans to Bob Hawke last week remind us, at the time both countries were doing fairly far-reaching economic reforms).   This is simply the nominal value of exports over nominal GDP.

aus exports

That gap has closed, a lot, over the decades, perhaps especially over the last 15 years or so.

It is worth remembering two stylised facts:

  • remote countries tend to trade less internationally than do countries close to lots of other countries/markets (distance really does reduce economic opportunitites), and
  • small countries tend to trade internationally more (share of GDP) than large ones.

In economic terms, New Zealand and Australia are almost equally remote (arguably they a bit more so than we, since Australia is big relative to New Zealand).  So, all else equal, one wouldn’t really expect a country five times the (population) size of the other to be exporting a similar share of their GDP –  New Zealand should be well ahead.

There is another possible exports/GDP measure. This chart uses deflated (“real”) series for both exports and imports.  Statisticians tend to frown on it –  and I mostly don’t use it –  but it does strip out the direct effects of terms of trade fluctuations, which (for Australia in particular) can be large.

aus real exports

In New Zealand, there has been no increase in the volume of exports as a share of GDP this century.  In Australia, by contrast (and after a flat period) there has been a substantial increase this decade, primarily as the newly-exploited mineral resource projects have come on stream.   In both countries, the real volume of exports has increased – in New Zealand’s case by about 50 per cent since 2002 –  but in New Zealand trade with the rest of the world is a smaller share of GDP now, and in Australia it is larger.

Of course, even this story has its complexities.  Much of the mineral sector operating in Australia is foreign-owned, so that a chunk (but by no means all) of the benefit of the export surge is accruing to foreign shareholders rather than to Australians.  But without the surge in mineral exports –  a windfall to a considerable extent (although with a policy framework that allowed developments to proceed) –  it is hard not to look at Australia and conclude that on the present suite of economic policies –  much the same as prevail in New Zealand –  their relative productivity and income performance would have deteriorated even further over the years.

Perhaps the gaps between New Zealand and Australia would have narrowed a bit, but from the wrong direction.  Much better would be if both countries were doing something that credibly might move them back up the advanced country rankings.   If the re-elected Coalition is less likely to further damage Australia’s economic prospects than Labor, no party on either side of the Tasman really seems to have serious analysis or ideas –  or to particularly care – about reversing decades of relative decline.


The shift from services to goods in NZ international trade

I wrote the other day about the woeful underperformance of our tradables sector, suggesting that it was past time for the Minister of Finance and the Secretary to the Treasury to actually engage with, and respond to, the underperformance.

Instead, this morning I stumbled on a speech given the other day by the Secretary to the Treasury that, in this regard, is not much better than just making stuff up.   The address was to an outfit called the New Zealand India Trade Alliance.   I’m sure there is lots of worthy detailed stuff in it, but my eye fell on this line

New Zealand is taking a more productive and effective path. We recognise the importance of continuing to focus on building a resilient workforce with flexible skills, and that we should expect and enable the economy to adapt to change as it happens.

One of the most positive changes for New Zealand has been digitalisation. It has thrown open opportunities to sell services and deliver them to other countries in a fraction of a second, in addition to selling goods delivered in days or weeks.

This shift in trade from physical goods to services is very evident in the trade between New Zealand and India.

It wasn’t a speech I’d normally have read, but this line –  the “shift in trade from physical goods to services” –  had been highlighted in a tweet retweeted by the (able and respected) MFAT Deputy Secretary responsible for trade negotiations etc.

It appears to be true in respect of the (fairly small) trade between India and New Zealand (Makhlouf quotes some numbers).  But it just isn’t happening for the New Zealand economy as a whole.  In this chart, I’ve shown two lines: for the whole country, exports of services as a share of total exports and exports of services as a share of GDP.

services X mar 19

Services exports now (from New Zealand) are about the same share of total exports as they were 20 years ago.  And, consistent with the fact that total exports as a share of GDP has shrunk over that time, so has total services exports as a share of GDP.

And, as I noted in the post the other day, this is although we are heavily subsidising some parts of services exports –  the film industry notably, but also the export education sector (by bundling work rights, residence points etc together with the sale of education services, an issue that may have been of some salience for services exports to India).

How can we hope to see half-decent analysis and policy advice from the government’s (self-described) lead economic adviser, when the Secretary to the Treasury won’t even face basic facts?  There is nothing intrinsically wrong with goods exports –  in a successful economy we’d probably have more exports (and imports) of both goods and services – but there simply is no aggregate New Zealand shift from good exports to services occurring.

I’m not a mercantilist, and it is important to look at the imports side as well.  Perhaps the Secretary really had in mind imports of services?  But that doesn’t help either.

services M 2

Almost 42 years, and no shift from physical imports to services imports at all.


HYEFU bits and pieces

This is getting to be a bit of a half-yearly ritual, but politicians’ words are one thing, and the best professional judgements of our Treasury forecasters are another.   The latter aren’t necessarily very accurate at all, but as their website blares

The Treasury is New Zealand’s lead advisor to the Government on economic and financial policy

Heaven help New Zealand you might think, given that both Treasury and the government seem lost in the nebulous alternative reality of the living standards framework, wellbeing budgets, and a grab bag of alternative indicators that may –  or may not –  matter to anyone much other than them.

But they are the official advisors, charged by law with producing independent forecasts twice a year.   And the forecasts I’ve been particularly interested in for a while have been those for the export (and import) share of GDP.  The previous government, somewhat unwisely set themselves numerical targets for the export share of GDP –  reality bore no relationship to the targets.  The current government avoided that particular mistake, but senior ministers –  all the way up to the Minister of Finance and the Prime Minister –  talk regularly about rebalancing the economy and gettings the signals right in ways that lead to more exports and higher productivity.

But here are the numbers, for exports as a share of GDP, from last week’s economic and fiscal update.

exports hyefu 18

You can read the earlier decades in various ways.   If you wanted to be particularly negative you could note that we got to an export share of GDP in 1980 which we haven’t sustainably exceeded since then.  But if you were of a more charitable disposition you might suggest that, broadly speaking, things were still getting better until about 2001 (although you shouldn’t put much weight on that peak –  it was an unusual combination of a year of a very weak exchange rate and very high dairy prices).  But this century hasn’t been good, and this decade has been bad.

As a reminder it isn’t that exports are in some sense special, but that successful economies typically have plenty of growing firms that are producing goods and services that are making inroads in the very big market of the rest of world.  That, in turn, enables us to enjoy for of what the rest of the world produces.   For small economies in particular, exports are typically a very important marker.

If you were of a generous disposition you might note that a temporary dip in the export share of GDP might not have been unexpected, or even inappropriate, for much of this decade.  After all, the Canterbury earthquakes meant that resources had to be diverted to repairs and rebuilding, and resources used for one thing can’t be used for other things.  The exchange rate is part of the reallocative mechanism.  And the unexpected surge in the population, as a result of high net immigration (a good chunk of it changing behaviour of New Zealanders), arguably had the same sort of effect.

But the largest effects of the earthquake are now well behind us, and even net immigration inflows are also dropping back.   And yet the Treasury forecasts –  the orange line in the chart –  show no sustained rebound in forecast export performance at all.   In fact, by the final forecast year (to June 2023) the export share of GDP will be so low than only one year in the previous thirty will have been lower.  Not only is there no sign of a structural improvement –  a step change that might one day see New Zealand exports matching or exceeding turn of the century levels –  there isn’t even a reversal of the decline this decade, which might plausibly be attributable to unavoidable pressures (eg the earthquakes).

For anyone concerned about the long-term performance of the New Zealand economy –  which appears to exclude our political officeholders, who could actually do something about it, but choose not to –  it is a pretty dismal picture.  Something like the current level of the real exchange rate seems to be Treasury’s “new normal”, and absent huge positive productivity shocks that is a recipe for continued structural underperformance.

Still on the HYEFU, I’ve long been intrigued by the Labour-Greens pre-election budget responsibility commitment around government spending (which continues to guide fiscal policy).

Rule 4: The Government will take a prudent approach to ensure expenditure is phased, controlled, and directed to maximise its benefits. The Government will maintain its expenditure to within the recent historical range of spending to GDP ratio.

During the global financial crisis Core Crown spending rose to 34% of GDP. However, for the last 20 years, Core Crown spending has been around 30% of GDP and we will manage our expenditure carefully to continue this trend.

As someone who thinks that there is plenty the government spends money on that just isn’t needed (and eliminating which would, in turn, leave room for some of the areas where more spending probably is needed), this commitment has never really worried me. But then I’m not a typical Labour/Greens voter.

But if it didn’t bother me, it did puzzle me.  Why would the parties of the left, evincing (otherwise) no conversion to the cause of smaller governments, (a) commit themselves to such a relatively moderate share of GDP in govermment spending, and then (b) aim to undershoot that?

Here is what I mean.  In the chart I’ve shown Treasury’s core Crown expenses series as a share of GDP, including the projections from last week’s HYEFU.  I’ve also shown averages for the periods each of the previous three governments were responsible for (thus the former National-led government mainly determined fiscal outcomes for the year to June 2018).

core crown expenses hyefu 18

On the government;s own numbers (and these are pure choices, made by ministers), core Crown spending in the coming five fiscal years (including 2018/19) will be lower every single year than the average in each of the three previous governments, two of which were led by National.   Sure, there was a severe recession in 2008/09 –  not that fault of either main party here –  and then a severe and costly sequence of earthquakes (ditto), but on these numbers government operating expenditure as a share of GDP in 2022/23 will be so moderate that in only two years of the previous fifty (Treasury has some not 100% comparable numbers back to the early 70s) was spending even slightly lower (those were the last two years of the previous government).

It seems extraordinary.

It isn’t as if the economy is grossly overheated (which might suggest a need for considerable caution, since GDP might soon go pop).  Treasury estimates that the output gap is barely positive over the entire projection perion (the numbers so small we might as well just call them zero).   Of course, Treasury (and other forecasters) never forecast recessions, and it seems quite likely that some time in the next five years we will have one.  All else equal, a recession would raise government spending as a share of GDP, but even a 4 per cent loss of GDP in a recession –  which would be pretty severe, similar to 2008/09 –  would only raise the share of spending to GDP by little over one percentage point.   Spending, at the trough of a severe recession, would still be under 30 per cent of GDP –  which was presented in the budget responsibility rules as something they want to fluctuate around, not as an untouchable electric fence.

The only plausible explanation I can see –  after all, the government show no “small government” inclinations when it comes to, eg, regulation –  is the weight they ended up placing on the net debt target.  But that was even more arbitrary than the spending rule.

In isolation, they could spend $5 billion more in 2022/23 and still only have spending as a share of GDP at around the average level of the previous Labour-led government.   Given the low quality of many of the things they are already spending on (fee-free tertiary education, regardless of means or ability, or the Provincial Growth Fund, to take just two examples), I’m reluctant to encourage them.  But it still looks odd.

The Treasury is New Zealand’s lead advisor to the Government on economic and financial policy.The Treasury is New Zealand’s lead advisor to the Government on economic and financial policy.The Treasury is New Zealand’s lead advisor to the Government on economic and financial policy.The Treasury is New Zealand’s lead advisor to the Government on economic and financial policy.

Services exports and economic performance

A couple of pieces I saw yesterday got me thinking again about New Zealand’s services exports and our economic performance.

On the one hand, there was an interesting ANZ report on tourism, which included this chart.

Chart of the week

Spending by international visitors has seen impressive growth in recent years.

International visitor spend by country

tourism

Source: MBIE

And then there was speech on the MFAT website by Catherine Graham, their Economic Divisional Manager.  MFAT doesn’t publish many speeches, so it was interesting to see a bit of an economics angle, even if  it was infected with the government of the day’s propaganda.  Perhaps that was inevitable to some degree in a speech by a public servant, but gratuitous endorsement of the Provincial Growth Fund didn’t seem strictly required in a speech notionally on “small state diplomacy”.

There was a certain breathlessness to the speech

All countries and regions face technological mega trends that are consequential to businesses and governments and affect decisions. Digitalisation, artificial intelligence and automation will increasingly affect wage and employment levels, in developing as well as developed countries. The key difference from the past is that the change – driven by computing power – will occur at an exponential, rather than linear, rate. 

Maybe, although the best guess remains that people who want to work will continue to be able to do so.  Markets adjust like that.  And global productivity growth shows no sign of such a dramatic transformation (for the better).

Also from the breathless side was this

Non-state actors such as the major e-commerce platforms (think Amazon and Alibaba) and the social media giants (think Facebook, Instagram and Google) are each on their own much bigger economically than New Zealand (and many other countries’ economies). How do we navigate our relationships with them as a nation state?

This seems mostly (a) meaningless or (b) wrong.  For example, on checking I learned that the market capitalisation of Facebook was US$390 billion, and its annual revenues were less than US$50 billion.  On no meaningful metric is it bigger than New Zealand, but even if it was there is a fundamental difference between a company and a nation state.  For better or worse, Facebook could be regulated out of existence almost overnight.

But the line that caught my eye, and prompted this post, was a couple of paragraphs later

Continuing to create and leverage smart ideas will be essential for New Zealand’s agricultural sector to keep delivering value to the economy and address broader societal and environmental challenges. Elsewhere in the economy, New Zealand’s success in weightless exports – such as software development, services embedded and embodied in physical products, and the creative arts – are growing apace. It is likely that this trend will be supported by ongoing technological advances.

You’d have thought that a senior economics person in our foreign affairs and trade ministry might have thought it worth mentioning that exports as a share of GDP peaked (in modern times) 18 years ago, or that there has been no growth in the real per capita output of the tradables sector in the same period.

But what about those “weightless exports” specifically?  Here is the time series of New Zealand’s services exports for the last 30 years.

services x nov 18

The 1990s looked quite good, indeed the peak wasn’t even until as late as 2003, but since then it has mostly been downhill.   There was a bit of a pick-up a couple of years ago, but even that doesn’t look to be going anywhere in particular.  The services export share of GDP is currently at a level first reached in 1996.  This is success?

That ANZ chart I started the post with looked quite impressive.  Nominal series over long periods of time often do.  But MBIE now has a nice tourism data dashboard (there is a migration data one coming), with some useful summary charts.  Here are a few of them

tourism mbie3

tourism MBIE 2

and, as a share of GDP –  direct and (estimated) indirect contributions

tourism MBIE 1

(UPDATE: A careful reader points out that these charts, which I directly downloaded from the dashboard, have not translated correctly.  Anyone wanting the correct pictures should go to dashboard itself (link above) and click on the “Overview” menu and then “Economic Contribution”.   As represented above the charts don’t capture the pick-up in tourism in the last couple of years.)

And tourism is by far the largest component of our “weightless exports”.    We all know there are specific services firms doing well, either selling abroad directly or (as Ms Graham notes) with their services embedded in other goods exports, and on the other hand we have the film industry (kept alive on massive direct public subsidies) and the export education industry (aided by substantial implicit subsidies, bundling immigration and work access provisions to the sale of educational services).  The bits that are doing very well, standing on their own feet, just have to be very small relative to the size of the economy, and to the scale of the New Zealand economic challenge (closing those huge productivity gaps).

How do we do by international comparison?

Here are exports of services as a share of GDP for the small OECD countries (I’ve left Ireland and Luxembourg off the chart, but –  for various reasons –  their services export shares are “off the charts” high).  Small countries is the relevant comparator here, as countries with large populations naturally tend to have rather lower foreign trade shares.

services x nov 18 2

Services exports from New Zealand have been shrinking as a share of GDP, and our services export share of GDP was low to start with.   This century to date, only three of these small OECD countries have had more of a fall in the services exports share of GDP than New Zealand has.   And all three of them –  Czech Republic, Slovakia and Estonia –  have in any case managed much faster productivity growth than New Zealand over that period.

Our economy isn’t doing well, no matter how much bureaucrats and politicians like to pretend otherwise, and regardless of whether one focuses on the “weightless” bit of the economy or the rest of it.  We do quite well at employing our people, but then wage rates and productivity are now so modest by advanced country standards –  gaps that simply aren’t closing –  that more people feel the need to work.

And strangely, it seems that MFAT’s Economic Divisional Manager has some inkling of this as she ends this particular part of her speech thus

I strongly believe that earth will never be “flat”, as Thomas Friedman claimed, and that geography remains, to a greater or lesser extent, destiny. Digitalisation is not causing the end of geography as a key determinant of prosperity. Industry clusters, international connections and trade, knowledge exchange and IP transfer are all positively correlated with geographical proximity as well as prosperity – in other words, they are much easier for large countries and countries with land borders to achieve. The catch-22 for small, isolated countries is that they are also the very conditions essential to overcoming the disadvantage of geographical distance. This is a huge challenge for New Zealand, both in terms of international policy but also domestically – currently we see the government tackling this challenge through regional policies such as the Provincial Growth Fund.  

Except that it isn’t some sort of “catch-22”.  It is a constraint that New Zealand officials and politicians need to finally get real about.   If – natural resource based opportunities aside – the best opportunities in the world arise from being in close proximity to lots of other people (as markets, skills networks or whatever), then trying to grow New Zealand’s population as a matter of policy –  lots more people in an unpropitious location –  looks crazy.  Many of the people who come would have been better off to have gone somewhere else (if they could).  And the challenge facing the typical longstanding citizen (native or otherwise) –  to manage top-tier global incomes and living standards – is simply made tougher with each new person our governments bring in.  That is not because of access to jobs (that is a straw man non-argument –  you observe full employment in poor, rich and middling countries) but precisely for the sorts of reasons that Ms Graham of MFAT identifies (even if she apparently has not thought fully through the implications of her observation).