Skills-based immigration: who has got Essential Skills work visas?

It is now 18 August, and I’m still waiting for MBIE’s response to my 28 May request for copies of advice on the economic impact of immigration and the permanent residence approval target.   The Act provides a basic response time for agencies of no more than 20 working days.

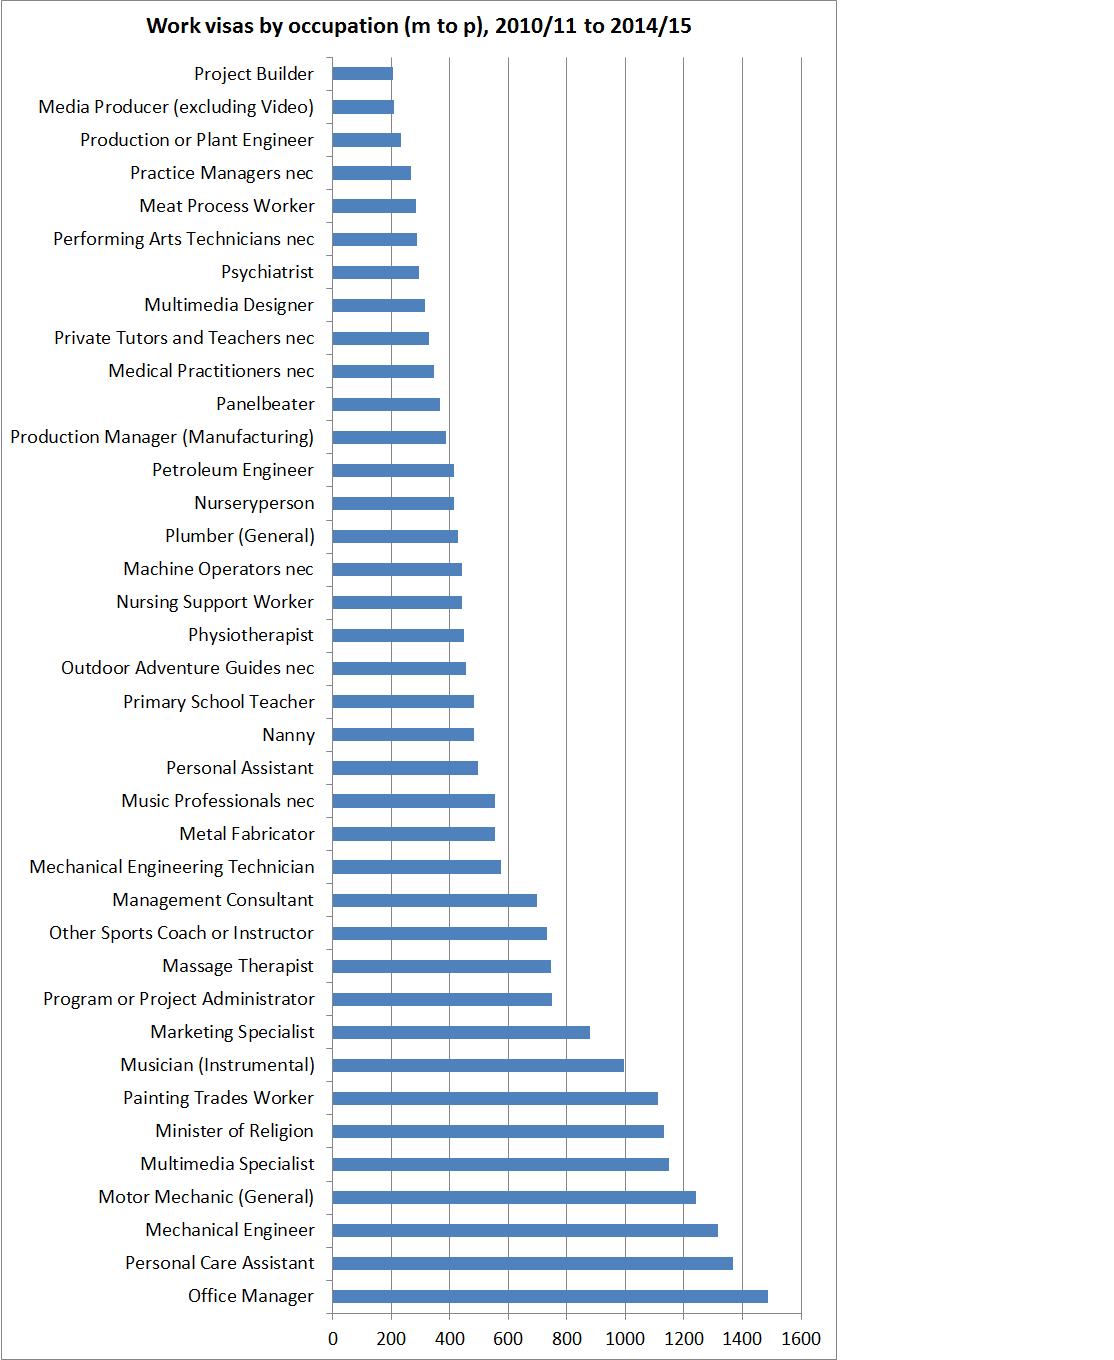
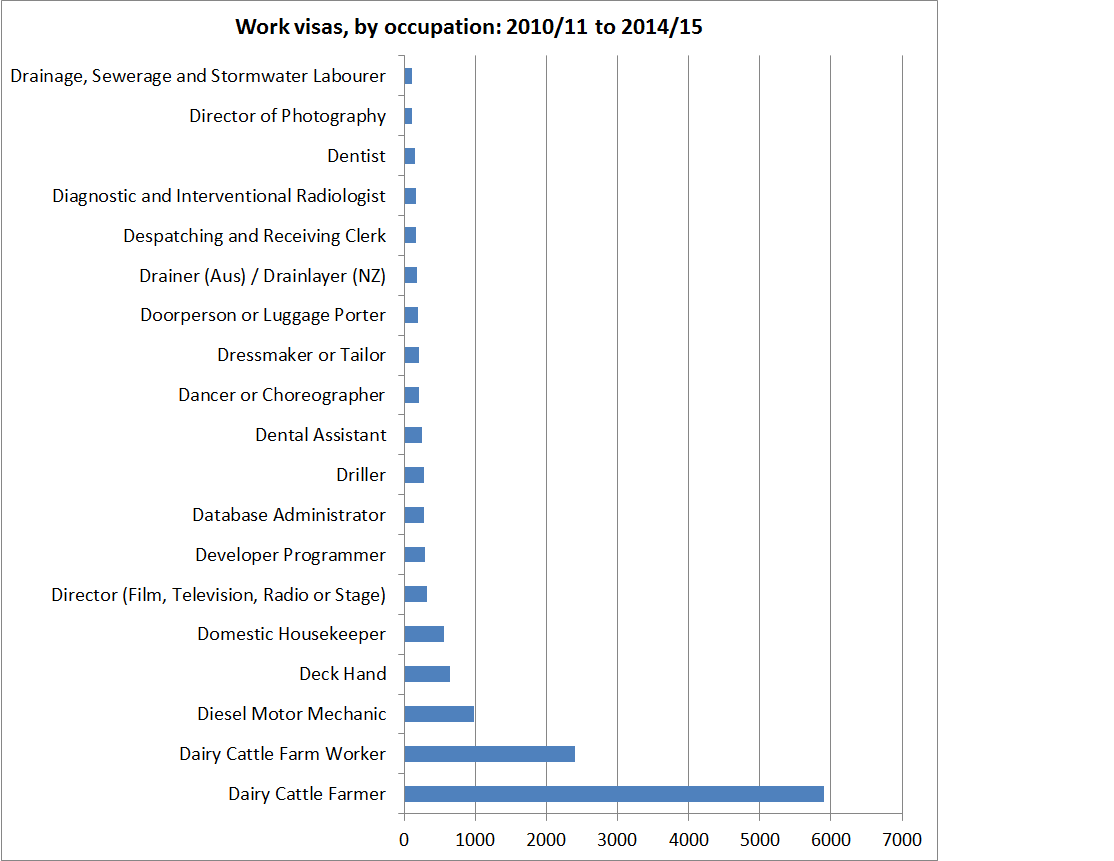
Last week I ran a series of posts (here) using data from MBIE’s website on the occupational breakdown of work visas granted for New Zealand over the years 2010/11 to 2014/15.   For a skills-focused immigration programme, a remarkably large number of the approvals were in not-obviously highly skilled occupational areas.

But as I noted last week, the 250000 or so approvals on the spreadsheet encompassed a variety of different types of approvals. Around 30000 were for a “specific purpose or event” (perhaps competitors in a professional sports tournament, or performers in a visiting professional orchestra). And more than 20000 were “variation of conditions” approvals, so including them was effectively double-counting people.

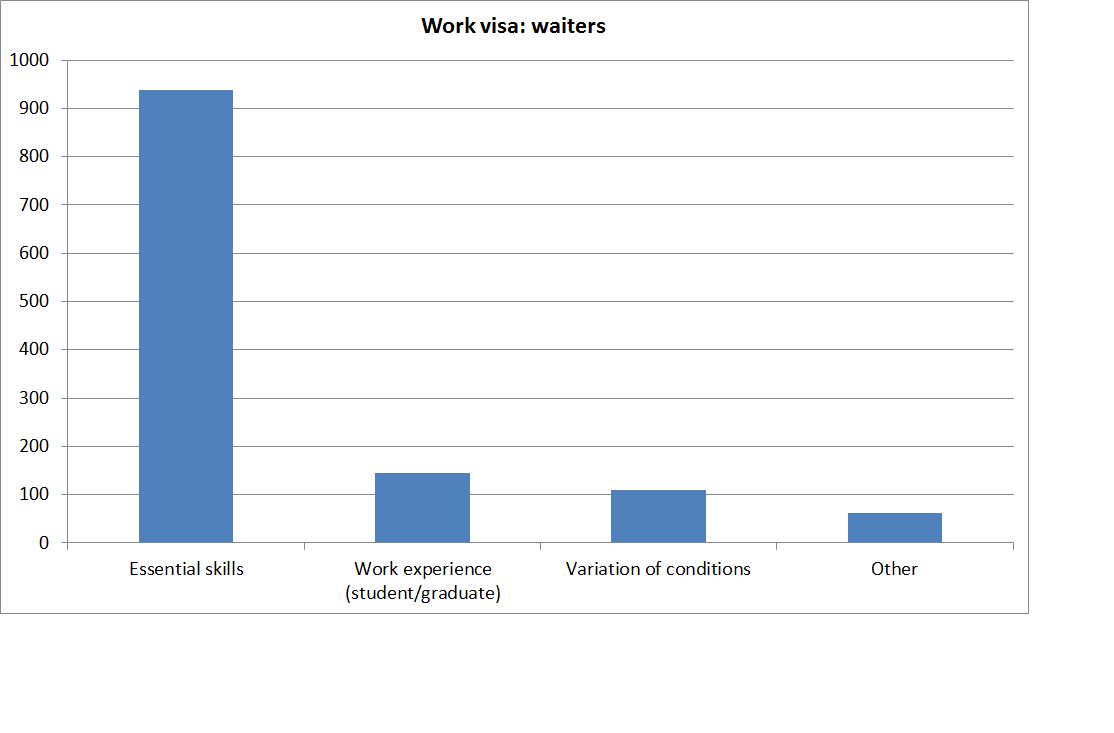
But the heart of the list is the category MBIE call “Essential Skills”. Of the 250678 total approvals over those five years, 101296 were applications approved under the Essential Skills category.

Around 2500 of these approvals don’t have an identified occupation, but what of the remaining 99000?

I went through the Essential Skills list and tried to pick out the occupations I’d highlighted last week as not looking overly highly skilled.   The chart shows those with more than 200 approvals – starting from the bottom with “Shelf Fillers”. These 39 occupations accounted for almost 43000 of the total Essential Skills work visa approvals, almost 45 per cent of the total. (As previously, I’ve deliberately left out construction-related positions because there is a different set of arguments around the role of temporary migration is dealing with a temporary one-off source of labour demand).

work visas essential skills

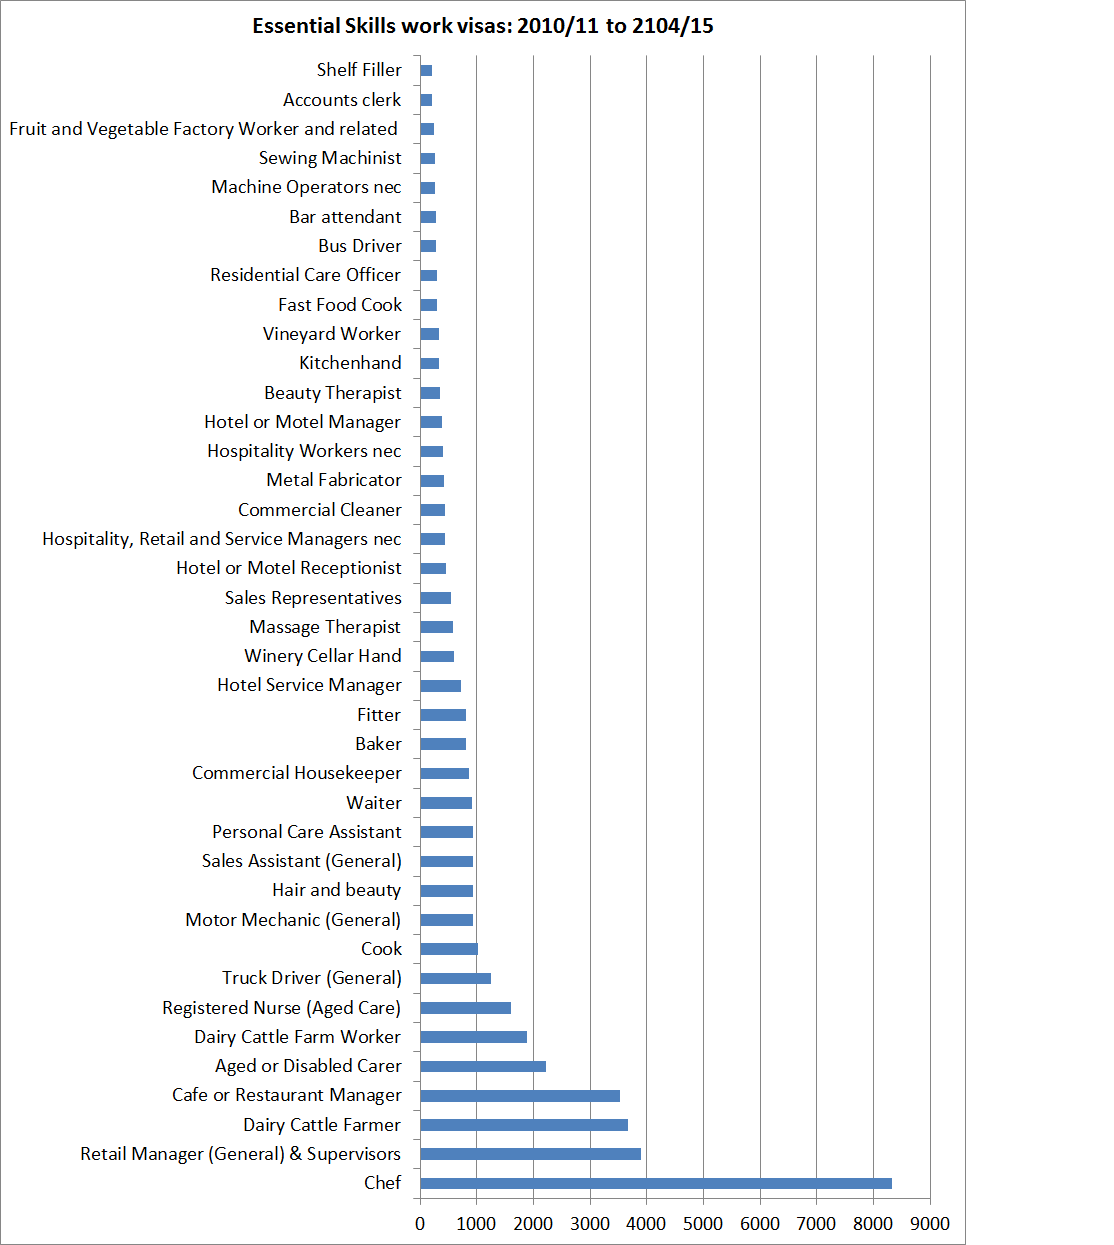
There is quite a range of occupations even on this list. Each person will probably look at the list and think of one or another occupation “oh, but that really is quite skilled”. And I’ve no doubt that most of them do involve some skill or other, but equally I’m pretty sure that looking across the list as a whole it is probably not what most New Zealanders have in mind when they hear that New Zealand has a skill-focused immigration programme, which is supposed to boost our national productivity through the spillovers from this skilled migration to the wider economy.  I certainly wasn’t what I had in mind. I’ve been critical of our migration policy on macroeconomic grounds – the sustained pressure on real interest and exchange rates – but have repeatedly accompanied that analysis with lines about “but we seem to focus pretty successfully on bringing in skilled people”.

And, as I’ve noted before, to get a visa under this Essential Skills category one needs to have a firm job offer from a New Zealand employer, which requires meeting this standard:

Evidence there are no New Zealand workers available

To get an approval in principle before you apply, or to show us that there are no suitable New Zealand workers available when you are applying, the employer has to show that they have genuinely searched for suitably qualified and trained New Zealand workers.

The employer also has to explain why:

  1. their particular job specifications are necessary for the work
  2. New Zealand applicants are not suitable, and
  3. New Zealand applicants cannot be readily trained.

There must be a huge amount of search activity going for those elusive chefs/cooks…..

Many other work visas (25000 or so over the five years of this data) are granted to people who are simply partners/spouses of students or someone who has got an Essential Skills visa approval. There appears to be no skill or occupational requirement for these people.

Unfortunately, the MBIE data do not indicate how long each work visa approval was for.   For lower-skilled occupations, visas are apparently typically for shorter-periods than those for higher-skilled occupations. That will mean that simply counting total approvals by occupation will overstate the effective share of lowly-skilled labour in the total inflows under the Essential Skills category.   But it is not obvious why we are granting Essential Skills work visas to shelf fillers, fast food cooks, cleaners, kitchen hands, waiters , or aged care workers at all.  It has the feel of something equivalent to “corporate welfare” –  employers smart or lucky enough to get on the list access labour that is cheaper than otherwise.   And this is all before we take into account people here on the numerous working holiday schemes.

Work visas are for a limited term, and are distinctly different from permanent residence approvals. Some of the latter are for genuinely quite highly-skilled people (on a skills criterion shelf fillers would not gain permanent residence approval). But as the Treasury material I commented on last week illustrated, in recent years only around half of even permanent residence approvals came under the “Skilled/Business” headings, and that heading included not just the skilled worker themselves (chefs and so on) but their immediate families.

There are all sorts of arguments for immigration. Some make cases on humanitarian grounds (genuine refugees), others on simply targeting a bigger population, some aiming for diversity or “superdiversity”. Some libertarians will even mount an “open borders” argument – that the world would be better off if everyone could simply move to where the opportunities were best for them. But New Zealand governments, over 25 years or so, have focused on skills-based arguments – that a large-scale immigration programme offers a way of supplementing local skills in ways that don’t just boost total numbers but which add to the productivity and living standards not just of the migrants themselves but of the local population.

I’m sceptical that we have had any such gains.. On the one hand, New Zealand – while attractive as a place to live – just isn’t that appealing (small, distant, underperforming) as a place to work and grow a business for the hardest-driving and most energetic of people. And the fact that the additional pressures on demand from immigration dominate any supply benefits in the short-term has meant that in a modest-savings economy, high inward immigration has put sustained pressure on real interest rates (highest in the advanced world for the last 25 years) and the real exchange rate.  Business investment, especially in the outward-oriented tradables sectors, has suffered, and continues to do so.

But these data tend to illustrate that our immigration programme isn’t really that skills-focused at all.  If so, it is hardly surprising that there are few/no signs of beneficial spillovers to the rest of us.   And the programme has just been further debauched: as I noted a couple of weeks ago, the government’s recent announcement of additional points for people going to the regions will simply lower the average quality of the migrants we let in. There is a lot of idle talk about attracting really top people, and “the next Bill Gates” is a common shorthand. But our politicians, and their advisers, need to face the fact that New Zealand just isn’t that attractive to such people, even if we could identify them. Our universities are not top-tier. Our market is small. And our country is remote.   As even the advocates acknowledge, even among the Anglo countries, why would you choose New Zealand if you could get into the US, the UK, Canada, Australia, or even Ireland (which may be no bigger, and have no better universities, but is within the EU and close to continental Europe).

It is time some pretty hard questions were asked about our immigration programme and strategy. The Australian government has had their Productivity Commission do two reviews in the last decade. It looks like an issue tailor-made for our own Productivity Commission to have a look at.  Perhaps the Secretary to the Treasury could then produce the evidence or arguments behind his rather glib assertions about the benefits to New Zealand of our very large immigration programme?

Can Steven Joyce’s confidence be taken entirely seriously?

I watched Q&A’s interview yesterday with Minister of Economic Development, Steven Joyce. He was resolutely upbeat, rather beyond the point where his case could be taken entirely seriously.

The Minister tried to reassure us by observing  that he’d taken a look at New Zealand’s previous four recessions and we weren’t facing anything like that. In particular, he assured us, the world economy was different.

I’m not sure which recessions the Minister had in mind. But here is the chart of six-monthly growth in real GDP back to the start of the official series. Six-monthly because of the popular lay definition of a recession as two consecutive negative quarters of GDP growth. It has never been entirely clear why that measure enjoys such popularity. Apart from anything else, it means something quite different in all those European countries or Japan with flat or falling populations than it does in, say, New Zealand, with 1.9 per cent estimated population growth in the last year. Two quarters of zero or negative GDP growth in New Zealand is a quite material hit to per capita GDP.

gdp 6 mth changes

My first observation about past recessions, or marked growth slowdowns, is that they almost always take officials (and probably ministers) by surprise. I reflect sadly on having been in policy/analysis roles in the Reserve Bank in each of the episodes in this chart where growth got to zero or negative. I’m pretty sure we didn’t expect or anticipate a single one of them. To take just the most recent examples:

  • The 2010 double-dip recession was such a surprise that the Reserve Bank had raised the OCR twice just as it was happening.
  • It wasn’t until several months into 2008 that the Reserve Bank recognised even the initial domestic recession

But you could go through published material from the Bank around each of these episodes and the story will be much the same. And I’m not trying to pick on the Bank. I’m pretty sure Treasury’s record would have been no better, and nor (consistently) would that of any of the market forecasters/economists. There would be nothing very unusual if, by the time the September or December national accounts numbers came out, it turned out that real GDP had been going backwards for some time, even as ministers and senior officials had been running the usual upbeat story.

My second observation is that while severe world downturns are bad for New Zealand, we haven’t needed global recessions to have a downturn in New Zealand. Our 1991 recession and our 2008/09 recession were part of common global (or advanced country) events, but our 2010 double-dip recession, our 1997/98 recession, and our 1988 recession were largely home-grown. The Minister wanted to take comfort from the state of the world economy, but I’m not sure why.   World growth rate estimates are no better than mediocre, and they rest on estimates of China’s growth which few people now take seriously. Growth in many other emerging market countries has been slowing, as their credit-booms exhausted themselves, and there is no sign of acceleration in the anaemic growth in most of advanced world. Commodity prices have been falling very sharply, and monetary authorities in many countries have been easing policy in the last 18 months. Perhaps the US Federal Reserve will raise interest rates next month, but if so it seems to be as much as response to the siren call of getting back to (questionable estimates of) a neutral interest rate, rather than because demand growth is putting much upward pressure on inflation.

There has been plenty of talk of New Zealand maintaining growth at around 2 or 2.5 per cent. But remember that in the last six months for which we have official data, real GDP rose by only 0.8 per cent. And that was the six months to March, when sentiment was still pretty upbeat, employment was growing strongly, and so on.   It is hard to believe that “true” growth in the rest of this year – and we are now half way from March to the end of the year – will have been stronger than it was in the six months to March. If it is only as strong, that produces an annual growth rate of not much more than 1.5 per cent. With building activity starting to go sideways, unemployment rising, and consumer and business sentiment down – and as the sharp fall in the terms of trade has grabbed the consciousness of many people – a much safer bet would seem to be lower growth. It isn’t clear to me why, say, one would bet on an average of anything more than zero growth for the next few quarters.

There has been talk of the “automatic stabilisers” working. Perhaps, but lets look at them. Fiscal automatic stabilisers are not particularly strong in New Zealand – which just reflects the fact that our maximum marginal tax rates are low, and our unemployment benefits are modest and at a fixed rate. Interest rates are falling, but they probably shouldn’t have been raised last year, and so far only half the increase in the OCR has been unwound. As I’ve noted previously, by the standards of past cycles in short-term interest rates, even a cut in the OCR to, say, 2 per cent by early next year would not be remotely aggressive.   And it is quite possible that medium-term inflation expectations are still falling – there have been suggestions of that from the bond market, for example. If so, real interest rates aren’t falling much at all.

iib infl expecs

And, of course, the exchange rate has fallen. As I noted last week, the fall over the three months to July was one of the largest short-term falls we’ve seen in the floating exchange rate period. But we’ve had one of the largest falls in commodity prices (and probably the terms of trade) on record, and I don’t think anyone would regard the TWI at just over 70 – where it has been for the last month or so – as particularly stimulatory. It is back at around the levels prevailing in 2010.

So combine subdued world demand growth, very deep falls in commodity prices, a levelling off in one of the biggest construction booms in modern times, continuing modest fiscal consolidation, subdued credit growth (except among distressed dairy farmers), real interest rates that remain very high by world standards, and a real exchange rate that has only dropped back to around the average level of the last 15 years, and it isn’t clear what is likely to hold up growth in New Zealand this year.

Of course, that migration-driven 1.9 per cent population growth helps boost demand. But since even at the peak of the migration inflows there was barely any real per capita GDP growth (and the level of the real per capita measure of income (ie allowing for the terms of trade) peaked in the March last year), that might be cold comfort. And the influx of people (especially the non-citizens) may well start to wane if the labour market conditions facing prospective employees keep on deteriorating.

Here’s one final chart. It shows annual growth in nominal GDP: already down to 2 per cent in the year to March, before this year’s fall in the terms of trade has been reflected in the national accounts. Only in previous recessions has annual growth in nominal GDP got any lower than it is at present.

ngdp apc

With the combination of mismanaged monetary policy, ebbing activity in one of the world’s largest economies (and major source of demand growth in recent years) and the very deep fall in commodity prices, it might be better to ask not “can we avoid a couple of negative quarters” – the technical recession question – but to ask instead what makes us confident we are not already in a renewed recession (real, as well as nominal), perhaps already deepening? I don’t purport to do quarterly GDP forecasts, and would be happy to be wrong on this one, but presented with the raw New Zealand data it looks like the sort of conclusion a visiting analyst from Mars might easily reach.

Downturns, recessions, corrections don’t last for ever.  And they don’t, in the end, make that much difference, to the longer-term (rather disappointing) performance of the New Zealand economy.  But for individuals –  particularly the 148000 unemployed, and the others likely to be joining them –  and business owners they can matter a great deal.  Some variability is natural and unavoidable (the two aren’t the same thing) but macroeconomic management should have been able to have prevented unemployment rising again before it ever quite recovered from the last two recessions, and to have avoided any new recession.  It looks to have failed already on the first count, and the outlook doesn’t seem promising on the second.

Skills-based migration: completing the alphabet

The two charts below capture the numbers of work visas given for each of the occupations shown (only those with 200 or more approvals are shown).

First, the letters e to l  (there were 51 economist approvals by the way).  There aren’t the big and egregious examples we’ve seen in some of the other charts, but one has to wonder about the number of fast food cooks, the kitchen-hands, motel receptionists, hairdressers, and hospitality workers.

work visas e to l

And then, finally, the letters m to p.  Nannies, personal assistants, massage therapists, personal care assistants, and even office managers raised a few questions.  And I shouldn’t pass over ministers of religion.  I’ve been in a parish that imported a British vicar, and I’m always surprised at the number of New Zealand parishes that advertise vacancies in the British Anglican weekly I subscribe to

work visas m to p

That completes the trip through the alphabet.  I think my point –  that there are very large number of not very highly-skilled positions for which work visas are being granted, often as “Essential Skills –  has been made, but I might try to bring some of the numbers together in a slightly more aggregated way next week.

I guess they got South Canterbury Finance very wrong, but…..

At the end of 2008 South Canterbury Finance was rated BBB- by Standard and Poors.  Earlier that year, it has issued three year bonds (themselves rated BBB-) in the US private placement market.   BBB- wasn’t such a bad credit rating for a small, not overly diversified unregulated domestic lender.  But a year or two later, SCF failed spectacularly, at considerable cost to the taxpayer.

Today, S&P has come out downgrading the standalone ratings of three of the four big banks to BBB+.  Of course, that is still two notches above SCF’s rating, but if it is really justified  the news would have to be quite concerning.  Note that the overall issuer credit ratings remain at AA-, reflecting the combination of probable parental support and the possibility of government support (for these systemically significant banks) in the event that they get into trouble.  Their assessment of the risk of investors losing money hasn’t changed.

But it is the standalone rating that is meant to reflect the quality of each bank’s loan book.

Recall that the RBNZ and APRA stress-tested the large banks only last year.  The stress scenarios were very demanding –  a 50 per cent fall in house prices and an increase in the unemployment rate larger than any seen in floating exchange rate countries in the post-war decades.  And the banks’ loan books came through with flying colours, and the actual capital of each of the banks was not impaired at all (capital ratios fell because risk weights on the remaining loans rose).

Here is a chart of capital ratios from the stress test scenarios from the November FSR

CET

If Standard and Poor’s are right there must be something very wrong with the Reserve Bank stress test results.  Not that much has changed in the make-up of banks’ portfolios in the last 12-18 months for the difference to be about new, much riskier, loans being made.  My bias is to run with the stress test results –  perhaps they are a little optimistic, but probably not too much.  But the Governor doesn’t seem to believe them, and neither apparently does one of the leading rating agencies.  If the Bank is really sceptical then it is really past time for it to lay out any reasoning, and evidence, it has as to why the stress test results are not now a good guide to the standalone health of the major banks.

Skills-based migration: q to v

I’ve had quite a few comments and questions on these data.  I want to be clear what they are.   They are drawn from an MBIE spreadsheet, usefully posted on their immigration statistics page, which contains all work visa applications over the years 2010/11 to 2014/15, over 300000 of them.  Around 60000 were declined, and I’ve just deleted those.  Another 60000 or so don’t specify an occupation.  That includes working holiday visas and a variety of others.  I’ve also not looked any further at those.  The charts in this series have been taken from the remaining 190000 or so successful applications.

And 190000 is, of course, not some net inflow of people over that period.  Some of the applications might have been people here for only a few weeks or months (eg specific event visas).  There are plenty of “variation of conditions” approvals, which are presumably multiple approvals for the same person.  And the same position might have been filled over five years by, say, five different foreign job-holders.    All I have sought to show that, of the large number of work visa approvals over the last five years a surprisingly large proportion have been for positions that don’t appear particularly highly-skilled, and which aren’t what most people (well, me anyway) had in mind when they hear of a skills-based immigration programme  (and this should, presumably be the most skills-oriented component of the overall programme –  refugees and family reunification visas have a different focus).

With that prelude, here is the chart for the letters q to v

work visas q to v

And what caught my eye this time?  A surprising number of truck drivers (if all ours really went to the West Australian mines, higher wages here would have been the market response I’d have thought), and huge number of aged-care nurses (to complement the even greater number of aged-care workers we saw the other day).

And then there was the retail sector –  more than 7000 retail supervisors and retail managers, mostly applying under an “Essential Skills” category.  Every single one of those shelf-fillers also applied under the Essential Skills category.

Somehow it doesn’t have the feel of a productivity-enhancing skills-focused programme.      Too often these have the feel of something where employers in particular sectors are rewarded for their lobbying skills in getting the particular occupational “skills” they want to employ on the approved list.  By contrast, the usual market response to shortages in particular occupations is for the relative wage for that occupation to rise.  And if the shortages are pervasive enough  –  unlikely over recent years when the unemployment has lingered around 6 per cent –  monetary policy tightens to keep overall demand in check.  Running approved lists of “essential skills” or areas of skill shortages is, in any case, a flawed strategy. It eases pressures on employers of that particular occupation, but since in the short-term demand effects of immigration outweigh supply effects (the standard result in New Zealand macro studies), any gain for employers in a single sector is outweighed by the additional demand pressures elsewhere in the economy.

Statistics New Zealand and the “population ponzi”

In the last few years, Statistics New Zealand has taken to “spinning” its statistical releases.  I use the term advisedly.  I’m sure all the numbers are reported entirely accurately, but my issue is more with which numbers, and which comparisons, they choose to highlight.  Almost always, they seem to emphasise what staff (and management?) presumably regard as good news.  Is that quite the job of a national statistics agency?  Personally, I value good quality data, and technical explanations for apparent oddities –  and the assurance that SNZ has no agenda other than good quality data, adequately explained.  There are plenty of others out there (backbenchers in parliamentary questions?) to highlight the good, or not so good.

The latest example came this morning, with the population data release below.

It might be mildly interesting to know that population growth in the last year outstripped that even in  –  much richer and more successful –  Australia.  But SNZ seems to think this is “a good thing” –  if anything reporting it as something of a race.   Fortunately, we aren’t  early 20th century France needing to stress about the growing military threat from a larger neighbouring country’s faster population growth.  And if we want to celebrate success, I’d suggest doing it using measures of per capita living standards (however you want to define them) or even productivity.  But leave it to the commentators and politicians to do the cheerleading.

Just to illustrate the apparent “good news bias”, SNZ put another release this morning.  Real retail sales rose only 0.1 per cent in the June quarter.  But there was no mention of what happened in Australia.  I checked, and in Australia the comparable series rose by 0.8 per cent in June quarter.  In per capita terms, I guess that gap is a little larger still.

SNZ does a pretty good job with the inadequate resources they have, but I’d urge then to leave the editorialising to journalists, commentators, politicians and the like.

Population growth outpaces Australia’s – Media release

14 August 2015

New Zealand’s population is growing at its fastest rate for over a decade, and is exceeding Australia’s growth rate, according to new estimates released by Statistics New Zealand today.

The country’s population grew by 86,900 people, or 1.9 percent, in the year to 30 June 2015. This came from net migration (arrivals minus departures) of 58,300, and natural increase (births minus deaths) of 28,700. New Zealand’s estimated resident population was 4.6 million at 30 June 2015. The latest figures
show Australia’s population growing at 1.4 percent a year.

“The last time New Zealand’s population grew at this rate was in 2003 when the increase was 2 percent,” population statistics manager Vina Cullum said. “The last time New Zealand’s growth rate exceeded Australia’s was 2004.”

China, currency adjustments, etc

[For those keen on my skills-based migration series, more posts are coming.  For government officials, and any others, going “yes, yes, you’ve made your point”, I will clearly label them and feel free not to read them]

There is a column in the Dominion-Post this morning, from a well-regarded journalist, Pattrick Smellie, running under the confident heading of “Beijing not starting a currency war”.  I’m sure the Chinese Embassy will have been pretty happy with the coverage.

Making sense of our own central bank is often hard enough, let alone the intentions and motivations of the Chinese state authorities. Early in World War Two Winston Churchill described Russia, newly signed-up to a non-aggression pact with Germany as “a riddle wrapped in a mystery inside an enigma”.  It seems to be a phrase that could readily be adapted to the Chinese authorities.  But as Churchill put it in the same speech, the key to Russia was “national interest”, or perceptions of it.

And, no doubt, no one is setting out to start a “currency war”.  If one actively devalues one’s currency one prefers that no one else follows.  That  is how the competitiveness gains are secured.  Then again, so-called currency wars in the past have sometimes been rather a good thing.  In the Great Depression  the countries that freed their currencies from gold first, and devalued, recovered soonest, and the laggards (big or small) themselves recovered when they too devalued.  In that period, so-called competitive devaluations were a path to a much-needed easing in global monetary policy, and a recovery in global demand.  It wasn’t coordinated and each country acted in its own perceived self-interest, subject to the constraints each faced.  Facing a very severe adverse terms of trade shock, and the temporary closure of UK funding markets, New Zealand was fortunate that it allowed its currency to depreciate against sterling quite early, then benefited from the UK’s own early departure from gold, and then actively devalued again in early 1933.

What, then, of China?  As Smellie ends up acknowledging in his article, in a weakening economy a depreciating currency might be thought of as normal or natural, and China’s economy has been weakening fast –  almost certainly much faster than is officially acknowledged.

The BIS compiles real exchange rate indexes for about 60 countries.  I had a quick look at which countries had seen large real exchange rate changes since the pre-recession period.  Here I compared the average for the last six months with the average for 2005 to 2007.   13 countries have seen changes of more than 15 per cent[1].  China’s has been, by far, the largest change, and the largest increase –  up around 50 per cent.

china rer

It was pretty widely accepted a decade ago that the yuan was undervalued in real terms.  During this period, China was running huge current account surpluses –  something unprecedented in a fast-growing developing country  (Singapore or Korea, at similar stages of development, ran large deficits).  Hand in hand with the undervaluation, gross exports as share of China’s GDP had doubled from the early 1990s to reach almost 36 per cent in 2006.    Getting a good handle on true Chinese productivity growth isn’t easy, but there was pretty good reason, whether from the trade data or from productivity differentials, to have looked for a real yuan appreciation.

But a 50 per cent appreciation  – a considerable proportion of it in the last 12-18 months as the US dollar has strengthened –  is a very large move.  And, in conjunction with the much lower growth in global demand following the 2008/09 recession, the whole basis of China’s growth model has changed.  From a substantially export-driven model, China moved to relying on one of the biggest credit-led investment booms in history –  and, given the absence of market disciplines in China, perhaps the riskiest.  Credit to GDP soared.  Most of it has been domestic credit, but in the last few years there has also been a great deal of foreign debt taken on by Chinese borrowers.   Investment also soared –  from under 42 per cent of GDP in 2006 to more than 48 per cent by 2011.  Those are huge shifts.  And exports shrank back, from 36 per cent of GDP in 2006 to 23 per cent last year.  Again, a huge shift.  GDP was still growing, but much more slowly than it had previously, and with much less evidence of sustained productivity growth.

Against that backdrop, from a purely macroeconomic perspective, the idea of a depreciation of the real exchange rate must look quite attractive to some in Beijing.  Pursuing its own perceived national interests  no doubt, the Chinese credit boom of recent years has provided a lot of support to global demand, at a time when it was very weak, but the aftermath isn’t pretty.  It rarely is after credit booms –  see Spain or Ireland, or New Zealand post-1987.  With weakening domestic activity, and global growth that is still pretty subdued (at best), the Chinese authorities seem to have two broad short-term options.  Stimulate demand by gearing-up for one last government-inspired credit—based splurge, further exacerbating their own problems, or look towards tapping a bit more of the potential global demand for the benefit of their own producers.   (Of course, the third option would be a domestic cost- deflation, but the Greek model doesn’t seem to have much to commend it.)

People often point out that China’s consumption share of GDP is very low, and suggest a reorientation towards a more consumer-led economy.  But on the one hand those changes are likely to be slow –  and as Shang-jin Wei has pointed out , for example, things like the male-female population imbalance may be structurally driving up savings rate.  Perhaps as importantly, people are typically only willing to spend more if they are confident of their own future incomes.  At the end of a credit boom, with Chinese firms no longer securing the export growth they once were, that security isn’t unquestioned.

In a normal country, weakening demand at the end of a credit boom would naturally be followed by easing domestic monetary policy and a falling real exchange rate.  It is what happened in much of the West in 2008.   China has room to ease domestic monetary policy, but easier domestic policy almost inevitably puts more pressure on the exchange rate.  China has fairly large levels of foreign reserves (as a share of GDP) but expectations can change rapidly, and as many previous countries have found reserves can dissipate rapidly.  Plenty of capital is already flowing out of China.

I’m not suggesting any great insight into what the Chinese authorities were thinking earlier this week. In many ways, a lower real exchange rate would normally make a great deal of sense.   But these aren’t normal times.  As I noted earlier, the depreciations in the 1930s led to looser monetary policy globally.  There was no “beggar thy neighbour” dimensions to them, and everyone benefited.  And if the rest of the world still had materially positive interest rates, it could be the same now.  Easier Chinese monetary policy, lowering the real RMB might have been followed by some cuts in interest rates in other major economies, to offset the impact on them of the increases in their own real exchange rate.  But few large economies –  and none of the advanced ones –  has any material domestic monetary policy room (although the US can hold off  –  or reverse –  the widely-expected unnecessary initial tightening in its own monetary policy). Even in high-interest rate New Zealand, the policy room is dissipating.  Against that backdrop, any substantial depreciation of the yuan, even if it would be in China’s own macro-stabilisation interests, as its economy has slowed markedly, really could be a threat to the rest of the world.  A stimulus to demand in China risks being substantially at the expense of weaker demand elsewhere, at a time when overall global demand growth (China included) is at best modest, and probably weakening.  More competitive Chinese producers would be in a position to cut prices further –  in an economy where producer price inflation has been negative for a long time already –  posing new global deflationary risks.

Much of the media commentary this week has been about what the Chinese authorities intended.  And understanding that better would be good.  But, in the end, policymakers’ intentions matter only so far, once authorities have set out on a path, however halting, towards liberalisation.  There has been a widespread view until recently that the Chinese would not be willing to devalue the RMB –  whether for reasons for international relations, prestige or simply having bought the upbeat stories about China’s growth prospects.  Meanwhile, Chinese investors have been taking a different view.

This week’s action must have increased the perceived risk of some larger adjustment, whether willingly or not.  Many people have pointed out the size of past substantial devaluations –  I especially liked this piece –  but often enough those large devaluations (or float) were late adjustments, forced reluctantly on authorities who held on, and held on, until they could do so no longer.  No two countries’ situations are ever quite alike, but we shouldn’t assume that even if the Beijing authorities don’t want a large exchange rate adjustment that it won’t happen.

Much of the most recent real appreciation in the yuan reflected the material appreciation in the USD.  Some will recall that the continued appreciation of the USD, to which the Argentine peso was pegged, was one of the final straws that broke the Argentine currency board in 1991.

[1] In addition, Venezuela – which now has extreme currency rationing to defend an official peg – is recorded with a 251 per cent increase in its real exchange rate.

New Zealand credit growth in recent years

As the near-inevitable aftermath of China’s extraordinary government-led credit boom gathers pace, and the global deflationary risks mount, I thought it might be timely to have a look at credit growth in New Zealand in recent years.

I was partly prompted to do so by some reactions yesterday to my AUT Briefing Papers piece on housing. Several commenters at interest.co.nz were convinced that I was letting the banks off the hook, and that the creation of credit to finance house prices must be, in some substantial measure, to blame for high house prices (in Auckland).

In one sense, that reaction isn’t surprising. A similar model seems to have been implicit in the Governor of the Reserve Bank’s 2013 LVR restrictions and the new Auckland-specific investor finance restrictions he is consulting on at present.   After all, prudential regulatory powers of the Bank should, as per the provisions of the Reserve Bank Act, be used only when action is need to promote the soundness of the financial system.

Without covering old ground in detail, I don’t believe that there is any such systemic threat. The Reserve Bank has not made a persuasive New Zealand-specific case, and the one piece of careful analysis that has been presented (the stress test results) suggest that the banking system would be robust to even some very severe shocks.

The international literature suggests that probably the single best (albeit not very good) predictor of crises is rapid growth in the ratio of credit to GDP. We had that in the years prior to 2007. China has had it, much more dramatically, in the last five years or so. Many countries have had periods of very rapid growth in credit, and no banking crisis I’m aware of was not preceded by a period of very rapid credit growth. New Zealand’s stresses from 1987 to 1991 are an example.   But many, perhaps even most, episodes of rapid domestic credit growth have not ended in domestic systemic banking crises. New Zealand post-2007 was just one example.

The record suggests, unsurprisingly, that the quality of lending matters a lot. And the quality of lending tends to deteriorate a lot when, either

  • Government agencies are directing that lending or setting up incentives that drive banks to undertake poor quality lending (the US housing finance boom of the 00s and the recent Chinese credit boom are good examples), or
  • Where the regulatory shackles have just been taken off, and no one –  banks or regulators –  has much experience with a liberal market-based economy and appropriate credit standards (New Zealand, Australia, and the Nordics in the 1980s were good examples).

None of that looks to be the case in New Zealand at present.  We have credit data to the end of June, and GDP data only to March, but for the rest of this I’ll just assume that seasonally adjusted nominal GDP showed no growth in the June quarter.

Since December 2007, just prior to the big recession, New Zealand’s nominal GDP has risen by just under 30 per cent, and the four different measures of private sector credit have risen by about 33 per cent. But the pre-crisis dairy lending boom went on well beyond the end of 2007   If we start our comparisons from December 2009, we find that nominal GDP since them has increased by around 26 per cent and PSC by around 21 per cent. Within that total, lending to households has increased by 22 per cent.  Whatever the base period for comparisons, credit growth has been fairly subdued relative to GDP.

credit growth since dec 07
credit growth since dec 2009
And it is not that nominal GDP growth has been rampant. In the seven years to March 2015, NGDP increased by 27.4 per cent, down from 55.1 per cent growth over the previous seven years. As is now well-recognised, given the inflation target, monetary policy has been too tight over the last few years, not too loose.

Annual nominal GDP growth fluctuates a lot, largely with fluctuations in the terms of trade. At present NGDP growth is slowing rapidly. Credit growth is currently growing faster than nominal GDP growth   The strongest component of that is agricultural credit, up 7.6 per cent in the last year. But whatever the overall state of banks’ dairy exposure – and I suspect they will lose quite a lot of money, without it being a systemic threat – the current growth in dairy credit is not the sort of lending that is recklessly bidding up asset prices, it is a reflection of the severe drop in farmers’ income –  if anything, a buffer rather than the initial source of any problem.

In short, when credit has been growing at only around the (rather subdued) rate of growth in nominal GDP for the last 6-8 years

(a) it is difficult to credibly blame bank lending policy for growth in specific asset prices (Auckland house prices) without independent evidence of a decline in lending standards (which neither the Reserve Bank nor anyone else has sought to demonstrate), and

(b) we just don’t have the basis for expecting any severe stress on or threat to the soundness of the strongly-capitalised financial system.   Rising house prices certainly generate a demand for additional credit, but it is the rather more fundamental forces (driven by governments) –  land use restrictions and policy-driven immigration flows – that are the source of the underlying pressure on prices. The same banks operate nationwide, and there is no sign of house price inflation in Invercargill, or even Wellington.

Of course, a rather nasty economic slowdown appears to be already underway, and that could worsen a lot yet. If so, that will put a lot of pressure on a lot of borrowers.

Skills-based immigration – waiters

Somewhat annoyed with myself for losing my workings last night, I decided to start at the other end of the alphabet this morning.  Not many y or z occupations, but a fair number of Ws.

work visas wxyz

And again questions arise about the skills-based, productivity-enhancing, nature of those winery cellar hand and waiter approvals.  I had a slightly closer look at the waiter ones, using MBIE’s “application type”.  Somewhat to my surprise –  perennial optimist that I am –  this is what that breakdown looked like for the last five years.

work visas waiters

Café society and all that, but, really, an essential skill?

Skills-based immigration – D

I’m sure they are excellent dairy workers/farmers (all 8000+ of them), but there are only around 11000 dairy farms in the whole country.  It does, rather, have the feel of an approach more strongly focused, in effect, on keeping down wages rates and conditions in the New Zealand dairy industry –  and fuelling the gross output driven mentality which Peter Fraser and co-authors suggest has dominated the industry in the last decade or so, a period when real value-added in agriculture has not grown at all.

The gains to farmers are clear, but those to New Zealanders as a whole are rather less obvious.

A quite remarkably larger number of (skilled?) domestic house-keepers as well, no doubt complementing the 1000 commercial housekeepers, and contributing to the long-sought lift in productivity.

work visas D