[For those keen on my skills-based migration series, more posts are coming. For government officials, and any others, going “yes, yes, you’ve made your point”, I will clearly label them and feel free not to read them]
There is a column in the Dominion-Post this morning, from a well-regarded journalist, Pattrick Smellie, running under the confident heading of “Beijing not starting a currency war”. I’m sure the Chinese Embassy will have been pretty happy with the coverage.
Making sense of our own central bank is often hard enough, let alone the intentions and motivations of the Chinese state authorities. Early in World War Two Winston Churchill described Russia, newly signed-up to a non-aggression pact with Germany as “a riddle wrapped in a mystery inside an enigma”. It seems to be a phrase that could readily be adapted to the Chinese authorities. But as Churchill put it in the same speech, the key to Russia was “national interest”, or perceptions of it.
And, no doubt, no one is setting out to start a “currency war”. If one actively devalues one’s currency one prefers that no one else follows. That is how the competitiveness gains are secured. Then again, so-called currency wars in the past have sometimes been rather a good thing. In the Great Depression the countries that freed their currencies from gold first, and devalued, recovered soonest, and the laggards (big or small) themselves recovered when they too devalued. In that period, so-called competitive devaluations were a path to a much-needed easing in global monetary policy, and a recovery in global demand. It wasn’t coordinated and each country acted in its own perceived self-interest, subject to the constraints each faced. Facing a very severe adverse terms of trade shock, and the temporary closure of UK funding markets, New Zealand was fortunate that it allowed its currency to depreciate against sterling quite early, then benefited from the UK’s own early departure from gold, and then actively devalued again in early 1933.
What, then, of China? As Smellie ends up acknowledging in his article, in a weakening economy a depreciating currency might be thought of as normal or natural, and China’s economy has been weakening fast – almost certainly much faster than is officially acknowledged.
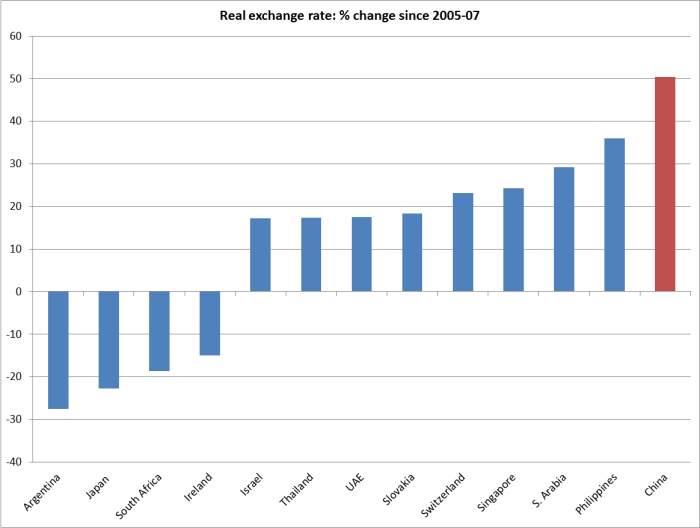
The BIS compiles real exchange rate indexes for about 60 countries. I had a quick look at which countries had seen large real exchange rate changes since the pre-recession period. Here I compared the average for the last six months with the average for 2005 to 2007. 13 countries have seen changes of more than 15 per cent[1]. China’s has been, by far, the largest change, and the largest increase – up around 50 per cent.

It was pretty widely accepted a decade ago that the yuan was undervalued in real terms. During this period, China was running huge current account surpluses – something unprecedented in a fast-growing developing country (Singapore or Korea, at similar stages of development, ran large deficits). Hand in hand with the undervaluation, gross exports as share of China’s GDP had doubled from the early 1990s to reach almost 36 per cent in 2006. Getting a good handle on true Chinese productivity growth isn’t easy, but there was pretty good reason, whether from the trade data or from productivity differentials, to have looked for a real yuan appreciation.
But a 50 per cent appreciation – a considerable proportion of it in the last 12-18 months as the US dollar has strengthened – is a very large move. And, in conjunction with the much lower growth in global demand following the 2008/09 recession, the whole basis of China’s growth model has changed. From a substantially export-driven model, China moved to relying on one of the biggest credit-led investment booms in history – and, given the absence of market disciplines in China, perhaps the riskiest. Credit to GDP soared. Most of it has been domestic credit, but in the last few years there has also been a great deal of foreign debt taken on by Chinese borrowers. Investment also soared – from under 42 per cent of GDP in 2006 to more than 48 per cent by 2011. Those are huge shifts. And exports shrank back, from 36 per cent of GDP in 2006 to 23 per cent last year. Again, a huge shift. GDP was still growing, but much more slowly than it had previously, and with much less evidence of sustained productivity growth.
Against that backdrop, from a purely macroeconomic perspective, the idea of a depreciation of the real exchange rate must look quite attractive to some in Beijing. Pursuing its own perceived national interests no doubt, the Chinese credit boom of recent years has provided a lot of support to global demand, at a time when it was very weak, but the aftermath isn’t pretty. It rarely is after credit booms – see Spain or Ireland, or New Zealand post-1987. With weakening domestic activity, and global growth that is still pretty subdued (at best), the Chinese authorities seem to have two broad short-term options. Stimulate demand by gearing-up for one last government-inspired credit—based splurge, further exacerbating their own problems, or look towards tapping a bit more of the potential global demand for the benefit of their own producers. (Of course, the third option would be a domestic cost- deflation, but the Greek model doesn’t seem to have much to commend it.)
People often point out that China’s consumption share of GDP is very low, and suggest a reorientation towards a more consumer-led economy. But on the one hand those changes are likely to be slow – and as Shang-jin Wei has pointed out , for example, things like the male-female population imbalance may be structurally driving up savings rate. Perhaps as importantly, people are typically only willing to spend more if they are confident of their own future incomes. At the end of a credit boom, with Chinese firms no longer securing the export growth they once were, that security isn’t unquestioned.
In a normal country, weakening demand at the end of a credit boom would naturally be followed by easing domestic monetary policy and a falling real exchange rate. It is what happened in much of the West in 2008. China has room to ease domestic monetary policy, but easier domestic policy almost inevitably puts more pressure on the exchange rate. China has fairly large levels of foreign reserves (as a share of GDP) but expectations can change rapidly, and as many previous countries have found reserves can dissipate rapidly. Plenty of capital is already flowing out of China.
I’m not suggesting any great insight into what the Chinese authorities were thinking earlier this week. In many ways, a lower real exchange rate would normally make a great deal of sense. But these aren’t normal times. As I noted earlier, the depreciations in the 1930s led to looser monetary policy globally. There was no “beggar thy neighbour” dimensions to them, and everyone benefited. And if the rest of the world still had materially positive interest rates, it could be the same now. Easier Chinese monetary policy, lowering the real RMB might have been followed by some cuts in interest rates in other major economies, to offset the impact on them of the increases in their own real exchange rate. But few large economies – and none of the advanced ones – has any material domestic monetary policy room (although the US can hold off – or reverse – the widely-expected unnecessary initial tightening in its own monetary policy). Even in high-interest rate New Zealand, the policy room is dissipating. Against that backdrop, any substantial depreciation of the yuan, even if it would be in China’s own macro-stabilisation interests, as its economy has slowed markedly, really could be a threat to the rest of the world. A stimulus to demand in China risks being substantially at the expense of weaker demand elsewhere, at a time when overall global demand growth (China included) is at best modest, and probably weakening. More competitive Chinese producers would be in a position to cut prices further – in an economy where producer price inflation has been negative for a long time already – posing new global deflationary risks.
Much of the media commentary this week has been about what the Chinese authorities intended. And understanding that better would be good. But, in the end, policymakers’ intentions matter only so far, once authorities have set out on a path, however halting, towards liberalisation. There has been a widespread view until recently that the Chinese would not be willing to devalue the RMB – whether for reasons for international relations, prestige or simply having bought the upbeat stories about China’s growth prospects. Meanwhile, Chinese investors have been taking a different view.
This week’s action must have increased the perceived risk of some larger adjustment, whether willingly or not. Many people have pointed out the size of past substantial devaluations – I especially liked this piece – but often enough those large devaluations (or float) were late adjustments, forced reluctantly on authorities who held on, and held on, until they could do so no longer. No two countries’ situations are ever quite alike, but we shouldn’t assume that even if the Beijing authorities don’t want a large exchange rate adjustment that it won’t happen.
Much of the most recent real appreciation in the yuan reflected the material appreciation in the USD. Some will recall that the continued appreciation of the USD, to which the Argentine peso was pegged, was one of the final straws that broke the Argentine currency board in 1991.
[1] In addition, Venezuela – which now has extreme currency rationing to defend an official peg – is recorded with a 251 per cent increase in its real exchange rate.


