Investor finance restrictions: the Reserve Bank asserts a right to secrecy

The Reserve Bank has been consulting on a proposal to ban any lending with an LVR greater than 70 per cent to residential property rental businesses in Auckland.   I have been noting that the Governor acts as investigator, prosecutor, judge and jury in his own case in matters like this. I have also noted the contrast between the way the Bank handles submissions on its consultative documents, (releasing only a (self)-selected summary after the final decision has been made), with the process used in respect of submissions to parliamentary select committees, in which submissions are published (and the committee members are not themselves final decision makers on legislation).  This is a serious democratic deficit –  a unelected decision-maker keeping secret submissions on major economic policy initiatives, which will have pervasive effects on potential borrowers and on the efficiency of the financial system.

Under the Official Information Act, I asked for copies of the submissions the Reserve Bank has received on the Governor’s latest proposed controls.  This afternoon I received the letter below, refusing my request (it is, however, far the fastest they have responded to any of my OIA requests).

I have no idea whether their stance is legal, and will consider lodging a complaint with the Ombudsman, on the grounds that there is a strong public interest in having this information available.  Whether or not it is legal, it hardly seems wise for an unelected individual who exercises so much power, and who has already been challenged as having apparently misrepresented material in his consultative documents and responses to submissions.

There is a serious democratic deficit in the way the Reserve Bank is structured.  The Governor could choose to allay some of those concerns by the way he operates, but instead he adopts a secretive style while one individual makes these decisions, which appear to be at best weakly justified under the provisions of the Reserve Bank Act, which require its powers to be used to promote the soundness and efficiency of the financial system.  It is difficult for the public to have trust in a Governor who will not even make public the submissions he receives on his proposals, and is himself responsible for any summary of submissions that may later be published.

Dear Michael

On 14 July you made an Official Information request seeking: Copies of all submissions made to the Reserve Bank on the proposed changes and extensions to LVR restrictions.

The Reserve Bank recognises that there is a tension between the public interest in full disclosure and the statutory requirement to maintain the confidentiality of information we use to regulate banks. In order to balance transparency with confidentiality, our long-standing practice is to publish a summary of submissions rather than publish original documents submitted to us. We currently have work underway to publish a summary of submissions relating to our consultation on adjustments to restrictions on high-LVR mortgage lending.

Official Information Act section 16(2) says that we should provide requested information in the way that a requester prefers to receive it, unless doing so would:

(a)    impair efficient administration, or

(b)   be contrary to our legal duty in respect of the document.

Official Information Act section 16(1)(e) allows that information may be made available by giving an excerpt or summary of the contents.

Much of the information contained in the submissions that you have requested must be withheld in order to comply with the confidentiality provisions of section 105 of the Reserve Bank of New Zealand Act, and it would be administratively inefficient to publish our summary and repeat the work of summarising by redacting documents that are already being summarised for publication.

Accordingly, your request is refused on the following two grounds of the OIA:

  • s18(c)(i) – providing some of the information would be contrary to another Act; in this instance, section 105 of  the Reserve Bank of New Zealand Act, and
  • s18(d) – that the information is or will soon be publicly available; in this instance, as a summary.

The Reserve Bank expects to publish its summary of submissions near the end of August. The summary of submissions will include names of people and organisations that provided submissions, which gives you the option to directly approach submitters to ask if they will provide you with the information you’re seeking.

You have the right to seek a review of the Bank’s decision under section 28 of the Official Information Act.

Yours sincerely

Angus Barclay

External Communications Advisor | Reserve Bank of New Zealand

2 The Terrace, Wellington 6011 | P O Box 2498, Wellington 6140

www.rbnz.govt.nz

From: Michael Reddell ] Sent: Tuesday, 14 July 2015 11:59 a.m. To: macroprudential Subject: RE: Submission on proposed investor finance restrictions

Thanks Daniel

This is to request, under the Official Information Act, copies of all submissions made to the Reserve Bank on the proposed changes and extensions to LVR restrictions.

Regards

Michael

How have we been doing in recent years relative to the US?

The US Bureau of Economic Analysis released overnight some revised GDP estimates, not just affecting the last couple of quarters (the bits that tend to attract more headlines than they are worth), but going back several years.  The overall effect was to revise lower estimates of US GDP growth over the last few years.  The previous estimates of growth had, of course, already been very low by historical standards.

I’ve been intrigued, and have posted previously, about how similar the paths of NZ and US GDP per capita have been since 2007, despite all the differences between the two countries’ experiences (financial crisis and not, terms of trade boom and not, earthquake reconstruction and not, and even quite different labour market experiences).  So I was curious to check what the chart  –  showing real GDP per capita –  looked like following the latest US revisions.

nz vs us gdp pc

Statistics New Zealand publishes separate production and expenditure GDP series, and not infrequently there are material divergences between recent years’ estimates of the two series.  SInce 2007, on current estimates, GDP(E) has grown more than 2 per cent more (in total) than GDP(P).   Analysts tend to pay more attention to the production measure (GDP(P), but that is partly for historical reasons (it used to be less volatile).  The differences will largely be revised away over time, but we have no obvious way on knowing now which will better be seen as representing history.  The final revisions, years hence, could be higher or lower than both series, or somewhere in the middle.  My hunch is that they will be a bit lower: I understand that SNZ uses PLT met migration to feed into its population estimates, but experience suggests that in periods of strong inward migration net PLT understates the actual net inflow.  The next census –  the check on the level of population  – is still a few years away.

If the GDP(E) line, as it currently stands, were to prove to be the final story, we might end up taking a little comfort that we had done a little better than the US over this period.  As it is, for now I’m sticking with emphasising the cumulative similarities in GDP per capita paths rather than the differences.  And if we had crept a little ahead in the last year or two, the chances of maintaining that lead don’t look overly good right now.

And don’t forget the employment (or productivity) picture.  We are estimated to have generated very slightly more income per capita growth since 2007, but employment here dropped from 65.9 per cent to 65.0 per cent of the population from 2007 to 2014.  In the US employment dropped from 63 to 59 per cent of the population over the same period.  For good or ill, it took them less of their population to generate much the same per capita output gains.  That represents much more productivity growth than we’ve seen here.

TPP

A few earlier posts touched on some issues around TPP.

I remain pretty uneasy about the likelihood of overall net benefits emerging from this deal for New Zealanders.

And since this is one of those polarising issues – at least in New Zealand – I should restate (in a perhaps over-simplified way) my priors:

  • The ability to trade freely in goods and services is generally good and beneficial
  • Unilateral removal of New Zealand’s own trade restrictions has generally benefited New Zealanders.
  • We should have gone further and removed our remaining tariffs and either abolished, or sharply constrained, our anti-dumping regime.
  • A liberal foreign investment regime is generally good and beneficial.
  • New Zealand’s foreign investment regime is less liberal than it could and should be.   (There may, however, be important exceptions to the general case for a liberal regime.  Had the Soviet Union sought to buy up a large contiguous chunk of Northland I’d have had no hesitation in supporting a ban.  And non-resident purchases of houses, especially houses that sit empty, on a large scale might also be an exception,  but only given the absurdities of our domestic planning and land use restrictions.)
  • Intellectual property protections appear to have generally gone beyond what is appropriate to foster a climate of innovation.  Copyright is the most obvious example.
  • Strong government institutions, and particularly those which protect and ensure the rule of law, are important to any successful and prosperous society.
  • A key element of the rule of law is equal treatment of the powerful and the weak.
  • The freedom for domestic Parliaments to adopt even daft and dangerous policies is an integral part of the sort of system of government that we inherited from Britain and have made our own.

So I’m pre-disposed to favour trade and investment liberalisation.  In general, the more the better.

But even the academic literature tells us that free-trade agreements among groups of countries are not the same, and don’t offer the same welfare gains, as more generalised free trade. The Australian Productivity Commission reminded us of that again just last month. Australia’s own FTA with the United States has generally been regarded as having secured few (perhaps even negative) benefits for Australians.

And it is already apparent that intellectual property protections are set to be extended in any TPP agreement.  That is a win for the owners of those properties – few of whom will be in New Zealand – but where is the evidence of a general welfare gains for New Zealand citizens, or indeed, those of other countries?   (And this is so, even acknowledging Eric Crampton’s in-principle point about free-riding and pharmaceuticals).

And why do we want to further entrench investor-state dispute settlement provisions (ISDS), that provide greater rights to foreign investors than domestic investors have? We should, primarily, be making New Zealand law in the interests of New Zealanders, and I have not seen a single serous argument for how that end is served by providing better remedies to foreign investors than to our own. Disputes about government policy should be fought out in domestic political arenas, and disputes on law should be fought in the domestic courts. For better or worse, we ended “foreign” jurisdictions (the Privy Council) in domestic law a decade or so ago.    I’m not suggesting that foreign investors are any better or worse than domestic businesses – but we shouldn’t treat them differently. As I noted in an earlier post, previous great eras of foreign investment flourished without the need for such additional protections.

And while perhaps it is true that key points in any negotiations go down to the wire, shouldn’t we be uneasy that at this very late stage, such indications as there are suggest that the prospects of trade liberalisation gains that matter to New Zealand don’t look good? Dairy gets a great deal of attention in our media, but I wonder just how important any progress on liberalising it is in any other capitals? There seem to be more countries who care about resisting liberalisation, or for whom it just doesn’t matter, than who really care much about securing more dairy liberalisation.   That doesn’t sound like a recipe that leaves our negotiators much leverage.

And no doubt there is considerable truth in the proposition that negotiations need to take place in private.  No doubt, equally, if there was a will there would have been a way to be more open than the TPP process has been. After all, we used to think domestic government deliberations should be protected from public scrutiny as well. Now we subject them to extensive consultative processes, and the scrutiny of, for example, freedom of information acts.

Negotiations in private are a delegation of responsibility, by New Zealanders to responsible ministers. And trust is an important dimension of any delegation. Perhaps trust might be a little higher if New Zealand had a Trade Minister who, however competent, comes out with statements like this

“This is a moving game, and we need adults to do this – not breathless children to run off at the mouth when the deal is not actually finished.”

I guess he is old enough to have been a public servant before the Official Information Act.  But after a decade in Parliament those sorts of attitudes really aren’t good enough –  perhaps the only saving grace is that he is indiscrete enough to say what perhaps others only think.

I’ve expressed concern previously about the momentum that takes hold in these sorts of processes.  These negotiations have been going on for years.  New Zealand ministers and officials have prided themselves on having a key administrative role in them.  So how willing is the government, really, to walk away, on a hard-headed (rather than wishful) assessment of whether any deal actually benefits New Zealanders.  And will other hard-headed governments think New Zealand will really be ready to walk?  On its own.

Our Trade Minister is rumoured to be about to head off to Washington as our next ambassador, and the Prime Minister appears to enjoy his good relationships with, and easy access to, people like the Barack Obama.  Basic agency theory suggests we shouldn’t just assume that their interests (or any other past or future ministers) are sufficiently aligned with those of the principals –  New Zealand citizens and voters.  To walk away might mean putting ourselves “outside the club”, whatever that specifically means.  At a time when the government appears to be revelling in its position on the UN Security Council (and I still struggle to take seriously the idea of New Zealand as a key player, whether in the cause of Middle East peace, or the Security Council veto), there might be more reasons than usual to question how willing the government will be to step away if only a bad economic deal is finally on the table.

Perhaps the issue won’t arise.  Perhaps Malcolm Bailey’s comments this morning that the current dairy offers (whatever they are) should be “unthinkable” for New Zealand are just part of some orchestrated positioning exercise, with a bit of MFAT choreography, to try to prod slightly better offers out of our trading partners. But, at the moment, what we read and hear in the media doesn’t sound promising.  It doesn’t sound enough for even those instinctively inclined to support liberalisation to think that we New Zealanders would be better off it we signed up.    Bad deals have been done in past –  the Australian-US FTA –  and we can’t just assume away the possibility.

Of course, if a deal is signed it will still have to be ratified by Parliament (and through domestic processes in other countries).   No doubt the government will have a rough ride through that process –  no matter what deal is signed –  but equally I’d have thought that the support of ACT and United Future shouldn’t be hard to secure, and that there is little serious threat to its ability to secure ratification.

But if an agreement is signed, it is going to be important that there is serious scrutiny of it before Parliament is asked to ratify it.  There will lots of vocal commentators, and no doubt some of them will make useful and reasoned points that contribute to the debate.  But we need more than that, on what will be quite a detailed agreement.  We need a serious independent assessment of economic implications of whatever ministers have signed.  Perhaps the Productivity Commission could be invited to oversee that analysis. As it happens, the Commissioners include a former Secretary to the Treasury, and a former Director-General of Agriculture.  I doubt that the Productivity Commission currently has the in-house expertise at present to do the detailed work itself, but with the ability to (for example) contract modelling expertise the PC should be able to make a useful assessment, better informing any pre-ratification debate.

How is core inflation going to get back to 2 per cent?

No doubt I should find something more useful to do, but out walking by the sea in the sun, one aspect of Graeme Wheeler’s speech, and story, was still puzzling me. How, except perhaps by chance, does he expect to get core inflation back up to the target midpoint again in the remaining two years of his term?

Recall that:

  • core inflation, at around 1.3 per cent, is a long way from the midpoint of the target range
  • the PTA mandates the Governor to focus on the “medium-term trend in inflation”, and on keeping “future average inflation” (not one year’s headline rate) near the 2 per cent target midpoint.
  • The Bank reckons real GDP is currently growing at an annual rate of around 2.5 per cent
  • And its best estimate of the rate of growth in potential GDP is around 2.6 per cent
  • Inflation expectations are quite close to the target midpoint – and lower, relative to target midpoint, than they have been at any time in the history of inflation targeting.
  • The Bank’s current estimate of the output gap (June MPS) is around zero.
  • And, although not mentioned in the speech, the unemployment rate is above any reasonable estimate of the NAIRU.

There is nothing in that mix that would tend to raise core inflation from where it is at present.

A conventional model would suggest that to lift core inflation, quite substantially, from around 1.3 per cent to around 2 per cent would take some combination of a lift in medium-term inflation expectation (what people are treating as “normal” rate of inflation when negotiating contracts, and borrowing and lending), and a period in which some fairly material pressures build up on resources (“excess demand”). Increased pressure on resources would require a period, looking ahead, in which growth runs faster than potential and, probably, where the unemployment drops below the NAIRU.

Perhaps any temporary increase in headline inflation, on account of the lower exchange rate, will boost inflation expectations a little, but any lift would be unlikely to be sustained without some new resource pressures

But where is this faster growth going to come from?  I searched the speech in vain. The Governor talks of a few factors that might “support” economic growth. He lists “continued high levels of migration and labour force participation, ongoing growth in construction and continued strength in the services sector”. But note the repeated word: “continued”. We’ve had all these things over the last 12-18 months, and they generated “a little below trend growth”. Big increases in immigration boost growth rates, but steady high rates of immigration just, at best, maintain them. Construction activity had stepped up a long way over the previous couple of years, but few commentators (or indicators) suggest the rate of growth will be sustained. And all this is before the decline in the terms of trade – which easier monetary conditions may or may not adequately offset – has had its full effect, on the farm or in the wider economy.

If the rate of potential growth really is around 2.6 per cent, then it increasingly looks as though New Zealand needs two or three years of perhaps 4 per cent growth to be confident of getting core inflation to settle back around 2 per cent. If the NAIRU is 5 per cent, perhaps we need a couple of years with unemployment down around 4.5 per cent to lift core inflation back to around the target midpoint.

These are the sorts of outcomes we might have had in a more normal recovery. But – partly because monetary policy has been kept too tight – our recovery has been anaemic. At present, these sorts of outcomes seem likely only if the OCR is cut quite a bit more than the Governor currently seems to envisage.

But in a sense the ball is in his court. Perhaps he could tell us how he expects to see core inflation reverse the seven or eight years of decline, and get back to around the midpoint of the target range  What will boost growth sufficiently, and cut unemployment rate sufficiently, to put sufficient additional pressure on resources to achieve a substantial lift in the “medium-term trend in inflation”?

And all this assumes that the Bank is correct that growth is still around 2.5 per cent. We only have March quarter GDP data, and it is now almost half-way through the September quarter. I have seen some commentators suggesting that the June quarter may already have been weaker than would be consistent with 2.5 per cent growth. I have no idea if they are correct, but, if so, the challenges facing the Governor in getting core inflation back to target will be even greater than those I have outlined here.

In the speech, the Governor put quite some emphasis on the troublesome clause 4(b) in the PTA, and especially the highlighted words

In pursuing its price stability objective, the Bank shall implement monetary policy in a sustainable, consistent and transparent manner, have regard to the efficiency and soundness of the financial system, and seek to avoid unnecessary instability in output, interest rates and the exchange rate.

I describe the provision as troublesome because ever since Don Brash and Michael Cullen added it to the PTA no one – Bank, Minister, Board, markets – have ever known quite how to apply it. I’d just make two observations:

  • The medium-term price stability objective is paramount, and the medium-term trend in inflation is currently a long way from the mandated target midpoint.
  • Against that backdrop, more (upside) variability in output growth looks to be necessary.  Few people object to extra growth, especially when the starting point is one of no apparent pressures on resources or core inflation and lingering high unemployment..

Falling commodity prices and the unsettled world environment mean that it would be difficult for the Bank to deliver a couple of years of 4 per cent annual GDP growth even if they set out now to try. But as things are heading at present, the risks of something rather closer to 0.4 per cent growth are rising. Better to aim for 4, and perhaps deliver 2.5. If 4 per cent growth actually happened, inflation would start heading back to target and more of the people currently unemployed would be in jobs. And if only 2.5 per cent growth was achieved it might be enough to stop unemployment rising again. From where we stand right now, it is far from obvious what is lost, or even risked, by a more aggressive stance.

PS:   As it is, in pondering the Bank’s record on inflation in recent years –  it just isn’t there when they think it will be –  the old rhyme came to mind:

Yesterday upon the stair

I met a man who wasn’t there

He wasn’t there again today

I wish, I wish he’d go away

When I came home last night at three

The man was waiting there for me

But when I looked around the hall

I couldn’t see him there at all!

Go away, go away, don’t you come back any more!

Go away, go away, and please don’t slam the door

Last night I saw upon the stair

A little man who wasn’t there

He wasn’t there again today

Oh, how I wish he’d go away

What does the Governor say to the unemployed?

Graeme Wheeler yesterday gave a speech on current monetary policy issues and challenges. It was accompanied by an unusually long press release, and is probably best seen as a commentary, and elaboration, on the brief OCR statement released last week. I commented on that statement here.

I thought it was a very disappointing speech.

There is still no sign that the Governor recognises that he made a mistake in raising the OCR 100 basis points last year, in talking of further rate hikes as late as last December, and only beginning to cut rates in June. The fact that a mistake was made really should be blindingly obvious, even to him, by now. It should have been acknowledged and serious steps made to reverse it, and then we could move on. Instead, reluctance to acknowledge the mistake seems to have locked him into a mind-set in which he is now willing to cut the OCR as new weak data emerge, probably 25 points at a time, but is unwilling to unwind the excessively tight conditions he put in place last year. He repeatedly talks of GDP growth rates around 2.5 per cent as if these are good outcomes, but New Zealand’s population is estimated to have grown by 1.8 per cent in the last year. After an anaemic recovery, New Zealand is already experiencing weak per capita growth, before the full impact of the sharp fall in international dairy prices (let alone any threat from a weakening Asia) has been felt. And it is idle to talk repeatedly of the “need” for a lower exchange rate when he is personally deciding to hold the OCR at levels higher than the inflation target would appear to require.

Far too much weight in the speech is given to headline CPI inflation. As the Policy Targets Agreement has put it for years:

For a variety of reasons, the actual annual rate of CPI inflation will vary around the medium-term trend of inflation, which is the focus of the policy target.

The Governor has stated very explicitly in this speech that the Bank’s preferred measure of core inflation is the sectoral factor model measure. That measure it has its weaknesses, but it has the longest time series of any of the measures the Bank publishes, and it tends to be the measure I use most often too. As it happens, estimated sectoral core inflation over recent years has been being progressively revised downwards. And at 1.3 per cent now (and having been below 2 per cent for five years now) it is not just a “bit” (the Governor’s word) below the midpoint. For a very persistent slow-moving series, this is a huge deviation. “The medium-term trend of inflation” is nowhere near the 2 per cent target midpoint the Bank is required to focus on.

sectoral core

The Governor downplays this in two ways.

First, he explains away current low headline inflation mainly by reference to the fall in international oil prices and the rise in the exchange rate last year. Which is fine, and no serious observer is focused on headline inflation. But the Governor doesn’t mention tobacco tax increases, which have “artificially” and substantially boosted headline inflation in recent years. The Governor quotes the PTA to the effect that headline CPI inflation might deviate from the medium-term trend because of “shifts in the aggregate price level as a result of exceptional movements in the prices of commodities traded in world markets” [ie oil prices], but doesn’t mention that the next reason listed in the PTA is “changes in indirect taxes”. As I noted last week:

• Even with the rebound in petrol prices, CPI inflation ex tobacco was -0.1 over the last year – this at the peak of a building boom.
• CPI ex petrol inflation has never been lower (than the current 0.7 per cent) in the 15 years for which SNZ report the data.

We develop core inflation measures to adjust for these sorts of effects. Five and a half years with core inflation (on their own preferred measure) below the target midpoint, by slowly increasing margins, is a sign of a Bank that has got monetary policy repeatedly wrong. And that matters more under Graeme Wheeler, because he explicitly signed up to the focus on the target midpoint. Alan Bollard, by contrast, could (and did) point out that the midpoint had no special status in his PTAs.

And then the Governor tells us that he expects inflation to be back to target midpoint by the middle of next year. But here he is not talking about the “medium-term trend of inflation”, but about headline inflation. All else equal, if oil prices and the exchange rate stay around current levels, headline inflation is likely to pick up somewhat over the next 12 months. But the speech says nothing at all about the expected path of core inflation, or medium-term inflation measures more generally. A lower exchange rate provides a boost to the domestic price level, all else equal, but that just means the headline inflation rate rises for a year or so. What happens after that? As the Governor acknowledges, the Bank has overestimated medium-term or core inflation in recent years, but he offers us nothing, at all, to give us reason to believe that that situation has changed.   There is no sign of any correction to what has led them astray for the last few years.

For the last 15 years or so, the Bank has generally sought to “look through” the direct price effects of exchange rate changes, precisely because they usually tell us little about the underlying state of inflation pressures. Doing anything else – putting much weight on those direct effects in setting policy – risks the Bank holding the OCR higher than the medium-term trend in inflation would warrant. Not just the PTA, but plenty of good economic theory also, encourages the Bank to focus on the stickier prices, captured in (for example, and imperfectly) non-tradables or core measures.

In fact, some of the Bank’s own quite recent research suggests that we might not see even much of an increase in headline inflation. Here is one of their researchers, Miles Parker, in a paper published last year:

The net impact of a fall in the international prices of the commodities New Zealand exports  on the consumers price index (CPI) has been to lower New Zealand consumer prices, even  though the exchange rate has tended to fall when export commodity prices fall. Falls in  export commodity prices leave New Zealanders as a whole poorer and so domestic  spending, and pressure on domestic labour and capital, tends to ease. For exchange rate depreciations caused by other factors there appears to have been little net effect on  aggregate consumer prices, since a rise in tradable CPI inflation has been broadly offset by  a fall in non-tradable CPI. For each of these classes of exchange rate changes, the inflation  outcomes implicitly include the average response of monetary policy to such exchange rate movements over the period.

In other words, falls in the exchange rate happen for a reason, and have often been accompanied by such a significant weakening in economic conditions that they have often been associated with further falls in non-tradables and core inflation measures. That has to be a real risk now, as falling real (terms of trade) incomes and slowing growth in construction activity take hold.

What else is there to say? A few scattered observations:
• The Governor rightly observes that “in most advanced economies, policy interest rates are at historic lows”, but one could go further. In all OECD countries, except New Zealand, policy interest rates are lower (or no higher) than they were at the start of last year. New Zealand has seen no sign of the sort of medium-term inflation pressures that would have warranted – or warrant now – such a stance. The Bank thought such pressures would emerge, but they were wrong. Mistakes happen, but they need to be acknowledged and corrected for.
• I find it extraordinary that the Governor continues to articulate a view that high immigration has eased inflation pressures (outside the Auckland house market presumably). Until the last 12 months or so, the Reserve Bank has for decades consistently operated on the assumption, well-supported by data, that (whatever the possible long-term benefits) the short-term demand effects of immigration dominate the supply effects. Indeed, that result is apparent in the Bank’s own quite recent published research. Here is a picture from a 2013 Analytical Note

chris mcdonald
• It is puzzling that there is no mention of unemployment in the speech at all. It isn’t a fool-proof indicator by any means, but is probably better estimated and more easily interpreted that output gap estimates which the Bank continues to rely on (despite the inability of the Bank’s existing models to explain inflation). At 5.8 per cent, New Zealand’s unemployment rate is still disconcertingly high. It is all very well to laud rises in the participation rate, but there is no evidence that New Zealand’s NAIRU is anywhere near as high as 5.8 per cent. Many real people – with lives currently blighted by unemployment – would have been back in jobs if the Reserve Bank had not set the OCR so high over the last 18 months. What, I wonder, does the Governor have to say to these people when he meets them?

• This passage in the speech seemed particularly ill-judged:

Central bankers have found the post Global Financial Crisis (GFC) years to be a very challenging time for conducting monetary policy. High expectations have been placed upon central banks at a time when the economic, financial and political interlinkages in the global economy seem more complex, and where monetary policy has become the fall-back policy to promote a strong global recovery.

Few people will have much sympathy with highly-paid powerful officials bemoaning how difficult their job has been in recent years, as the Governor seems to.  He has options.

Many of the problems central banks in other countries have faced relate to running into the near-zero lower bound on nominal interest rates. New Zealand (and Australia) have not yet got anywhere near that floor. There is no evidence of “high expectations” having been placed on the Reserve Bank of New Zealand – indeed, the dismal inflation track record, with no obvious adverse consequences for the Bank, might suggest a central banking equivalent of the “soft bigotry of low expectations”. The Governor complains that “monetary policy has become the fall-back policy to promote a strong global recovery”. Most New Zealanders would have settled for a strong domestic recovery, but we just have not had one. It has been the weakest domestic recovery for many decades, despite the record terms of trade, and the boost to demand from a Christchurch-led building boom.

In a sense, the whole point of discretionary monetary policy is to allow monetary policy to promote strong bounce-backs when demand falls away and recessions happen. With hindsight it is clear that lower policy interest rates over the last five years would have given us both a stronger recovery, and a medium-term trend in inflation nearer the inflation target. There were no policy obstacles to doing so. I’m not suggesting there are no puzzles in the global events of the last few years, but if you have trouble reading the future, just look out the window and respond to the best estimates of the medium-term trend in inflation. Core inflation has been below target midpoint since December2009, and not once – not for a single quarter – has the OCR been cut below the level that prevailed back then.

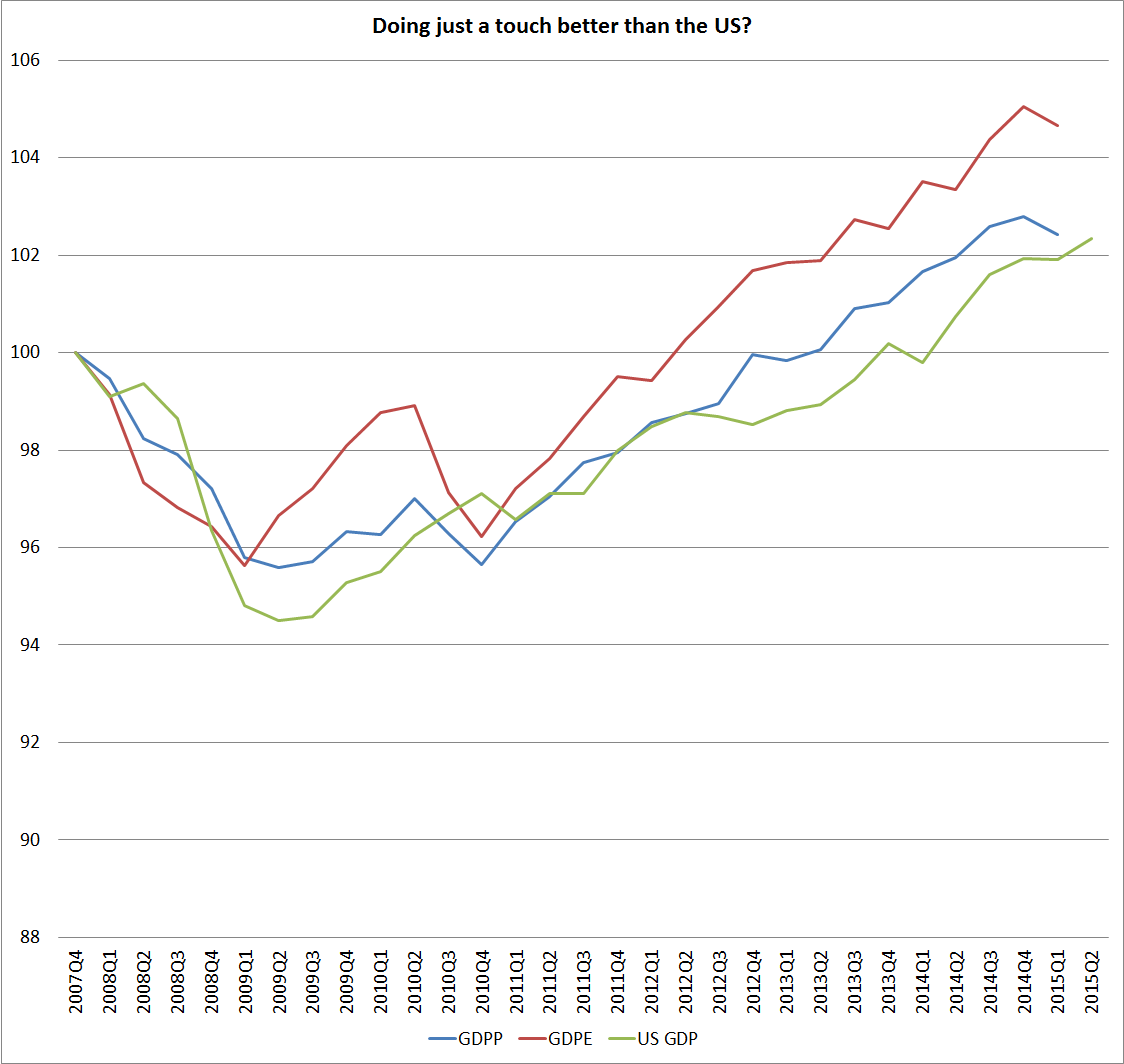
• The Governor repeats a claim that “our economy has generated better growth…than many other advanced economies”. As I have documented on several occasions, and in several ways, while our total GDP growth has been relatively high, that is only because our population growth has been much faster than most. Growth in GDP per capita, or in any of the productivity measures, has been no better than mediocre, even relative to other countries’ weak performances. Quite why we have done so badly is still a bit of a puzzle, but endless repetition of an alternative wished-for story does not make it true.

• Somewhat puzzlingly the Governor claims that “some local commentators have predicted large declines in interest rates over coming months that could only be consistent with the economy moving into recession”. Actually, it isn’t only local commentators, but set that to one side. With core inflation measures so low, and no evidence adduced that core inflation measures are about to rise materially, it would be quite easy to make the case for a 2 per cent OCR right now. There was never any need for the OCR to have been raised at the start of last year (from 2.5 per cent) and core inflation pressures and measures are weaker now than they were then.  At present, with the threat from a weakening Chinese economy increasing, the risk is that having held the OCR too high for too long materially increases the chances of a couple of quarters, or more, of negative GDP growth. And the Governor needs to get some perspective on the scale of short-term interest rate falls that tend to happen in real recessions: 700 basis points over the 1991 recession, 550 basis points in the mild 1997/98 recession, and 575 basis point OCR cuts in 2008/09.  Against that background, arguments as to whether the OCR gets to 2.5 per cent or 2 per cent, from a recent (ill-judged) peak of 3.5 per cent, are interesting but bear no relationship to what any serious recessionary threat might require.

There are many more points I could make. There are puzzling sentences like “having the scope to amend policy settings, however, is a key strength of the monetary policy regime”. I’m not sure when anyone last suggested a regime in which policy settings could not be amended, but perhaps I missed something.  But I’ve probably taxed readers’ endurance enough already.

New Zealand deserves a lot better than this: better policymaking and better quality analysis and communication of the issues. And, of course, it is increasingly past time for reform of the governance of the Reserve Bank, to put considerably less power in the hands of one imperfect individual, the Governor (any Governor).

Meanwhile, what does the Governor say to any of those 146000 unemployed people he meets?

Reforming the governance of the Reserve Bank

The Green Party leader, James Shaw, has just put out a press release highlighting the Reserve Bank’s persistent forecasting errors, which have had the effect of keeping the number of people unemployed higher than it would otherwise have been in recent years.  James Shaw uses that record to reinforce the argument that too much power is vested in a single unelected individual, the Governor, and that the governance model of the Reserve Bank should be reformed, as (for example) The Treasury has previously argued.

As I have noted previously, the Bank’s serious forecasting errors are not primarily the fault of the single decision-maker model.  There was, unfortunately, widespread support at the Bank last year for the OCR increases, and it would have been hard even for a more independent committee to have resisted the push for the early increases.  But the succession of policy mistakes (eg having twice had to reverse OCR increases in the last five years) does reinforce the more fundamental arguments for a better, and more conventional, governance structure for the Reserve Bank.  It is not governed the way most central banks are, or the way most New Zealand government agencies are.  Even among central banks, only the Bank of Canada puts the legal authority to set the policy rate with the Governor alone, and the Bank of Canada Governor has a much less extensive range of powers than Graeme Wheeler (and his predecessors) have had.

I outlined my own case for governance reform here.

The Reserve Bank itself has been working on the issue.  I lodged an OIA request some time ago for

copies of any papers done by the Reserve Bank on statutory governance issues in the last two years  (i.e. since 1 July 2013).  To be specific, I am requesting:

  • any papers (draft or otherwise) provided to Treasury or the Minister of Finance on these issues
  • any papers provided to the Governor or the Governing Committee on these issues
  • any internal working or discussion papers on governance issues
  • any file notes or other records of discussions on these issues between the Governor, and the Secretary to the Treasury and/or the Minister of Finance.

The Bank has just extended my request for another month, telling me that they have found 9786 records or documents they need to check.  I suspect that means the initial search wasn’t very well-targeted, but there should be a few interesting documents to emerge in a month or so.  It will be interesting to see what model of change the Bank would prefer, if and when change comes, and their assessment of the pros and cons of the various approaches to dealing with the governance of the wide range of issues the Bank is given responsibility for.

It is a shame that the current government appears unwilling to address the issue.  It is one of those areas where change will almost certainly come, to bring Reserve Bank governance into line with modern public sector practice and the current responsibilities of the Bank.  It won’t surprise readers that I’m not a natural supporter of many Green Party issues, but I give them considerable credit for continuing to chip away at this issue.

Dairy lending and the Minister of Finance

I saw this Bernard Hickey piece yesterday afternoon, and have been mulling on it since.

Finance Minister Bill English has admitted the Government and Reserve Bank are in discussions with banks to ensure they don’t prematurely force dairy farmers into mortgagee sales that could trigger a dangerous spiral lower in land values.

If accurately reported (which it may not be), it is somewhat disconcerting.  What bothers me is the notion that the Minister of Finance (and perhaps the Governor of the Reserve Bank, although there is no confirmation of any involvement by the Bank) thinks he knows better than banks how to run their own businesses. Ministers of Finance often aren’t very good at presiding over the government’s own businesses – Solid Energy or Kiwirail anyone?

During the 2008/09 recession I did quite a lot of work at Treasury on dairy debt. Debt, and dairy land prices, had run up extremely rapidly in the previous few years, and there was concern about what the fall in commodity prices, and the seizing up in international funding markets, might mean for the dairy sector as a whole, and for those who financed them. I reminded the perennial optimists that the long-term real average dairy payout had been around $4.50 and that it would seem unwise to be planning (whatever one might hope for) on anything much higher in the medium-term future.

During that period, I took to describing dairy debt as “New Zealand’s subprime”. My point here was not that large losses were inevitable (in fact, in that episode NPLs did pick up quite notably, although not in a systemically-threatening way), but that the nature of the risk exposures were not generally well understood. At the time, banks were very dependent on wholesale market funding, and few offshore investors appreciated just how large New Zealand banks’ exposures to farms were (I recall checking out the US flow of funds data and finding that in an economy 100 times our size, farm debt in the US was only around 10 times that in New Zealand).

It was also never entirely clear that the Australian parents really appreciated the scale of the dairy debt boom, and competitive credit-supply war, their New Zealand subsidiaries had gotten into. And, of course, the market in agricultural land was not the most liquid in the world – like many markets there was reasonable liquidity in booms, and almost none in busts.   That illiquidity meant that it was very difficult for anyone to know the true value of the collateral underpinning dairy debt. As it was, dairy land prices fell very sharply (and never subsequently fully recovered the boom time peaks) even with very few forced sales. One of the risks of lending secured on farm land was that if one lender got very worried and starting a round of forced sales, it would seriously undermine the market value of the collateral other banks were holding. They all knew that – and they also knew about the goodwill in the rural community that had been burned off in the period of financial stress in the 1980s. And that created an incentive for what I describe as “hand-holding” – each tacitly agreeing (probably not in ways that create legal difficulties) to approach forced sales very very cautiously. That might seem a good outcome in some respects, albeit at the expense of transparency. In 2009 perhaps, with hindsight, it was: the downturn in dairy prices proved short-lived, and the recovery in the payout bought time for banks to manage out of their worst exposures.

But we didn’t know then, and we don’t know now, how long the low payouts will last for, and what either a market-clearing or equilibrium price for dairy land is. And when I say “we”, I include experts, stray bloggers, and the Minister of Finance and the Governor of the Reserve Bank. Uncertainty is a key feature of economic life, and one that people in positions of power too readily underestimate. There is probably a selection bias – people without a strong self-belief (and belief in their own views) tend not to end up at the top of politics. In some dimensions, the current position seems more worrying than the 2009 episode. Not much new debt has been taken on in recent years, and there hasn’t been a recent spiralling-up in land values. That suggests little risk of a systemic threat to the health of the banking system (but as I have noted previously it is not clear that the minimum risk weights the Reserve Bank requires on dairy exposures are really high enough). But, on the other hand, whatever is dragging milk prices so deeply down now is not the side-effect of a global liquidity crisis, the direct effects of which were reversed pretty quickly. Global commodity prices have now been trending down for several years, and there is little obvious reason to expect the trend to be reversed – although no doubt there will be plenty of volatility.

Perhaps there is nothing more to this story than a natural politician’s desire to sound sympathetic to business owners who find themselves in difficult conditions. I hope so.  But the Minister of Finance and the Governor of the Reserve Bank hold a lot of power over banks, and the fact that those statutory powers exist suggests it is even more important that the Governor and Minister avoid putting pressure on banks to make decisions that might suit a politician, but might not be in the interests of bank shareholders. Banks aren’t popular, but they are legitimate and important businesses, who are expected to make a return and act in the best long-term interests of shareholders. Plenty of times some discerning forbearance may have helped through a key customer in difficult times, but forbearance – whether by bank or regulator – can also be a recipe for worse problems, and bigger losses, down the track. The risks of that are much greater when people with no financial stake weigh in to try to tilt the attitudes of lenders. Neither the Minister nor the Governor has the information to make those calls well regarding dairy debt. In the Governor’s case, it is little more than a year since he gave this relentlessly optimistic speech, and I’m sure that without too much difficulty I could find similar examples from the Minister of Finance – it is, after all what ministers do.

Here is a link to my own piece on dairy debt from a couple of months ago.

Are we really better off than everyone but the US and Canada?

Yesterday I wrote that

the single economic issue that I care about most is reversing the decline in New Zealand’s relative economic performance that has been going on, in fits and starts, since at least the middle of the twentieth century, if not longer.

A few minutes after posting that I noticed a story about some new work by Arthur Grimes and Sean Hyland of Motu, in which they suggest that perhaps there isn’t a problem at all.   One of the authors was also nice enough to get in touch and alert me to it.   As they put it

“…New Zealand households have amongst the highest material living standards in the world”

They have quite a long technical working paper, which I have dipped into to answer some specific questions but have not read in full. But the seven page Motu Note, “The Material Wellbeing of New Zealand Households” tells, and illustrates, the story in a very accessible way. It also covers some consumption inequality results which I’m not going to touch on here at all.

Grimes and Hyland attempt to develop a measure of material wellbeing, using as their basis the durable goods held by households that have a fifteen year old in them.

This framework is applied to household level data from the OECD’s Programme for International Student Assessment (PISA) surveys, which include questions regarding the presence of household durables in the 15-year-old respondents’ homes, covering 16 consumer goods which range from the inexpensive (books), to expensive consumer durables (cars), whiteware (a dishwasher), utilities (an internet connection), and housing characteristics (the number of bedrooms and bathrooms in the house). This allows us to construct a dataset of household possessions for almost 800,000 households, covering 40 countries in the years 2000, 2009 and 2012.

And here is the picture with the headline-grabbing results. Having had below-average growth for the previous 12 years, these New Zealand households had, on this measure, material living standards in 2012 higher than the PISA-15 year olds households in all the other countries, except Canada and the United States.

grimes hyland

I found the exercise (which has been funded by a Marsden Fund grant) an interesting one, and yet I wasn’t really convinced. Here are some of the reasons:

  • How confident are the authors that PISA sample schools have been selected on the same basis in each country they look at?  PISA isn’t mainly designed to generate wellbeing measures, and any differences there will immediately flow into these durable consumption results.  I have read stories previously of strategic national selection of PISA sample schools
  • The general thrust of recent literature has been towards measuring some concept of wellbeing broader than GDP (or GNI, or –  better still – NNI, the gross income of New Zealanders, less depreciation).  It wasn’t clear to me why this particular subset of types of households, and types of consumption, should be thought superior to even traditional measures of consumption.
  • It wasn’t clear to me why durables consumption should be considered particularly important (except perhaps that the data are available in this sample).
  • Since the authors only look at the possession of these durables, not at the cost of them, they don’t factor in how much the cost of these items might squeeze out other consumption.  As a simple example, Amazon books are much more expensive here than in the United States (on account of transport costs).  We have a lot of them in our house, and less of other stuff than we otherwise would.
  • Perhaps these results might be relevant to child poverty debates, but we are typically more interested in how a country’s economy supports the consumption of all types of households within it.
  • Since the birth rate in, say, New Zealand, is much higher than that in, say, Italy, a typical Italian household with a 15 year old probably has 0-1 sibling, while a New Zealand household has 1-2.  In what sense are the consumption results then comparable?
  • And what about the many other consumption items.  For example, clothes, or restaurant meals, or foreign holidays (the latter more costly here than in, say, Belgium).  Perhaps access to beaches and mountains is a plus here, but access to good newspapers, and great museums and art galleries certainly weighs in favour of people of most of these countries over New Zealand.  And what of health or education spending –  actual individual consumption, but often provided by the state?
  • While it is reasonable to prioritise consumption over production, we know that savings rate vary quite widely across advanced economies.  Today’s savings support tomorrow’s consumption.  GNI (or NNI) measures provide a better sense of the consumption possibilities an economy generates than a particular subset of current consumption.

In wrapping up this post, I’m going to leave you with two charts.

The first is from the 2011 World Bank International Comparisons Programme. They have developed a measure of actual individual consumption, across almost all countries, at purchasing power parity values (ie adjusting for the differences in what things cost across countries). Here are the per capita results for the subset of OECD-Eurostat countries (a slightly larger group than Grimes and Hyland use).

aic

Of these 46 countries, New Zealanders’ average consumption – across types of people – falls squarely in the middle of the pack, well behind most of the older OECD countries. Our ranking here looks quite similar to the rankings people are familiar with from GDP per capita, or even NNI per capita, charts. It isn’t a perfect measure, but it is much more comprehensive that the Grimes-Hyland one, and it isn’t obvious why it is misleading us about the material aspects of life in New Zealand relative to other advanced countries.

The final chart is just relevant to the New Zealand vs Australia comparison. On the Grimes-Hyland measure we score very similarly to Australia. Frankly that seems implausible as a representation of relative material living standards. Why? Because for fifty years large numbers of New Zealanders (net) have been leaving New Zealand, overwhelmingly for Australia.  Very few Australians have come the other way. There is quite a lot of cyclicality in the flow, but the trend is very clearly in one direction only.

cumulative plt since 1960

It wasn’t that way when more traditional GDP per capita estimates suggested that New Zealand and Australian economies were level-pegging. I entirely agree with authors who say that GDP per capita (or even NNI per capita) are not the be-all and end-all. People don’t change countries based on national accounts aggregates, or other international agency wellbeing measures. They are presumably changing countries because they believe the new country offers sufficient better material living standards, for them or their children, to offset the loss of the intangibles of home, extended family, and a culture and institutions one knows.   The choices people make reveal their preferences, and it is unlikely that over decades they’ve got it systematically wrong (after all, they could have come home again, as many did). None of us knows how much poorer material living standards are here than in Australia, but we can be pretty confident they are now, and have been for some decades, worse.

(Real researchers can stop reading here, but..) I helped the 2025 Taskforce put together their first report, on closing the gap with Australia. The report focused on policy, and as the primary underpinning for the analysis used national accounts measures, but at their request I put together this – purely illustrative – box. I stress the words “purely illustrative”- it was a matter of what I could find quickly. It isn’t comprehensive, but – as the box concludes – that is why we have, and try to improve, national income and expenditure accounts. 


Box 1: What do Australians get with their higher incomes?

Digging down to look at what people in the two countries actually consume can give a more tangible sense of the differences between New Zealand and Australian material living standards. Again, what is important in different climates varies, and tastes differ. But comparing living standards in New Zealand and Australia is easier than in most pairs of countries because the tastes and expectations are broadly similar.

These data are sometimes less reliable than the national accounts. Sometimes they are not compiled by national statistical agencies but by industry bodies. Even when statistical agencies are involved, things aren’t always measured exactly the same way in different countries. There is no single decisive fact. This box simply illustrates that across a very wide range of things that different people value or like to consume, the typical New Zealander has less than the typical Australian. Starting with where we live: the average size of a new Australian house or apartment built in 2007 was 212 square metres. In New Zealand, the comparable average was 193 square metres. Or what we drive: Australians have 619 cars per 1000 people, while New Zealanders have 560.

New Zealanders work more to earn our lower incomes: 887 hours a year are worked per head of population, as compared with 864 hours per head in Australia. Australians live longer: 81.1 years, compared with 80.2 years in New Zealand. Fewer people in Australia (111 per 100,000 people) die of heart disease each year than do in

New Zealand (127 per 100,000 people). Many fewer people die on the roads there: 7.8 each year per 100,000 people in Australia, 10.1 each year in New Zealand.  Australians have more televisions (505 per 1000 people) than New Zealanders do (477 per 1000 people). And there are more broadband subscribers (10.3 per 100 people, compared with 8.1 per 100 in New Zealand).

There are more cinemas per million people in Australia (92.4) than in New Zealand (82.2). And more mobile phones too (906 per thousand people versus New Zealand’s 861 per thousand). Australians drink more than New Zealanders: both alcohol (9.8 litres per capita versus 8.9 litres) and fruit juice (34.4 litres per capita versus 24.8).

This isn’t comprehensive by any means – that is why we have national income accounts. And there are some measures on which New Zealanders have more than Australians. Australia has 34.9 McDonalds outlets per million people, but New Zealand has 36.9 per million.

Lending to investors: still no smoking gun

I hadn’t paid any attention to the Reserve Bank’s new data providing somewhat more disaggregated information on new (ie the flow not the stock) residential mortgage lending. But the Herald’s cover story this morning sent me off to have a look.

There is only 10 months of data, and the housing market has some seasonal features. And the mortgage market has already been distorted by the Reserve Bank’s first set of LVR controls – which were always likely to have impinged most heavily on first-home buyers – so we aren’t even getting a clean read on the underlying patterns of mortgage demand.   But, from my perspective, the data reveal very few surprises, and the only thing that really took me by surprise was a pleasant surprise.

Here were a few of the points I noted as I worked my way down the Bank’s spreadsheet:

  • By value, 69 per cent of new mortgage loans over these 10 months were to owner-occupiers.  30 per cent were to “investors” (they have a residual category called ‘business” accounting for around 1 per cent).  According to the most recent census, the proportion of houses that was owner-occupied was less than two-thirds.  (The two numbers aren’t directly comparable, as local councils and Housing New Zealand own significant numbers of rental properties.)
  • By number, 81 per cent of new mortgage loans over these 10 months were to owner-occupiers.
  • By value, 15 per cent of loans to owner-occupiers were to first home buyers.  That might have been a touch lower than I expected.  First home buyers will generally be borrowing a larger proportion of the value of the house, but will also be buying cheaper houses.  FHBs will have been disproportionately squeezed by the Reserve Bank’s LVR controls.
  • By number, 8 per cent (by number) of owner-occupier loans were to FHBs over this period, but they accounted for a third of all owner-occupier loans with LVRs above 80 per cent.
  • Investors accounted for only 11 per cent (by number and value) of over 80 per cent LVR loans.
  • By number, 27 per cent of new FHB borrowers were borrowing in excess of 80 per cent LVR, and about 4 per cent of other owner-occupier, and investor borrowers.

high lvrs

  • 46 per cent of new investor loans were for LVRs of over 70 per cent (for some reason, the Bank is not collecting/reporting this data for the other categories of borrowers).

Almost all of that was quite unsurprising. And note that although the Herald devotes a lot of space to contrasting “first home buyers” with “investors”, it would seem more natural to compare all owner-occupier borrowers with all investors. Just possibly a comparison between FHBs and “first investment property purchasers” might be interesting, but we don’t have that data.

Perhaps the one thing that surprised me a little was how little high LVR lending has been going to investors over this period. Unfortunately, the period is distorted by the Bank’s controls, and it is at least possible that banks have been favouring FHBs since the LVR restrictions were put in place. And although the reporting is done at a highly aggregated level, I have heard stories of an upsurge in the proportion of loans being written by 79 per cent LVRs. If so, there is little or no effective risk reduction.   The Reserve Bank keeps on asserting that 70 per cent LVR loans to investors are just as risky as 80 per cent loans to owner-occupiers, but as Ian Harrison has been arguing, as yet they have produced little or no robust evidence to support that assertion.

I suppose what I take from these data is that, once again, there is no smoking gun to justify the Governor’s apparent determination to ban banks from lending a cent to residential rental services businesses in Auckland, when they have even a moderately high LVR.   Banks and borrowers are deeply irresponsible, and the Governor knows better….or so we are apparently to believe.   Recall that, across the whole country, between 3 and 4 per cent of new investor mortgages in the last 12 months have had initial LVRs in excess of 80 per cent.  Even if the number is double that in Auckland (and I’m not aware that anyone has that data), it hardly has the feel of reckless lending or borrowing behaviour.

The Reserve Bank has produced no evidence of any serious deterioration in lending standards. Add into the mix the still rather modest rate of growth in overall household lending, and the very encouraging results of the Reserve Bank’s own 2014 stress tests, and the case for such intrusive restrictions – with all the attendant efficiency and distributional costs – imposed by a single unelected official, is just not convincing.  Even if there were more substantial evidence to support the Governor’s concern, the soundness and efficiency of the financial system –  the only goal towards which the Bank can use its powers –  would be at least effectively protected, at less cost to individuals and to economic efficiency, through higher capital requirements.

The government’s immigration policy changes

The Prime Minister yesterday announced several changes to New Zealand’s immigration policy. This is an extract from the Minister of Immigration’s press release.

New measures to take effect from 1 November include:

  • Boosting the bonus points for Skilled Migrants applying for residence with a job offer outside Auckland from 10 to 30 points. [They require 100 points]
  • Doubling the points for entrepreneurs planning to set up businesses in the regions under the Entrepreneur Work Visa from 20 to 40 points.  [They require 120 points]
  • Streamlining the labour market test to provide employers with more certainty, earlier in the visa application process.

“Unemployment across the Mainland is nearly half that of the North Island, and labour is in short supply,” Mr Woodhouse says.“We’re looking at offering residence to some migrants, who have applied at least five times for their annual work visa. In return, we will require them to commit to the South Island regions where they’ve put down roots.”

Mr Woodhouse says the Government is also considering a new Global Impact Visa to attract high-impact entrepreneurs, investors and start-up teams to launch global ventures from New Zealand.

“I will announce further details later this year, but we envisage this visa would be offered to a limited number of younger, highly talented, successful and well-connected entrepreneurs from places like Silicon Valley,” Mr Woodhouse says.

I can’t see any background analysis to these measures, either on the MBIE website or with the Minister’s press release.  On the face of it, however, this looks like a set of measures that will, on balance, to undermine the quality of New Zealand’s immigration programme.

We all know about the infrastructure pressures in Auckland –  largely self-inflicted by central and local government.  Perhaps trying to steer some of the immigrants away from Auckland might temporarily ease some of those pressures a little.  But there is a price to be paid. Providing a significant increase in the number of points available for people with job offers outside Auckland must lower the likely average quality of incoming immigrants.  There is no sign that the permanent residence approvals target (135000 to 150000 on a rolling three year basis) is being increased, so people going to the regions –  taking advantage of the additional points for doing so – will be at the expense of otherwise better-qualified people who would have gone to Auckland.    Under the new policy, people will only have to stay in the regions for a year, so perhaps it will make only a very small difference over time to the number of immigrants who end up in Auckland.  But the ones who do come in, taking advantage of these additional points, will be – on average – less good quality people than the applicants who are squeezed out (people who might have a job offer in Auckland –  our highest paying and –  at least in a statistical sense –  most productive city).    Perhaps I’m missing a significant strand in the reasoning, but I can’t see the likely long-term economic gain for New Zealand.

The Global Impact Visa idea sounds superficially promising. But my impression from the Pathways Conference last week was that existing entrepreneur visa schemes had not worked particularly well.  It will be interesting to see the analysis behind this proposal, including an assessment of how the risks around it will be managed and overcome.  I remain a little sceptical of the attraction of New Zealand to “younger, highly talented, successful and well-connected entrepreneurs from places like Silicon Valley”.  The flow of people in that sector would seem more naturally to be in other direction.  I hope it is not an example of the old derogatory adage used about Britons working in Hong Kong:  FILTH  (“failed in London, try Hong Kong”).