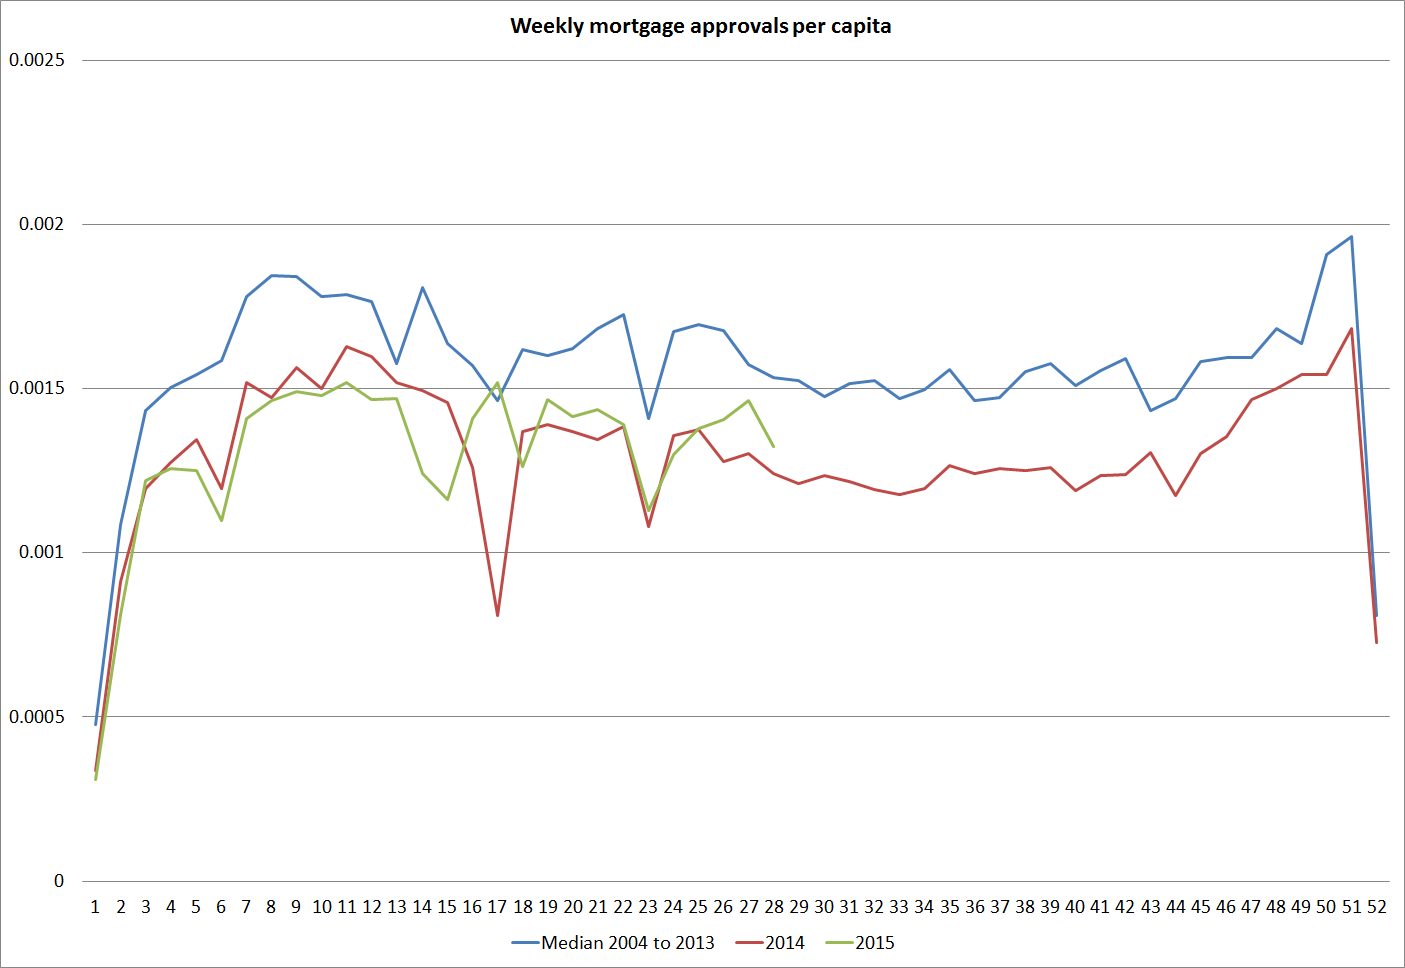
This morning I updated my chart of mortgage approvals per capita. I’ve shown it previously and I like it because it is very timely data. As you can see, the number of mortgage approvals per capita is running just slightly ahead of last year’s level. But the number of approvals is running below the average, for the time of year, in the 12 year history of the series. In fact, in only three years (2010, 2011, and 2014) have approvals been lower than they are this year.
What do I take from this? First, it reiterates the point that across the country as a whole the housing markets are not particularly buoyant. House sales per capita are far below the peak in the previous boom. Most places have real house prices below previous (2007) peaks, and in most places nominal house prices are pretty flat.
Auckland is a (big) exception. If we had mortgage approvals data on a regional basis, perhaps we’d find that Auckland’s were nearer to or even above the historical median, while the rest of the country might be tracing the lows. But the non-resident demand for houses in Auckland may also be relevant here. We don’t know how large the contribution of that demand to rising house prices is, but much of those purchases (however large or small they are) are probably either cash purchases, or perhaps financed with credit from abroad (not captured in New Zealand data).
I think these data also tend – not conclusively, but suggestively – to confirm the line I ran in my submission last week on proposed investor finance controls. There is simply no evidence that rising house prices in Auckland are to any material extent the result a credit-driven process. If they were, not only should the Reserve Bank be able to point to concrete evidence of deteriorating lending standards, but we would also expect to see lots of mortgages being approved. In fact, only three years have been weaker.
Changing tack, I see that print edition of the NBR has an article about what is described as a “war of words” between Shamubeel Eaqub and me, about the contribution of immigration policy to the house prices pressures in Auckland over time. I didn’t recognise the description (“war of words”) and the print edition of NBR isn’t sold this far out in the suburbs so I haven’t yet seen the article, but I just wanted to explain again the difference in how Shamubeel and I are interpreting the same data. I set it out here a few weeks ago.
Shamubeel notes (correctly) that net migration has accounted for only 9 per cent of household formation in New Zealand over the last 50 years. My point is quite simply that net PLT migration (which is probably understated on average over time) is not a description of the contribution of immigration policy. Immigration policy affects the arrival (and duration of stay) of non-citizens. Using the net flow of non-citizens as a proxy for the policy-controlled bit, I concluded that immigration policy accounts for most of the household formation in New Zealand in the last couple of decades. Since 2006, on this proxy, it accounted for 106 per cent of household formation.
I think it would be entirely reasonable to say that, on the one hand, the large net migration outflow of New Zealand citizens over decades has greatly eased pressure on the housing market (taking as given land use restrictions), and, on the other hand, the large net inflow of non-NZ citizens, which is over time a policy-controlled variable, has (even more) greatly exacerbated those pressures. The net effect of the two independent forces might have been modest over 50 years, but one limb is the endogenous behaviour of private NZ citizens, and the other is the direct outcome of policy choices. I might comment further later when I’ve seen the NBR piece.
