I’ve just read Shamubeel and Serena Eaqub’s book Generation Rent¸one of the Bridget Williams Books series of short, often stimulating, books on New Zealand issues. Housing is perhaps the ultimate topical issue, and I hope the Eaqubs’ contribution is widely read.
There is plenty in that I agree with, as well as quite a bit that I disagree with. I might come back to the rest of the book when I have a bit more time, but today I wanted to focus on just one “framing” issue. How one frames an issue often influences how readers think about it.
The Eaqubs have collected the data from old Yearbooks, and censuses, to show where population-based pressures on housing demand have arisen from over last fifty years (strictly, from the 1961 Census to the 2013 Census). They present the influences under the following headings:
- Natural increase,
- Change in average household size, and
- Net migration
Under this decomposition 61 per cent of the increase in the number of households has arisen from natural increase, 30 per cent from a reduction in average household size. The remaining 9 per cent results from net migration.
Put that way, it allows them to present migration (and, hence migration policy) as a fairly minor issue, only really material in a short-term or cyclical sense. As we know net migration is quite variable and not particularly forecastable in the short-term.
But there is another way to look at the numbers. The New Zealand government has no ability to control the movements of New Zealand citizens, inwards or outwards, so discussions of the role of immigration policy really should focus on the movement of non-New Zealand citizens. Non-citizens can only come and live in New Zealand with the permission of the New Zealand government – active permission is required in most cases, while policy allows Australian citizens to come and stay without prior approval. There are lags in the system, and not everyone who is approved actually comes (or stays) but by and large we can think of the net flow of non-NZ citizens as the contribution of immigration policy. Since 1960, there has been a net inflow of non-New Zealand citizens every (March) year except 1979. If economic conditions here are poor, non-New Zealand citizens can leave again too. In that sense the net inflow of non-New Zealand citizens understate the role of immigration policy in boosting demand for housing.
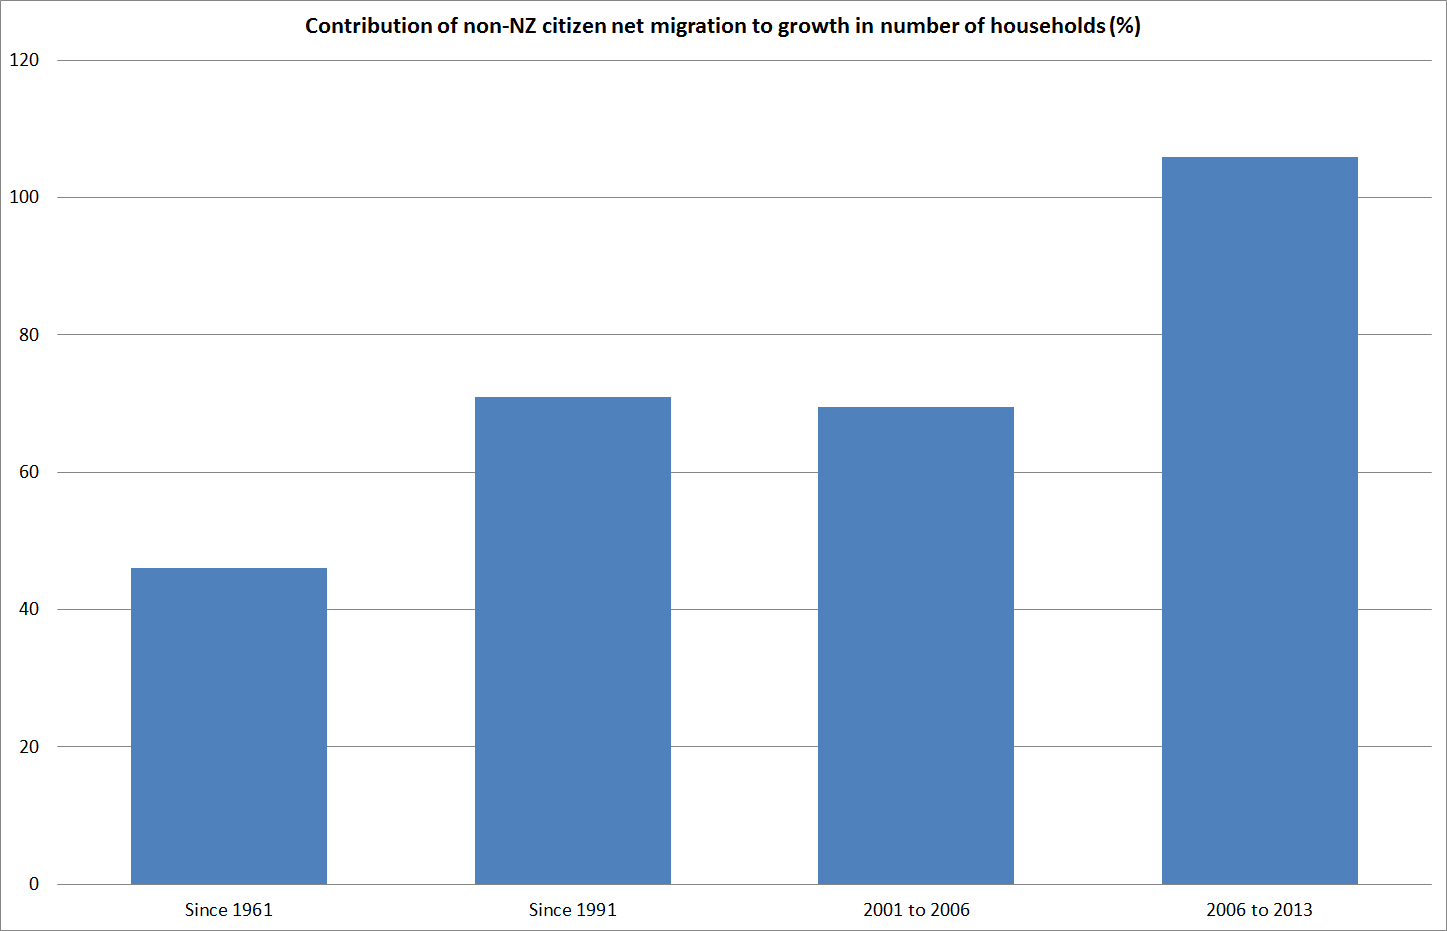
So what has the impact of non-NZ citizen net migration to New Zealand been? In the 52 years from April 1961 to March 2013 there was a net inflow of 1139351 non-New Zealanders. Over the same period (between the two censuses), the number of private occupied dwellings in New Zealand has increased by 918000. With around 2.7 people per dwelling, the net inflow of non-New Zealand citizens has contributed 46 per cent of the total increase in the demand for houses since 1961.
The impact doesn’t happen all at once – in 1961, people didn’t live at 2.7 per dwelling, but they do now. And, of course, many of the non-New Zealanders who migrated in 1960s will have died by now. But most of them will have had children or grandchildren since they moved to New Zealand – and since the average birth rate in New Zealand has been above replacement, the effective contribution to housing demand from immigration policy is likely to have been higher than suggested by the raw numbers. As birth rates have dropped, that may not be so in future.
Since 1961 there has been a variety of changes in immigration policy. From the late 1970s to the late 1980s, inflows of non-New Zealanders were very small. But what about the most recent since immigration policy was changed to actively pursue much larger inflows (at present, policy aims at 135000 to 150000 permanent residence approvals on a three year rolling basis)?
From 1991 to 2013, non-New Zealand citizen immigration accounted for around 71 per cent of the change in the number of households (or dwellings required). For the last two intercensal periods the contributions of non-New Zealand citizen net immigration were as follows:
- 2001 to 2006 70 per cent
- 2006 to 2013 106 per cent
Even I was a little taken aback by the last number but, of course, it just reflects two things:
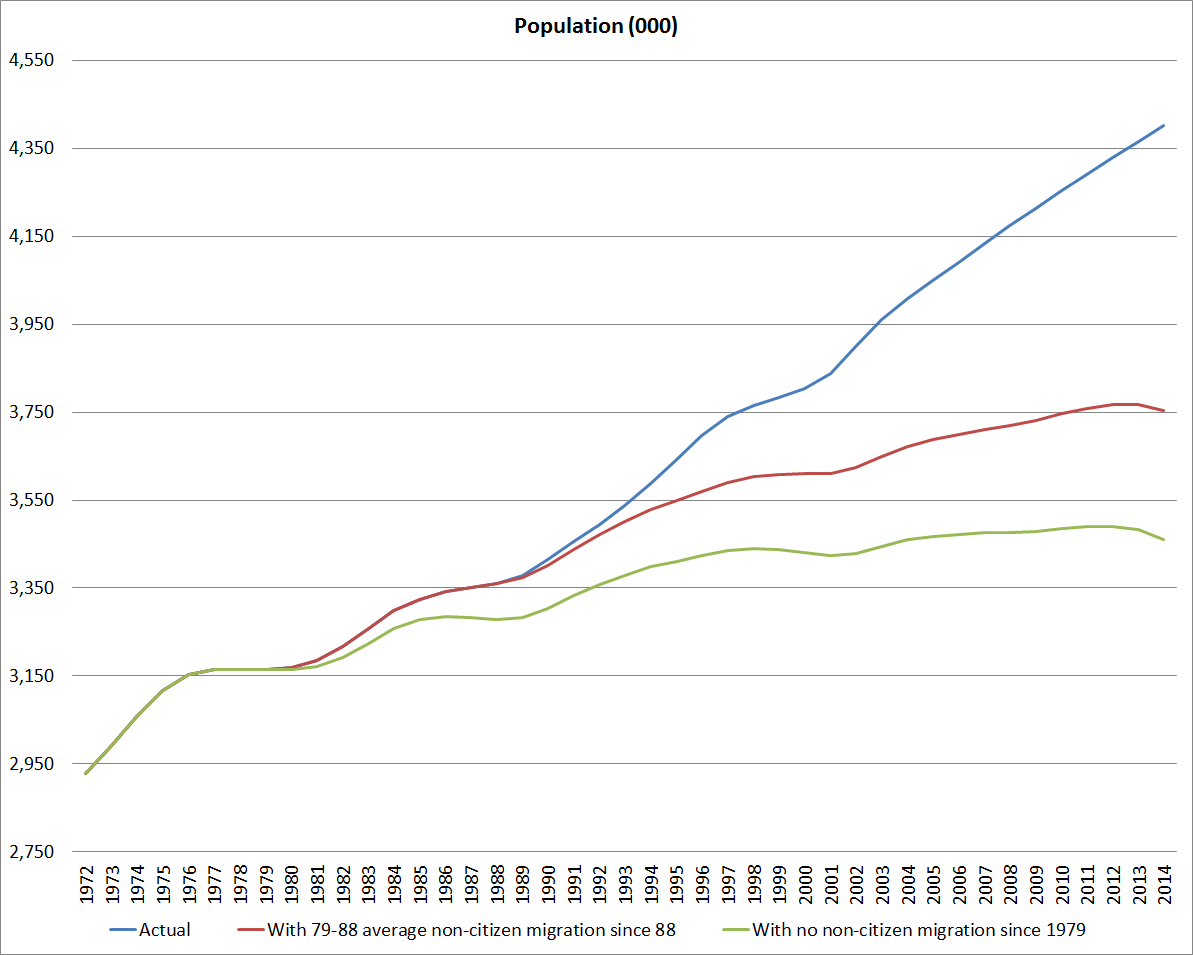
- The chart I showed the other day illustrating that with no (or much lower) non-citizen immigration New Zealand’s population would now be flat or slightly falling
- No change in the average person per dwelling number between 2006 and 2013.
These numbers aren’t precise. It is quite possible that new immigrants start off with a higher than average persons per dwelling – as, on average, non-New Zealand immigrants are poorer than the average resident population. And the number of people per dwelling is itself partly endogenous to house prices – if house prices had not been so high, more people would have been able to fulfil their desire to, for example, live on their own. It is also possible that without the high level of non-New Zealand inflow, the outflow of New Zealanders (which, all else equal, massively reduced the demand for housing) would have been a bit smaller.
But what the numbers do make clear is that immigration policy choices made by successive New Zealand governments account for a very large share of the new household formation, and housing demand, in New Zealand. If anything, that share has been rising as natural increase slowed.
And, of course, these numbers also tell us nothing about what the appropriate target rate of non-citizen immigration is. But, unless we can construct a regulatory environment in which the supply of housing and urban land are hugely more responsive to demand than they have been in recent decades, then any conversations around demand influences, and the potential influence of policy on them, needs to engage seriously with the role of immigration policy. At present – given what it is knows about supply responsiveness – the government’s immigration policy is actively driving house prices, especially in Auckland, at the reach of too many of those who would like to buy – citizen or not.

One aspect of the immigration movement you have not commented on is the high number of “declared short term” immigrants coming for study. This particularly applies to the Indians. It is my observation from Nelson being involved in housing them is that almost all of them end up in the rental market. Does this not justify the increased purchases by investors and conversion of owner occupier dwellings to rentals.
LikeLike
Of course, quite a few students are caught in the “permanent and long-term” category. But, yes, some will be in the declared short-term category, and not in the headline numbers, and they do need a roof over their heads just like the rest of us and, as you suggest, those will typically be renters.
One problem with our data is that the PLT numbers rely on declared intentions, but we know historically that there can be quite large gaps between declared intentions and what actually happens (eg some NZer leave planning to go for ever, and actually coe back 3 months later; some foreigners arrive intending to be temporary, but then go on to get a permanent residence visa, and so on. I’ve been meaning to run the chart showing the large differences there can be, both in the short-term and in the longer-term.
LikeLike
[…] to explain again the difference in how Shamubeel and I are interpreting the same data. I set it out here a few weeks […]
LikeLike
[…] is someone whose contributions to economic analysis I have had some time for (indeed on this blog, I encouraged people to read his book) . I think he is much better than is suggested by simply falling back on labels like “racist”, […]
LikeLike
The first thing we need to understand is the definition of a PLT. From NZ statistics,
http://www.stats.govt.nz/browse_for_stats/population/Migration/international-travel-and-migration-articles/alternative-methods-plt-migration.aspx
Statistics NZ publishes monthly permanent and long-term (PLT) migration statistics that we calculate from passenger intentions as stated on arrival and departure cards.
People are classified as PLT arrivals if they have been living overseas for the last 12 months or more, and state they intend to live in New Zealand for the next 12 months or more.
People are classified as PLT departures if they have been living in New Zealand for the last 12 months or more, and state they intend to live outside New Zealand for the next 12 months or more.
Net PLT migration is calculated by subtracting PLT departures from PLT arrivals.
The definition of Permanent Long Term Migration therefore includes International students, Foreign workers for Christchurch rebuild and tourists.
LikeLike
Yes, and….
https://croakingcassandra.com/2015/07/13/just-how-large-a-contribution-has-net-migration-made-to-population-growth/
LikeLike
YTD July 2015(12 months)
Total PLT migrants
Arrivals
Residence 13,848
Student 26,697
Work 35,551
Visitor 5,206
NZ and Australian citizens 34,957
Other 873
Total 117,132
Departures 57,493
Net PLT migrant Gain 59,639
The actual Residence for the last rolling 12 months is 13,848 in Total.
LikeLike
But that doesn’t reveal very much – it just tells you which visa people had when they came across the border. Most PR approvals these days are onshore, for people already here on work visas. That wasn’t so back in the 90s, when most PR approvals were offshore.
LikeLike
“In the 52 years from April 1961 to March 2013 there was a net inflow of 1139351 non-New Zealanders.” Your statement is very misleading as this is gross migrant rather than net migrant. 25% of kiwis have indicated that they were born overseas, that represent roughly the 1million migrants you refer to but you also have to balance that with departing kiwis and there are close to 1million kiwis living overseas as well.
NZ statistics refer to a myth the numbers are being used in your article.
Conclusion from NZ statistics
http://www.stats.govt.nz/browse_for_stats/population/mythbusters/population-growing-migration.aspx
This myth is busted.
“New Zealand’s net migration balance continues to be volatile. In recent decades, it has ranged from a peak net gain of 43,000 permanent and long-term migrants (in 2003) to a net loss of 44,000 (in 1979). Periods of sustained net migration gains have been interspersed with periods when more people left New Zealand than arrived.
In contrast, New Zealand’s natural increase has remained between 25,000 and 35,000 for most years since 1973. So, while net migration usually contributes to New Zealand’s population growth, the main contribution in most years is from natural increase. Since 1970, natural increase has contributed about four-fifths of New Zealand’s population growth, and net migration the remaining one-fifth.”
LikeLike