One line sometimes heard in the current New Zealand economic discussion is a suggestion that New Zealand has. or has had, a “robust” recovery. I reckon “robust” is generally a good word to avoid, since it has connotations of something well-founded and sustainable which, in a sense, only time will tell. But just how strong has our recovery been?
Official quarterly GDP data go back only to 1987 [surely, surely, we need rather better funding for core official economic statistics] but Viv Hall and John McDermott have generated a series, using earlier annual estimates by SNZ and other authors, all the way back to 1947.
The chart below shows the annual percentage change in real quarterly GDP (seasonally adjusted, since that is how Hall and McDermott present their estimates). There are some oddities around the estimates for the first few years (if I recall rightly, having to do with the level of aggregation in export prices used in generating the original annual real series) so here I’ve shown the data only from the year to December 1952 (a version showing the data all the way back to 1948 is shown at the end of the post). It is a long time series by New Zealand standards.
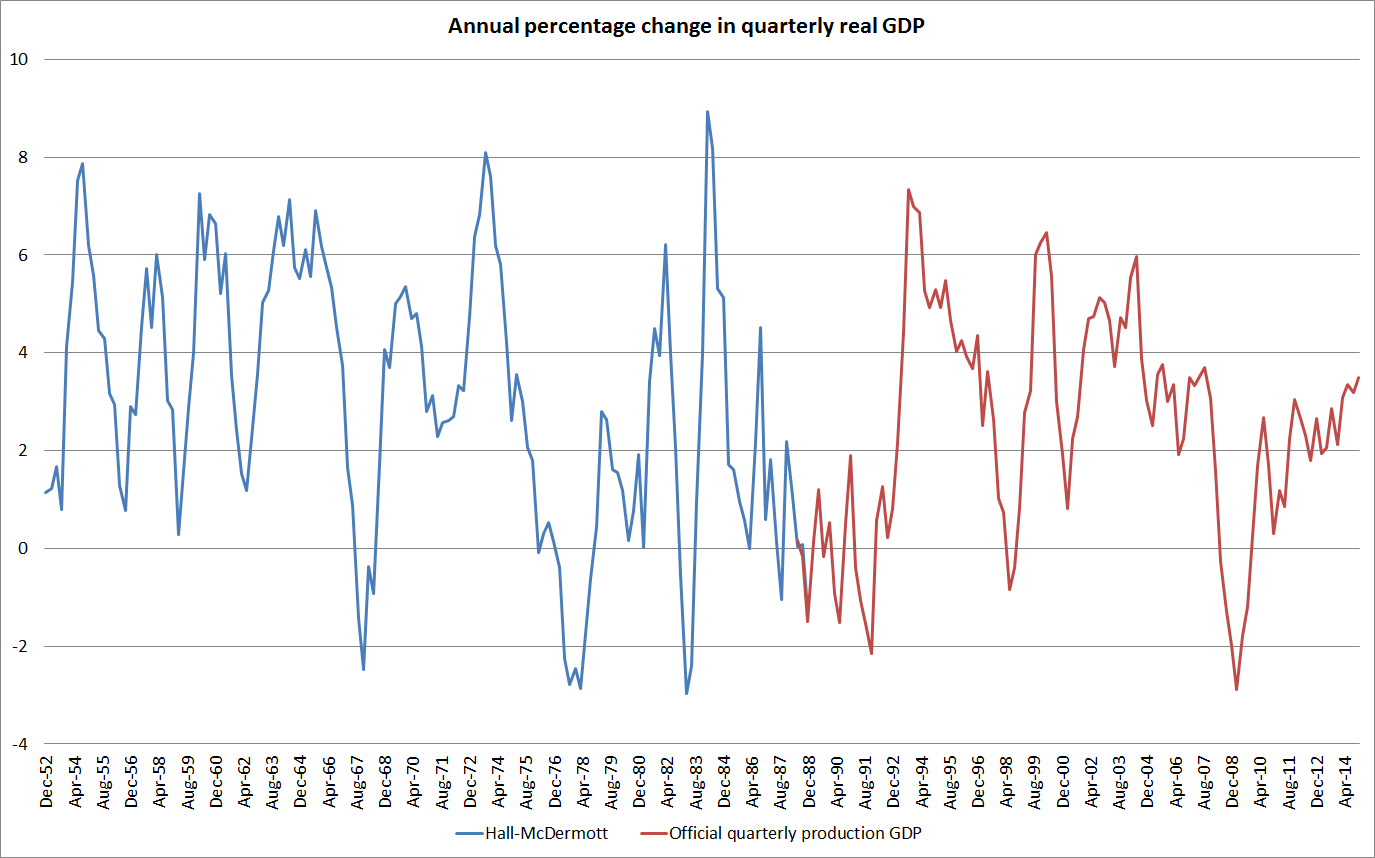
On these estimates, real GDP has been quite volatile over the years. We’ve had five episodes in which GDP has fallen by 2 per cent or more between one quarter and the same quarter the following year. The recession in 2008/09 was almost as deep as the deepest of these five contractions. But what is noteworthy is just how subdued the recent recovery has been. Annual growth has inched up to around 3.5 per cent, and few, if any, forecasters seems to be picking it to go any higher. In past cycles, growth peaks in excess of 6 per cent have not been uncommon and periods of growth in excess of 4 per cent per annum have been the norm.
Of course, there is no doubt something to be said for some stability to growth rates. But there is probably more to be said – perhaps especially for those who became unemployed – for a quick rebound from a serious recession. We haven’t had that sort of rebound. Of course, most other advanced economies have not either but many of them have policy interest rates around zero and have largely exhausted the limits of conventional monetary policy. Sometimes inflation doesn’t provide any leeway for an inflation targeting central bank to accommodate a strong recovery, but that hasn’t been a problem here.
One could mount an argument – reasonable people would differ on the point – that faced with a location-specific demand shock such as the Christchurch repair and rebuild process, it might have been quite reasonable to have expected a particularly strong rebound in GDP for a time, and perhaps even some overshooting in headline CPI inflation (since medium-term trends are what the Bank is instructed to focus on).
But whatever your view on that particular point, given the depth of the recession, how far below pre-recession trends GDP still is, and how low core inflation has drifted, peak GDP growth of 3.5 per cent should be counted more as a failure than as a success. An economy firing on two, faltering, cylinders might be a better description than “strong” or “robust”.
One other argument I have heard against cutting the OCR now is the risk of a repeat of what is loosely characterised by my old colleague Rodney Dickens as “Alan Bollard’s go-for-growth experiment” of 2003/04. That there was such an “experiment” is hard to disagree with – the government had given Alan a higher inflation target, and he (and the then government) seemed to have a sense that the old-school Reserve Bank hardliners had been holding back New Zealand’s growth potential. I think the characterisation is a little unfair on Alan, but even he later admitted that the policy approach in 2003 had been a mistake.
I could discuss the similarities and differences between 2003 and the current situation at some length (and I don’t feel defensive about 2003, as I working overseas that year), but the stark and simple contrast is captured in this chart, which I’ve run already this week.
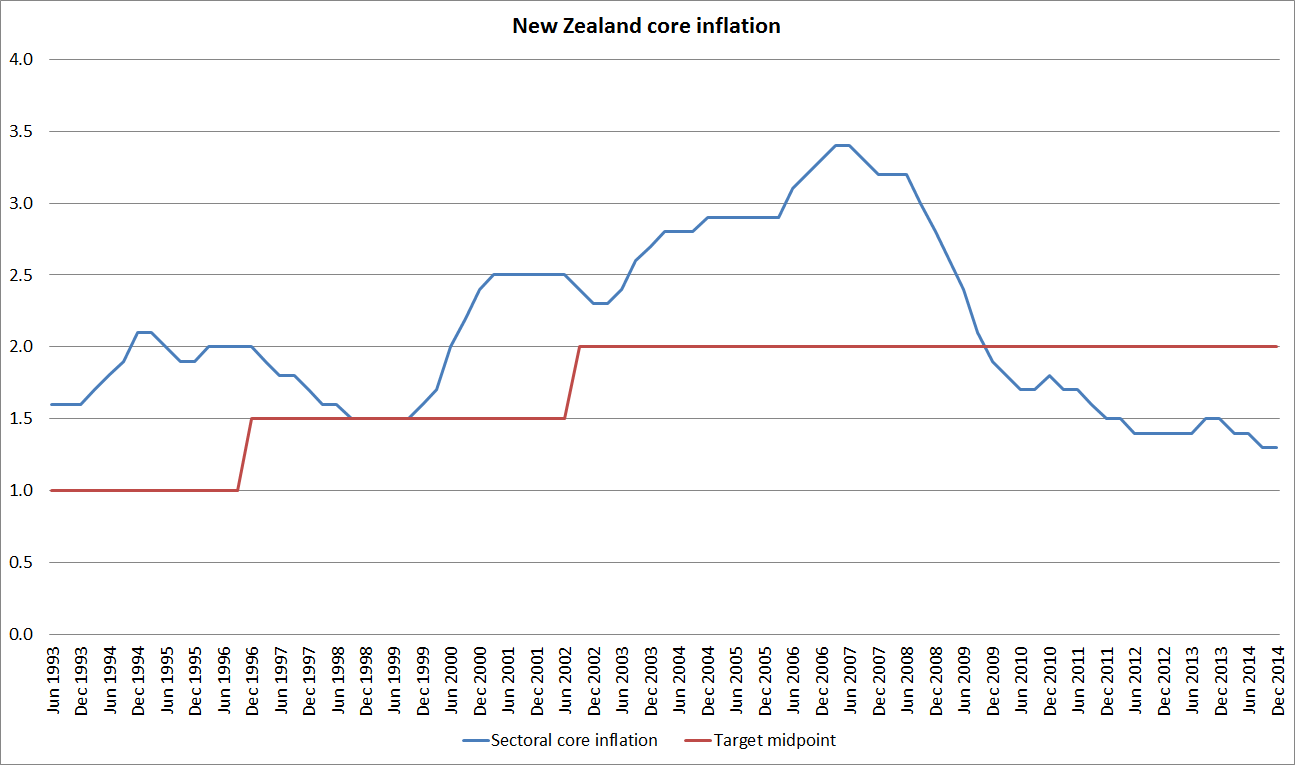
In 2003 and 2004, core inflation was well above the target midpoint, had increased materally over the previous year or so, and was increasing further. Of course, the PTA at the time made no mention of the midpoint, but no one ever thought the top part of the target range was something to actively aim for. This particular analytical series did not exist then, but it captures trends that were apparent in other ways of slicing and dicing the CPI. Even allowing for the uncertainties (SARS etc), to have cut the OCR then and to have been so slow to move it back up when the initial scare passed, is hard to defend. As Alan later said, it was a mistake.
What is the situation now? The Bank has, as much by accident as by good planning, achieved something worthwhile in the last few years in finally demonstrating that core inflation will not always be in the top half of the target range. But this is not a price level target regime, and the PTA is clear that the focus now needs to be on keeping future inflation near the 2 per cent midpoint. Actual measures of core inflation have been falling for years, and are now well below the target midpoint. A material increase in the (core) inflation rate would be highly desirable, given the target the Minister and the Governor have agreed. It has been forecast for several years, but it has simply not arrived. Perhaps it is just a “not yet”, but the case for OCR cuts now is very very different from the case in 2003.
Appendix:
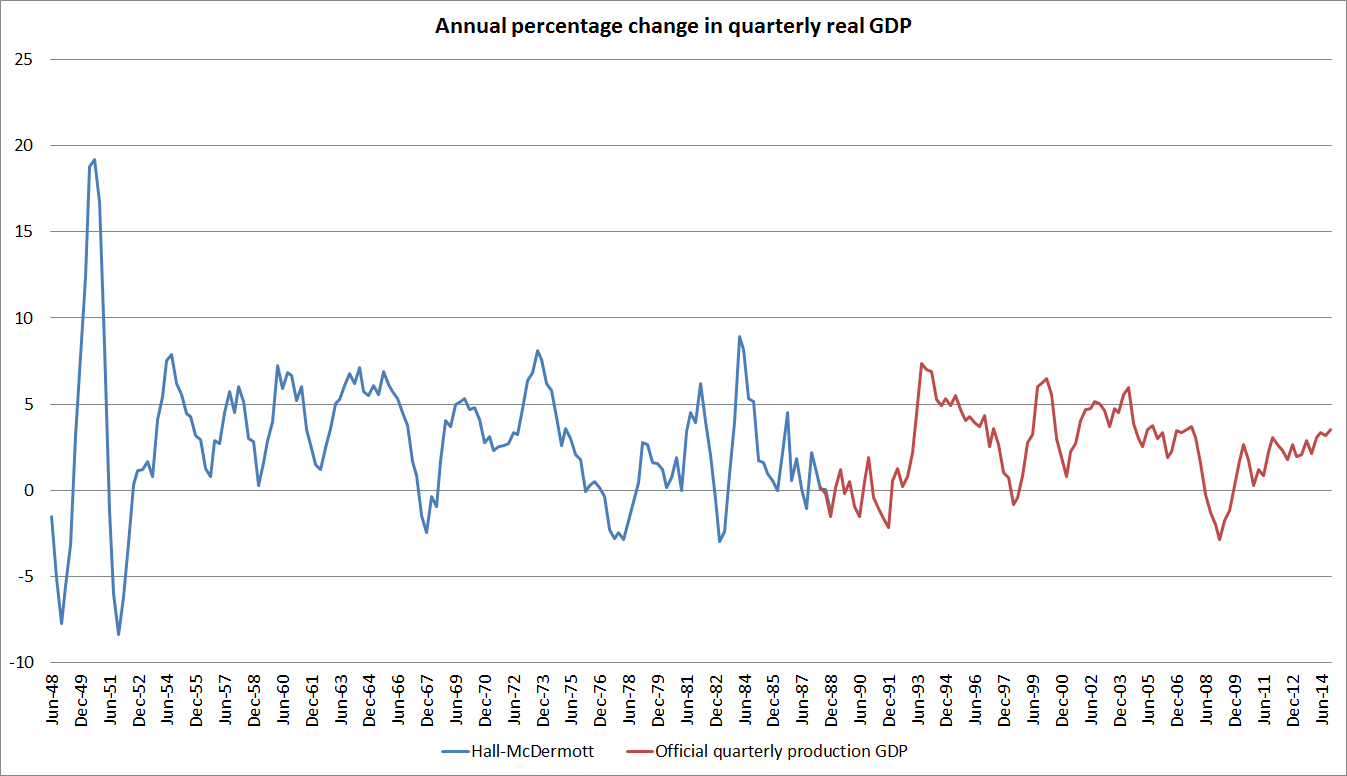
The first chart above for the full period since 1948.

Michael
First, I’m enjoying reading your blog posts. I don’t agree with all the points you are making but, as has long being the case, I respect your well considered views so its great to have access to them on a daily basis! They challenge and clarify my own thinking.
So far I have resisted replying to your posts (I fear the hours would easily slip away if I did) but there is just one point I will make on this post that others might not make and it concerns your unswerving faith in the sectoral factor model estimate of core inflation.
It is very important to remember that this measure is a filter and is subject to revision – the chart you show is the current vintage, but not what policy makers would have seen had they access to the model in 2003 and 2004. There was an RBNZ paper released around the time that the model was introduced which documented that the real time estimate of core inflation through 2002 and 2003, for example, was around 1/2% to 3/4% lower than now estimated. The subsequent rebound in actual inflation saw core inflation revised higher over time.
This also has relevance to how we interpret the current reading of 1.3%. Note that in recent quarters the earlier readings have also been revised lower and I’d say its fait accompli that the current 1.3% for Q1 will be revised lower in Q2. But if inflation rebounds in 2016, as is my best guess, over time we will see these readings revised higher, potentially to show core inflation not that much below the target mid-point. For this reason, I’m not a great fan of this core measure.
Darren
LikeLike
Darren
Entirely fair comment. I should have made it myself (re the proneness to revision). I use the sectoral core measure now mainly because it is available for a long time period, and it captures stuff that represents a broad sensible picture of what has been going on. If the current fall in the sectoral core measure were wildly inconsistent with what other measures were showing I would be much more hesitant about using it to support a story. In 2003/04 non-tradables inflation was rising quite noticeably, and was over 4% by Dec 2003.
Michael
LikeLike
It could be argued that the real mistake in the early 2000s was the extent of policy easing that took place from early 2001. As I recall the Bank began easing pretty much in the quarter when the economy began growing at a 5% p.a. rate, stepping up the pace of easing late in the year. I’d have to check whether the available vintage of GDP data shows growth to be as strong as we now know it to be. Non-tradeables inflation was just 1.5% yoy in mid 2001 – compared to 2.3% now – and yet by end 2002 was running at just under 4%. With that experience in mind, I’m not sold on the need for a rate cut now even though I accept that with the benefit of hindsight – and a narrow focus on the inflation target – you could readily argue that much of last year’s policy tightening was unnecessary.
Incidentally, what do you consider to be a fair estimate of the NAIRU? You suggest that the unemployment rate in Q4 (at 5.7%) is above any reasonable estimate, and thus the RBNZ is causing unnecessary pain. If the unemployment rate fell to 5% over the next two quarters as all our foreign students go back to school, would we back at the NAIRU?
LikeLike
Darren
I have quite a bit of sympathy with your story about the early 2000s. We cut in 2001 partly trying to be pro-active to the emerging US recession, and our willingness to do so was shaped by the previous mistake, the MCI and the slowness with which we recognised (or responded to) the Asian crisis/recession. The MCI was a scarring experience – certainly scarred me, and I suspect all those involved.
People will always make mistakes when it comes to setting official interest rates, and so part of a robust framework is a willingness to respond and correct. In a way I would criticise us more for how slowly we unwound the 2001 and 2003 OCR cuts. The OCR was 6,5% in Dec 2000 and it took until Dec 2004 to get back there, and by then the inflation target had been moved up 0.5 percentage points. I think that part of what was going on was the idea of interest rate convergence: people regularly chided us that our interest rates surely couldn’t need to be so persistently above those in Aus and the rest of the world now that inflation was low and stable etc etc. But they did, and do, and not just cyclically.
On NT inflation in 2001, recall that the change in policy on HNZC rents (move away from market -related rents) explained that dip.
On the NAIRU, of course all these discussions would be in seasonally adjusted terms. I’d be surprised if a NAIRU were as high as 5 per cent at present, especially bearing in mind the continuing extent of underemployment, but the questions would certainly get harder if U settled at or below 5%. Longer-term Paul Krugman has pointed out in a US context how surprised people were in the 1990s by how low the NAIRU proved to me, and a point I’ve often made in that in a 45 year working life one year’s official unemployment for every single person would produce a 2.25% unemployment rate. I’m not suggesting that is the NZ NAIRU, but it is worth bearing mind that as the population ages (and unemployment rates for older demographics are lower) the NAIRU might still be moving down.
One final point: we are in a quite unaccustomed position in NZ at present. For the first time since inflation targeting began core inflation (take a suite of measures) is below the target midpoint and has been for sometime (one reason why criticisms of Alan Bollard are a little unfair – the brash record relative to target midpoint wasn’t great). To me, that puts a different complexion on the risks of some rate cuts.
Anyway, good to discuss the issues. No one can, or should, pretend to huge certainty in this area, especially in any calls about where the OCR should be 6, 12, or 24 months hence (one reason why I’ve always been sceptical about publication of medium-term forecasts).
Michael
LikeLike
One thing I do observe is that the employment rate now is higher than it was when the unemployment rate had a 3 handle. The implications, if any, for the NAIRU are unclear, but I do note – and this speaks to other points in your post – that labour productivity growth over the past year is abysmal. Combining QES wage data with HLFS labour input data suggests that unit labour costs are growing at a 3% rate, rather than the circa 2% rate suggested by the Labour Cost Index. I find it hard to see domestic inflation slowing with that background unless the exchange rate/commodity prices continue to cheapen other inputs.
LikeLike
Although recall that employment and participation rates are rising (have risen since 2007) in a lot of advanced economies – the US is quite an outlier – without much sign of price or inflation wage inflation picking up, or being a problem.
I guess I reckon OCR cuts are warranted even if domestic inflation falls no further, since it is already below the midpoint, and there are few compelling signs that it is just about to turn. I’m probably more pessimistic than you on the future of the construction cycle, and perhaps on the world, so probably do expect core inflation to move lower. But I wouldn’t suggest making current policy on that view. At present, I think the best we can do is “look out the window”. A Taylor rule does that, and they didn’t do badly in describing past central bank behaviour. I’m not suggesting we can now use a mechanical Taylor rule – we don’t have a good fix on either neutral rates or the output gap – but inflation is pretty low, relative to target, has been for quite some time, and we are supposed to be inflation targeting.
LikeLike
White noise.
http://www.henrymakow.com/pascal_roussel.html
LikeLike
[…] left the unemployment rate lingering so much higher, and for longer, than it needed to be. And, as I noted last week, our real economic recovery, measured in terms of real GDP growth, has not been strong by […]
LikeLike
[…] per cent, less than one percentage point off the peak during the 2008/09 recession. The recovery had not (and still has not) ever achieved the sorts of real GDP growth rates seen in earlier recover…. And, of course, headline and core inflation were both (still) below the midpoint of the target […]
LikeLike