Manufacturing sector employment

Having finished the last post, I flicked over to Kiwiblog and found a slightly flippant post, suggesting that Andrew Little’s comments about the dairy sector being in “crisis” could be safely discounted, in view of earlier Labour worries about the manufacturing sector having come to nothing. Indeed, on this take,

Their manufactured manufacturing crisis has seen record job growth in manufacturing.

I don’t follow sectoral employment data closely, so presumed I’d missed something.  Indeed, since much of manufacturing activity is a derived demand from construction activity (which has been very buoyant) and dairy processing makes up another component, and milk production has been growing strongly (even if agricultural value-added hasn’t), some strength in manufacturing employment sounded plausible.

But here is the chart of the Quarterly Employment Survey data, showing hours worked and number of full-time equivalent employees for the manufacturing sector as a whole.  The QES is a survey of firms, and probably quite reliable for these sorts of questions.

qes manuf

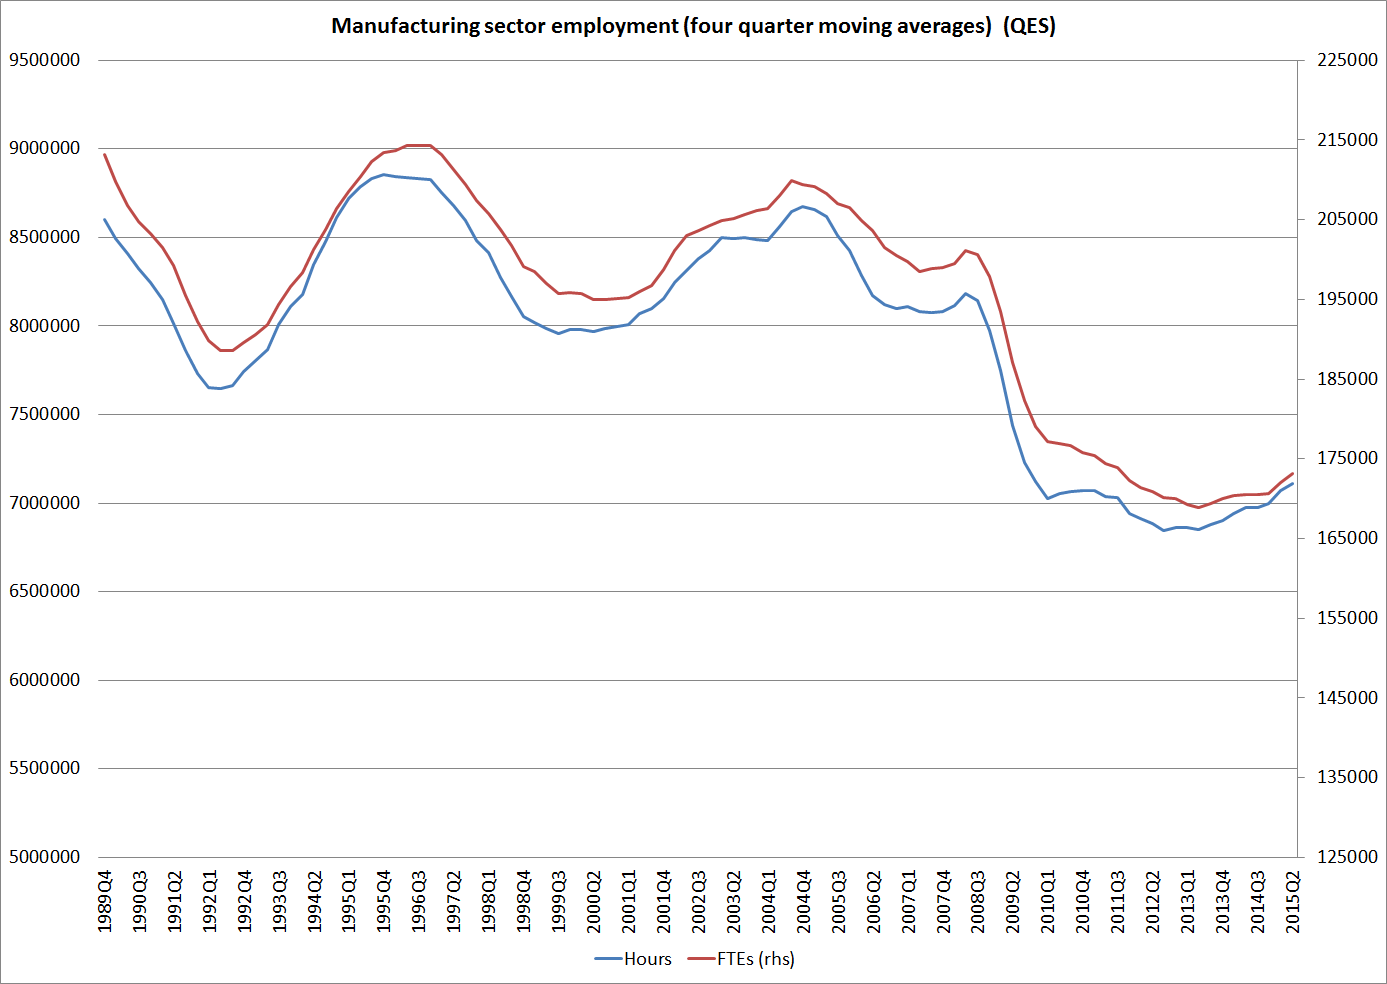
Given the strength of construction activity over the last couple of years, these seems quite remarkably weak data.

The HLFS (a survey of individuals) has a shorter series, and only for the total number of employees.  It has shown greater strength in the last few quarters, but even on this measure the numbers employed in manufacturing are still not up to pre-recessionary levels.

There is a long-running debate on the importance of manufacturing, both here and abroad.  Here was my summary take from a couple of months ago.

I’m not one of those who thinks that the relative decline of manufacturing is a tragedy, but on the other hand I also don’t think that it is a matter of total indifference.  Most likely, the relatively weak manufacturing sector performance in recent years, despite the buoyant construction sector, is a reflection of the persistently high real exchange rate.  Like Graeme Wheeler, I think the real exchange rate is out of line with medium to longer–term economic fundamentals.  A more strongly performing New Zealand economy, one making some progress in closing the gaps to the rest of the OECD, would be likely to see a stronger manufacturing sector.  It might still be shrinking as a share of a fast-growing economy, but a manufacturing sector that has seen no growth at all in almost 20 years doesn’t feel like a feature of a particularly successful economy.

The weak manufacturing sector, despite the support from construction sector demand, seems to be yet another symptom of an underperforming New Zealand economy.  If there were clear signs of rapid growth in investment and productivity in other parts of the tradables sector, we might reasonably be unbothered by the manufacturing numbers.  As it is, I don’t think we can be that relaxed.  And it isn’t a matter of targeting measures directly to boosting manufacturing, but about removing obstacles that have held up the real exchange rate (over decades), and which undermine the attractiveness of business investment across the economy as a whole.

Putting the exchange rate fall in historical context

New Zealand’s exchange rate has fallen quite a way in the last few months. The fall was most dramatic from late April to the start of July, when the Reserve Bank’s TWI measure fell from just over 80 to just over 70, a fall of around 12 per cent. Using monthly average data the fall from April to July was almost as large as any three-month fall we’ve seen in the 30 years New Zealand’s exchange rate has been floating.

twi 3 month changes

But sharp as that fall has been, the total fall in the TWI so far still looks only moderate by the standards of past corrections in the New Zealand dollar. In this chart, I’ve gone back a bit further. The new Reserve Bank TWI data only go back to the start of 1984 at present, but using the BIS indices we can go back another 20 years, to give us just 50 years of data.

TWI largest falls

The first three adjustments were discretionary devaluations, two (1967 and 1975) in response to sharp falls in the terms of trade, and the last associated with the change of government in 1984. As I noted a couple of weeks ago, the fall in the exchange rate so far is similar in magnitude to the short-lived sharp fall in the first half of 2006, when a “growth pause” (still showing in the data as no real GDP growth from 2005Q2 to 2005Q4) sparked expectations of forthcoming cuts in the OCR.

Graeme Wheeler has been using the slightly odd terminology that the exchange rate “needs” to come down and I have already commented earlier on that.  He seems to have in mind some sense of an exchange rate which would stabilise the ratio of NIIP/GDP.  But it is not entirely clear why he thinks the exchange rate is likely to actually fall further. After all, he has been openly disagreeing with market commentators who think the OCR might need to fall to 2 per cent, suggesting that he doesn’t see that the need for the OCR to fall much further. Recall that the falls in the OCR he seems to be envisaging will be tiny when compared to previous policy rate cycles here and abroad. His story seems to envisage that perhaps last year’s OCR increases will be fully reversed, but no more –   but previous easing cycles have involved multiple hundreds of basis points moves.  And, on the Governor’s rather upbeat story, we might reasonably expect the negative NIIP position to widen, to act as the buffer for some of the loss of national income, over the next year or two.

niip to gdp

After all, in the last few years, the NIIP/GDP position has been less negative than it had been for most of the last 25 years (through some combination of the offshore insurance claims resulting from the earthquakes, not yet fully spent, and the high terms of trade). On his story why should we expect much more? If he is right about New Zealand’s monetary policy outlook, many in the market will be surprised and, if anything, the TWI might rise.

But I’m sceptical of the Governor’s story about the New Zealand economy and prospects for domestic monetary policy. When I filled in the Bank’s Survey of Expectations last week, I wrote down a prediction that implies an OCR below 2 per cent by this time next year, and I wondered afterwards if my number was low enough yet. I don’t think anything that weak is yet priced into the central market view. If so, most likely the TWI will move quite a bit lower yet.   Heightened periods of risk are also often bad for New Zealand’s exchange rate –  no one has to hold New Zealand dollar assets when times are risky –  and markets still seem remarkably relaxed about China and the euro-area as sources of economic and financial risk.

Finally, recall that the TWI fell to the lowest level in the last quarter century in 2000, the last (and only) time since liberalisation when US short-term interest rates matched those in New Zealand.  At the 2000 trough, the TWI was some 30 per cent lower than it is today.