The Reserve Bank’s OIA charging policy release

Thanks to Eric Crampton for alerting me to the Reserve Bank’s OIA release (to Alex Harris) around its new charging policy.

The documents are interesting in that they provide us with some data.  The Reserve Bank has complained about a large increase in the number of OIAs they have been receiving, and used that as one justification for the new charging policy.

 18 requests in calendar 2010

21 requests in calendar 2011 – up 17% from previous year

30 requests in calendar 2012 – up 42% from previous year

45 requests in calendar 2013 – up 50% from previous year

47 requests in calendar 2014 – up 4% from previous year

70 requests in calendar 2015 – up 49% from previous year

As they acknowledge, the Reserve Bank has been rather more active in a number of policy areas in the last few years –  LVR restrictions are the most obvious example –  which might have been expected to generate more requests, and more (attempted) scrutiny of the Bank.

But what is a reasonable baseline?

In their paper, the Bank staff note that the Treasury informed the Bank that they had a team for four full-time staff to handle OIA requests (and had charged only one person –  an academic with a large research grant – some years ago).  We don’t know how many OIA requests Treasury deals with each year (for requests to The Treasury itself, and those it handles for the Minister of Finance), but on the Treasury website there  are more than 100 OIA releases in the last 12 months –  and that list is described as “selected responses” and also excludes pro-actively released material (such as the post-Budget large pro-active release).

The Treasury is a larger organization than the Reserve Bank (around 420 staff to the Bank’s 260 or so), and covers a wider range of functions.  On the other hand, the Reserve Bank has a large amount of delegated power in a variety of very significant areas (monetary policy and banking regulation), and with a very large balance sheet.  It isn’t obvious that 70 OIA requests a year is an unreasonable number for an organization of the power, size, and importance of the Reserve Bank.  Perhaps –  as various people have suggested –  it is just that the Reserve Bank was getting off surprisingly easily in the previous few years?

In the note to the Bank’s Senior Management Group I am listed as one of the culprits –   having, at that time, apparently lodged 16 OIA requests in 2015 (the final total would have been 2 or 3 higher).  Curiously, the Bank proposes in the documents a benchmark for charging in which charges would apply to people making more than a rolling average of two requests per month.  Not even I managed that last year –  and I haven’t lodged a request with the Bank this year to date.   As the No Right Turn blog puts it:

The bank’s cutoff for when it will refuse a request for “substantial collation and research” is a mere three hours, while their definition of a “high volume requester” is someone who makes two requests a month for two months. Combined, these basically rule out any use of the OIA for serious research or investigation of the bank’s policies, whether by academics, investigative journalists, or the public. And while MPs won’t be charged, their requests will still be refused if they take more than that three hour limit. The net result: less scrutiny, and a specific incentive against regular scrutiny. Which means less accountability to the public.

I had a quick look through my email inbox to refresh my memory of last year’s requests:

  • four related to issues around the Bank’s superannuation fund. I am an elected trustee of that Fund, and we have been grappling with some difficult and serious issues raised by a pensioner about events in the late 1980s and early 1990s.  The Governor’s alternate (Geoff Bascand) had been actively seeking to close the issues down, without further investigation (even though they have already led to the discovery, disclosure, and apology for the fact that past trustees –  chaired by Don Brash, and including the current head of the New Zealand Transparency International –  had broken the law).  The only way to get some of the information needed was to request it from the Bank under the Official Information Act.    In no case was any substantial research or collation faced by the Bank (in one case I was simply told to photocopy the pages I wanted).
  • When I left the Bank I sought approval to use old discussion notes and memoranda that I had written.  This was an entirely friendly approach, designed to minimize future requests by, in effect, seeking general approval to quote old papers (I even excluded from the request one paper I knew the Governor was sensitive about).  Approval could have been granted, at least for older papers, with no Bank resources at all.
  • I sought the release of background papers to one of the 2005 MPSs.  These were 10 year old documents, nicely collated and stored. The point of the request was to establish the principle that such papers should be public, at least with a lag.  The request should have involved no material costs to the Bank, and when the papers were finally released –  well beyond 20 working days –  there were no deletions at all.
  • In two cases, I sought background papers after major changes of view by senior bank management –  changes where no reasoning was provided at the time.  One related to capital gains taxes, and the current one relates to immigration.  Since they were current issues, (of material public interest) there should have been limited resources required to respond promptly.
  • I requested background papers relating to 2012 Policy Targets Agreement. As this is the key document governing monetary policy, and no background papers had been released at the time the PTA was signed, it seemed desirable to better understand what the Minister and Governor had had in mind (especially in light of the current monetary policy stance debates).
  • I requested papers relating to the extensive work programme the Reserve Bank had been doing on reforming  the governance of the Reserve Bank.  The Bank has refused to release anything of substance, a quite extraordinary stance for a work programme that has now (apparently) ended (and quite in contrast to the Treasury’s approach to a request on that work).
  • I sought papers provided to the Bank’s Board relating to the September MPS.  The Bank will have spent next to no resources on this request, since was refused completely (as I expected, but I wanted to establish the point).
  • I sought minutes of the Bank’s Governing Committee for a defined period last year.  The Governor has been keen to stress the role the Governing Committee plays in decisionmaking, and as is well known it is common for minutes of key policy committees in other central banks to be released.  Totally refusing this request will also have taken almost no resources, since there was no sign in the response that they had considered the individual meeting minutes.
  • I requested one specific paper I had written about fiscal and monetary events in 1991 –  the first big test of the inflation targeting framework.  This request was, of course, necessary only because the Bank had (see above) refused my general request to be able to cite my old papers.
  • I requested copies of the submissions on the new investor finance restrictions.  After great difficulty, and only after another media request, were some of these documents released (in total). It remains common practice elsewhere in government to publish submissions pro-actively.
  • I requested copies of submissions on the regulatory stocktake.  Comments as for the previous item: costs and resource pressure arise entirely from the Bank’s choice to be non-transparent.
  • And I made two requests relating to the (TPP) Joint Macroeconomic Declaration, to which the Reserve Bank is a party.  The second request followed when the first request was denied in full.  The second request is still pending.

Reviewing that list with the benefit of hindsight they seem like exactly the sorts of requests that a central bank and financial regulator might expect in the course of a year like last year.  Most would have been avoided if the Bank adopted the sort of pro-active transparency, as regards process, that is now best practice, or (in some cases) had simply explained itself.  Even when material was released, it was almost always done on the last lawful day, or after an extension or two.

(Of course I would say this), but none of the requests appear vexatious or deliberately time-wasting.  I have been encouraged to make other requests of the Bank –  to seek information on the process they have used on each of the requests they have stalled, obstructed or refused, but have chosen not to.  I’m less interested in the details of any particular request than in the general pattern of obstruction and (despite their claims) non-transparency.

The Official Information Act is about improving access to official information –  an idea that the Bank appears to be rather uncomfortable with.  As I’ve noted before, it may be that their charging policy is lawful, but if so there is something amiss with the law itself. Whether or not it is lawful, it is not good practice, and not consistent with the sort of image –  an open and transparent institution –  that the Bank regularly tells us it wants for itself.
A transparent central bank? Not our one.

Readers may recall that on the day of the December Monetary Policy Statement I lodged a request for analytical papers the Bank had considered in recent months on the economic impact of immigration.  The background was (a) the Governor’s press conference endorsement of New Zealand immigration as “a good thing”, and (b) the explicit statement in the MPS that the Reserve Bank had changed its view of how immigration affects the short-term balance between supply and demand pressures.  As they stated in the key policy judgements chapter:

Record net immigration is adding materially to demand and to labour supply.  Given continued strong flows, we have revised up our projection for net immigration (see chapter 5).  Based on the cycle to date, we assume the future population boost and associated increases in the labour force will translate more quickly into supply potential than we have assumed in the past.

That has important implications for monetary policy.

But there was nothing in the rest of the document, or in the answers at the press conference, to explain this quite marked change of stance.  As I have pointed out, the new stance is not just different from their past view, but different from quite recent Bank published research, in which demand effects exceed supply effects in the short-term, meaning that all else equal the OCR tends to rise when net immigration does.

As I noted a couple of weeks ago, when the Bank extended my quite limited request, it had seemed at the time like a fairly simple request: show us the analysis you are using to back what represents quite an important change of view.

A short time ago, I received the Bank’s final response.  The heart of the response is here (I’ve highlighted the section in bold)

The Reserve Bank holds 20 documents within the scope of your request, which are all related to either the Monetary Policy Committee or the Governing Committee’s discussions of Monetary Policy.

The Act explicitly recognises, in section 4(c), that there are times when releasing information is against the public interest and provides for such circumstances with different types of reasons to withhold information. The Reserve Bank is withholding these 20 documents under the following grounds of the Act:

  • s6(e)(iv) – to prevent damaging the economy of New Zealand by disclosing prematurely decisions to change or continue government economic or financial policies relating to the stability, control, and adjustment of prices of goods and services, rents, and other costs;
  • s9(2)(g)(i) – to maintain the effective conduct of public affairs through the free and frank expression of opinions by or between officers and employees of any department or organisation in the course of their duty;

The papers about immigration that you’re seeking were prepared in the context of monetary policy discussions, including setting the Official Cash Rate and publishing the Monetary Policy Statement. As you are aware from your time working at the Bank and from your previous requests for information related to both the Monetary Policy Committee or the Governing Committee, the Reserve Bank considers that information provided to and discussed recently by policy committees in relation to setting the Official Cash Rate must be kept confidential in order to ensure that free and frank discussion occurs and that free and frank advice is provided to the Governor. The Bank considers that the need to maintain confidentiality abates over time as the economic cycle moves along, but that current and recent advice must remain confidential in order for the Bank to effectively perform its monetary policy function. Public disclosure of current and recent advice occurs, in summary form, via publication of the Monetary Policy Statement and associated news statement. The process of deciding what to publish in the Monetary Policy Statement recognises and balances the tension between disclosure and confidentiality.

Frankly, if they had told me that they had no papers within scope I might not have been unduly surprised.  Sometimes forecast assumptions are tweaked to produce the bottom line the Governor wants (always have been, probably always will be).

But to suggest that no paper on any aspect of immigration that went to the Monetary Policy Committee  at any time over the five months or so leading up to the Monetary Policy Statement can see the light of day, on principle, seems completely inconsistent with the statutory purposes and principles of the Official Information  Act –  designed to make information more available.  And there is no sign that the Bank has considered the papers one by one: it looks a lot like a blanket refusal.

As for the statutory provisions they quote:

  • section 6(e)(iv) simply cannot be used here. It refers to premature disclosure of decisions.  My request was for background analysis or research.
  • and the invocation of the “free and frank” provisions is also, at best, a stretch.  I didn’t ask for minutes or records of discussion at meetings.  I don’t even ask for individual pieces of OCR advice (the one page notes advisers submit), but for pieces of analysis –  prepared, most probably, in one or other of the sections in the Economics Department.  The material clearly exists.  It is official information.  We should be able to see it –  especially, when it has “important implications for monetary policy”.

As I’ve noted repeatedly there is a far higher degree of transparency (and timely transparency) around background papers feeding into the government’s Budget deliberations.

I noted recently that “the Reserve Bank constantly tries to convince us of how transparent it is.  As Deputy Governor, Geoff Bascand, put it in his first on-the-record speech ”

The Reserve Bank is deeply committed to transparency – of policy objectives, policy proposals, economic reasoning, and of our understanding of the economy, and of course of our policy actions and intent. Clear communication and strong public understanding make our policy actions more effective.

We are working to enhance the openness and effectiveness of our communications

Mine wasn’t a request for anything obscure.  It didn’t have a “gotcha” agenda –  though legally it doesn’t matter if it did. (And, if anything, their change of view happens to support my current view on monetary policy).   It was just a request to see the background papers that appear to have led to a large change of view, on an important part of how current shocks affect the economy and inflation pressures –  a change not elaborated on at all in the document they did make available, the Monetary Policy Statement.    To enable us to better appreciate, in Bascand’s words, their “economic reasoning, and…our understanding of the economy”.

The Bank simply isn’t very transparent at all.

I will pass on this response to the Office of the Ombudsman.

The cause of getting some insight into the Bank’s view of immigration is not, apparently, totally hopeless.  At the end of today’s email they did include this

The Bank holds other information that is not within the scope of your request but that nevertheless may help shed light on the Bank’s views about immigration. This material is currently being worked on with a view to publication and the Bank will inform you when it is available.

I’ll look forward to seeing that material when it eventually appears.  But, as they note, it isn’t within the scope of my request, or within the sort of 20 working day OIA timeframe.  It continues the Bank’s longstanding approach of acting as if the principles of the Official Information Act really don’t apply to them, and that as far as possible only things that the Bank has written for external publication should see the light of day, not “official information” as defined by Parliament.


TPP: some more economists

In a post a couple of weeks ago,  I highlighted the comments several New Zealand economists had made about the TPP agreement.  Reasonably enough –  since to evaluate the full detail involves a great deal of in-depth work –  none seemed overly confident in their views, but none seemed to see the agreement as any sort of landmark beneficial economic advance for New Zealand.

Since then, a couple of other economists have put views on record. Jim Rose, a consultant who has worked for various New Zealand and Australian government agencies (including the Australian Productivity Commission), starts by observing that the “correct” economists’ reaction to regional trade agreements, in principle, would be one of “lukewarm opposition”, reminding us that this is also the stance of Paul Krugman who – whatever his politics – built a stellar academic career thinking about trade issues.

Regional trade agreements risk making all parties to the deal worse off, not better off –  by increasing trade between country pairs that are party to the agreement, rather than those best able to produce goods and services most efficiently.  The Australian Productivity Commission has been quite forthright in highlighting this risk as regard Australia’s various regional trade agreements (including CER, but most notably including the US-Australia FTA).    A new, quite recent study, by Shiro Armstrong, a senior academic at the Australian National University, reviewed the US-Australia FTA.    He concluded

Australia’s historic trade liberalization efforts produced clear welfare gains, and the winners and losers from these reforms were determined by market forces and competition. Trade agreements that introduce distortions and discriminatory treatment mean that winners and losers are largely determined by preferences and privileges assigned through negotiated treaties.

The US agreement carries important lessons for Australia in its future trade and foreign policy strategy.  The conclusions of the Productivity Commission’s review apply to AUSFTA. Deals that are struck in haste for primarily political reasons carry risk of substantial economic damage. The question then is whether the economic costs of such policies are worth whatever the political gain, and indeed, how the balance of properly calculated political gains and costs might look.

Rose’s stance is informed by this sort of literature and experience, which barely seems to have factored in the New Zealand debate around regional trade agreements (and does not appear in the government’s National Interest Assessment).

Rose also highlights a number of other potential problems in the TPP

Trade agreements should not include labour or / and environmental standards as they, for example, limit our right to deregulate our labour market. Be careful what you wish for when you oppose international agreements on sovereignty grounds.
The intellectual property chapters of the TPP are truly suspicious. With each new day, the case for patents and copyrights is weakening in the economic literature. Some have made powerful arguments to abolish patents and copyrights altogether.
There are modest extensions of the term limits of drug patents and much more mischief on copyright terms. These should be watched carefully in future trade talks and one day will be a deal breaker.
Good arguments can be made against investor state dispute settlement provisions even after the carve-outs. These provisions have no place in trade agreements between democracies.

Notwithstanding all this, Rose’s bottom line is

For this lukewarm opponent of regional trade agreements, the TPP is a so-so deal with small net gains. There is no harm in it signing it.

I’m not entirely sure why he feels safe in concluding that there are net gains, but he appears to put some reliance on the modelling work suggesting that reductions in tariffs and non-tariff barriers will have some beneficial economic impact for New Zealanders.

Another independent consultant, Ian Harrison, has today released a fairly critical evaluation  (trenchantly headed “Garbage In, Garbage Out”) of the modelling work, on tariffs and non-tariff barriers, that was done for MFAT and the government.  That modelling is the basis for the government’s claims about the scale of the economic benefits the agreement offers.

Ian has gone back and looked at some of the papers that underpinned the assessment of the possible gains from the reduction/elimination of non-tariff barriers and improvements in trade facilitation (eg reducing customs clearances delays).  In fairness, the authors of the MFAT modelling do discuss how shaky much of this work inevitably is –  since there are not good, or agreed, metrics for non-tariff barriers (in a way that there are for tariffs),  but the rather shaky foundations seems to have been obscured in the politicized debate around the size of any benefits.  And the original authors seem to have done, or reported, little in the way of either sensitivity or plausibility analysis around the metrics they were using.

The Harrison paper suggests that the inputs are sufficiently flawed –  suggesting, for example, that New Zealand and Australia start with some of the highest non-tariff barriers around  –  that no serious evaluation of any gains from TPP can be done using them.  It is a difficult paper to excerpt, but I would suggest reading it.

Harrison also argues that there something distinctly odd about the estimated trade facilitation benefits, estimated at $357 million per annum.  He highlights the hugely, and implausibly, high estimates that appear to be assumed for the value of clearing products just a few hours earlier.  For some goods, those estimates might be very large –  but for most of sorts of products New Zealand trades in they won’t be.  If Harrison is correct, the model assumes, for example,

that an  oil importer values oil received in 30 days time at a third less than oil received today because of the time value effect.

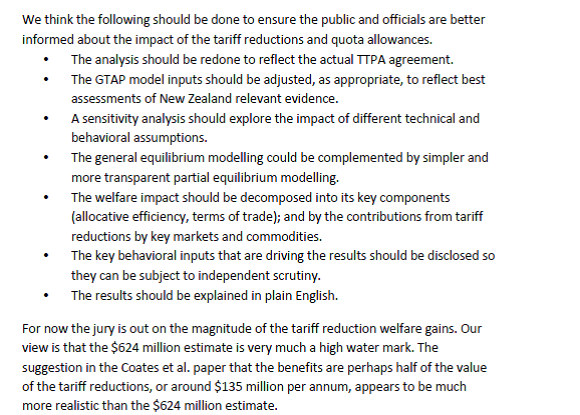
The non-tariff gains dominate the estimated benefits in the National Interest Assessment.  But Harrison also comments more briefly on the estimated benefits from reduced tariffs and increased (export) quotas

harrison

Perhaps Harrison is missing something, but on the face of it this report seems to reinforce the case for an independent assessment of the economic costs and benefits of the deal, as finally agreed, perhaps by someone like the Productivity Commission.  It is hard to do such an exercise well –  a point Rose makes –  and reasonable people will still likely differ, but for such an extensive agreement it should be an almost automatic step in the process if we are serious about considered evaluation of policy.

The issue now isn’t really whether the deal should be ratified by the New Zealand government, but whether –  having been agreed – it represents a good deal for New Zealanders.  Regional trade deals often haven’t been.  Perhaps this one is different.  But without the detailed analysis and scrutiny it will be difficult to know.


Australia’s tradables sector….and Eaqub on the RB

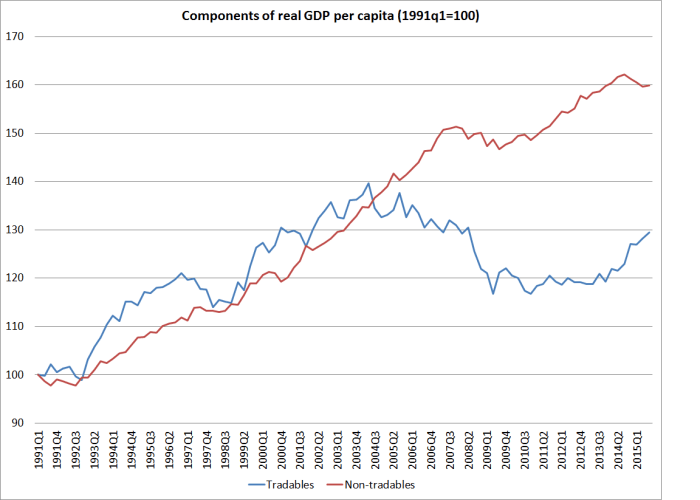
In a post on Thursday I showed this chart, a rough and ready decomposition (pioneered by the IMF) of real GDP per capita into that produced by tradables sectors (bits exposed to competition from the rest of the world) and non-tradables sectors.  My proposition was that successful high-performing economies will usually be led by strong tradables sector growth.
tradables and non-tradables gdp

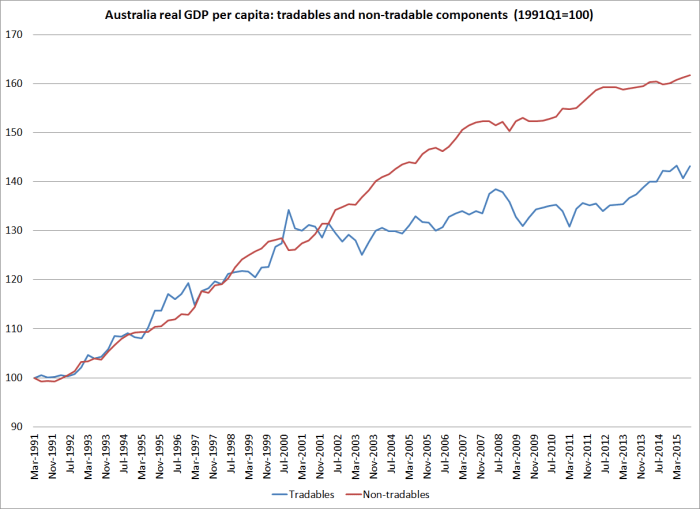
I was curious about how the comparable chart would look for Australia.

aus t and nt

Total growth in non-tradables per capita has been almost identical in the two countries over these 25 years (around a 60 per cent increase).

But look at the differences in recent years in (this proxy for) tradables sector output, per capita.

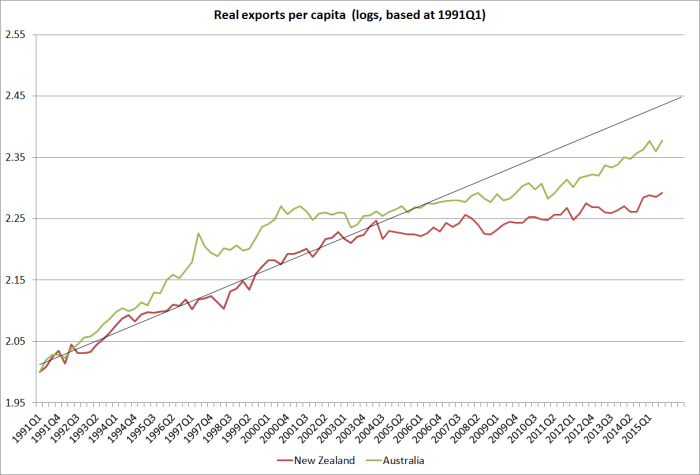
aus and nz T sector

In New Zealand, (this proxy for) tradables sector output per capita hasn’t increased over 15 years (notwithstanding the strong last few quarters).  In Australia –  which certainly isn’t a stellar economy –  the picture is much less negative.

At a sub-sectoral level, manufacturing output in Australia (per capita) has been even weaker than in New Zealand over the full quarter century.  The big difference, of course,  is simply the rapid growth in mining output.

Changing tack, just briefly…

Some readers perhaps find this blog a fairly unremitting critique of the Reserve Bank of New Zealand.  But today I’m sticking up for them.

Independent economist Shamubeel Eaqub has a column in today’s Dominion-Post, which in the hard copy version runs under the heading “Gorging a warm-up act for debt horror show”.   And “gorging” is Eaqub’s word, not just some sub-editors hype.   According to Eaqub, all New Zealand’s debt chickens are about to come home to roost –  notwithstanding, apparently, the fact that debt/GDP ratios are little changed over the last eght or nine years, and that no one has any good sense of what a sustainable, optimal, or equilibrium level of such ratios might be.

But according to Eaqub

The Reserve Bank is complicit, as they regulate banks. They say that the banking sector is not at risk. Their modelling shows sufficient capital buffers – which influence banks’ risk appetite to lend and vulnerability in a recession.

Their modelling has also shown higher inflation and interest rates for the last seven years – mistakenly.

It’s time the Reserve Bank better regulated banks to stop the repeating cycle of debt gorging and economic vulnerability.

This is really just a “guilt by association” slur.  Yes, the Reserve Bank has got its inflation and interest rate forecasts badly and repeatedly wrong, but what possible connection does that have to the question of whether banks hold adequate capital (whether risk weights, or required capital ratios)?    Or whether the stress test results are plausible?  Eaqub produces precisely no evidence to support his insinuations.  It is a short column to be sure, but surely he could at least offer readers a hint.

Lets recall that the stress tests involved a 40 per cent fall in house prices across the country, and something like a 50 per cent fall in Auckland.  And they involved an increase in the unemployment rate larger than any seen in any advanced economy with a floating exchange rate since World War Two.  And the banks still looked pretty resilient.

And as the IMF has previously noted, when they looked at a variety of other countries, risk weights on housing lending in New Zealand were materially higher than those in other countries.

I suspect there are tough times ahead for the New Zealand and world economy.  One can always argue for more capital, but to do so from the current situation  –  where New Zealand banks are better-capitalized than most –  one really needs more than simply the claim that “they got monetary policy wrong, so we shouldn’t give them credence on any other score”.


Roger Partridge on immigration

I was going to spend the afternoon watching the cricket but….it seems less bad with my back to it.

The New Zealand Initiative describes itself  as

The New Zealand Initiative is a business group with a difference. We are a think tank that is a membership organisation; we are an association of business leaders that is also a research institute

According to a recent interview with the chairman

Currently we have 37 full fee-paying members, including ANZ Bank, ASB Bank, Air New Zealand, Chorus, Contact Energy, Deloitte, Deutsche Craigs, EY, First NZ Capital, Fletcher Building, Fonterra, Foodstuffs, Forsyth Barr, Freightways, Google, Heartland Bank, KiwiBank, Microsoft, PwC, SkyCity, Todd Corporation, Vero, Vodafone and Westpac.

The Initiative has produced some interesting material since they were formed a few years ago, and I often find what they write stimulating even when I don’t agree with them.

Like many, I’m signed up to receive the weekly newsletter.  It usually has two or three brief pieces from staff on something or other that has been in the news that week, often overlapping with work the Initiative has been doing.

This week’s newsletter was a bit different.   It has a piece from Roger Partridge, the chair of the Initiative, which can really only be described as a bit of a rant.  Under the heading Immigration Grows the Pie he gets underway wanting to close down debate

Sadly, our island state is not enough to stop a vocal minority chanting their own exaggerated anti-immigration claims. In recent times, calls to halt immigration have focused on Auckland’s overheated housing market. But, as economic conditions softened last year, back came the protectionist clichés about immigrants stealing Kiwi jobs.

As it happens, we do agree on one thing.  Partridge is responding to suggestions that immigration “takes away jobs”, and as I’ve argued for years, the demand effects of immigration typically exceed the supply effects in the short-run. In the short-term, if anything, immigration lowers unemployment, all else equal (also consistent with previous Reserve Bank research).  In the longer term, immigration probably doesn’t make much difference to unemployment rates –  labour market regulation, the welfare system etc determine that.  So I agree with Partridge that

In a market economy, the number of jobs is not static. More migrants create more jobs. They mean more teachers, more retail staff, more factory workers, and more managers. In fact, more of almost everything.

But that isn’t the real question –  it is one about whether New Zealanders, as a whole, benefit, in the form of higher incomes than they would otherwise earn.

Partridge then gets rather carried away with his enthusiasm

And that is not the end to the good news. Countless international studies have shown that increases in immigration not only tend to increase jobs, but also to increase the prosperity of the host nation. We benefit from their productive endeavours, their ingenuity and their diversity. And the more skilled the migrants, the greater the benefits.

That there are gains from immigration has received cross-party support in New Zealand since at least the 4th Labour Government. Let us hope the anti-immigration demagoguery falls on deaf ears. Going down that path we all lose.

The challenge is not keeping out the migrants; it is keeping out the bad ideas. Luckily, that does not need a wall, just clear thinking.

Well, we can debate the “countless international studies”.  As I’ve pointed previously, plenty of studies actually show that in the last great age of globalization, immigration actually narrowed income differentials –  incomes in the countries people were leaving rose relative to incomes in the countries they were coming to.  Economic success –  resulting from combination of better institutions, productivity shocks, or resources –  enabled countries to support immigrants at no undue cost to themselves, and relieved (just a bit) a burden on the source countries (Ireland, Sweden, Italy, UK etc).

But, actually, my reading of the literature and international experience on immigration is really an “it depends”.  Has immigration to Uruguay, Chile and Argentina benefited either side?  Most immigrants came from Spain and Italy, and the destination countries have Spanish-shaped institutions etc.  But income per head in all three Latin American settler countries is well below that in Italy and Spain –  two of the less successful Western European countries.  With hindsight, those immigrants probably should have stayed at home.

But our interest is surely New Zealand.  Can Partridge produce a single study –  let alone “countless” ones – that demonstrate that high rates of immigration have benefited New Zealand, whether in the post-war decades, or since the new National-Labour consensus developed at the end of the 1980s and early 1990s?

I’ve read pretty widely in the New Zealand literature and I’m not aware of any such studies.  MBIE and Treasury, in their advice to ministers on immigration can’t point to such studies.  Mai Chen’s recent taxpayer-supported  “superdiversity” report couldn’t.    There is a single paper around –  a modelling exercise from 2009 –  which purports to show such gains, but in fact it doesn’t. It can’t in fact  –  it is the sort of model that produces the answers you set it up to produce (something the authors recognize if not all the users).

There are simply no empirical studies demonstrating that one of the highest rates of immigration in the advanced world has actually produced any gains for New Zealanders as a whole (of course some gain, but many others lose, from (eg) the interaction of a distorted housing market and immigration policy, or the transfer between New Zealand diary workers and foreign ones).  Our productivity is lousy (total factor productivity included), and the tradables sector struggles to produce a much per capita as it was doing 10-15 years ago. Our own people keep leaving.  There is no simply evidence of any overall benefits for New Zealanders.  I’d be inclined to agree with Partridge that skilled (and innovative) immigrants would be better than the alternative,  but as I’ve illustrated previously  (and here) most of the immigrants we get aren’t particularly skilled at all.

Partridge is, of course, quite correct that

That there are gains from immigration has received cross-party support in New Zealand since at least the 4th Labour Government

The political and bureaucratic elites have been at one on that.  But there is simply no actual evidence, about specific developments in New Zealand in these few decades, that actually supports their belief about what our immigration policy would do for New Zealanders.    Perhaps it was a reasonable policy to adopt 25 years ago –  there was a lot of  belief that New Zealand was about to flourish, and perhaps there would be plenty of gains to share around.  But we haven’t flourished. We’ve languished, and it increasingly looks as though the migration policy was a misguided and perhaps quite damaging choice in our specific circumstances.

What New Zealand needs is some rigorous debate on the issues and evidence, not rather desperate attempts to simply rule any debate on immigration issues out of court.


John Kay on banks, regulators and politicians

The Treasury has had Professor John Kay in town this week.  Kay has had a long and distinguished (microeconomics-focused) career in the United Kingdom as an academic, adviser, FT columnist, author etc and last year published a new book Other People’s Money: Masters of the Universe or Servants of the People, the introductory chapter of which is here.  Key’s Treasury guest lecture was built around the ideas in this book.  To be clear, I have not read the book –  although despite the skeptical comments that follow I may now do so.

It wasn’t a lecture, and apparently isn’t a book, about the 2008/09 financial crisis per se.  That said, the book probably wouldn’t have been written without the crisis, and he clearly sees the crisis as a manifestation of what, in his view, has gone wrong with the financial sector. In a line from his website :

The financial crisis of 2007-8 has dominated subsequent discussion of economic policy. In my view the responses are characterised by two widespread misunderstandings. The first mistake is to believe the crisis is an inexplicable, once in a lifetime, event, rather than another demonstration of an increasingly dysfunctional financial system.

Kay began with a line many have used –  the changing nature of the people who go into banking.  In the 1960s, when he grew up in Edinburgh, banking was for the people not quite smart enough to get into university (as in New Zealand, only a small proportion of school leavers then went to university).  By contrast, these days finance attracts many of the smartest graduates from top universities.  The range of products is, of course, much more complex.  But not, Kay would argue, so correspondingly socially useful, despite the staggering remuneration on offer to a fairly small number of people in these institutions (if I recall rightly, he notes that most people in the big UK bank Barclays actually earn less than the UK median wage).  And, of course, the incidence of financial crises is much greater today than it was in the post-war decades.

For a time, politicians across much of the advanced world fell at the feet of bankers.  Kay showed an amusing clip of Gordon Brown, then Chancellor of the Exchequer, opening a new headquarters in Europe for Lehmans only 10 years or so ago.  And in the United States in particular, there is the ongoing unease over the revolving door that seems to operate between senior government positions and highly-remunerated positions in the financial sector  (it isn’t just Goldmans’ alumni going into government and back into the financial sector (eg Robert Rubin), but the flow from government positions into the financial sector –  be it Bernanke, Summers, Geithner or whoever).  Bernie Sanders is currently tapping that anxiety.

Kay isn’t “anti-finance”.  As he notes

A country can be prosperous only if it has a well-functioning financial system, but that does not imply that the larger the financial system a country has, the more prosperous it is likely to be. It is possible to have too much of a good thing. Financial innovation was critical to the creation of an industrial society; it does not follow that every modern financial innovation contributes to economic growth. Many good ideas become bad ideas when pursued to excess.

And so it is with finance. The finance sector today plays a major role in politics: it is the most powerful industrial lobby and a major provider of campaign finance.

He seems to be arguing some combination of the following:

  • Banks are too large, and encompass too many different types of activities within them,
  • Banks should be broken up.
  • There is “too much finance”
  • Banks have huge political clout (especially in the US and the UK), and exercise that in their own interest, in particular in the (successful) pressure for bailouts.
  • Someone should pay for what went wrong in 2008/09.
  • Banking regulation has become too prescriptive and detailed.

I didn’t find the overall story that persuasive, partly because it doesn’t seem to generalize across countries, and partly because it doesn’t even seem to get to the heart of the 2008/09 issues.  There are bits of the story I agree with  –  concerns about the volume of increasingly detailed, lawyer-driven, focus of regulation, often in effect more concerned with process and form than with economic substance.  And I sympathise with his unease about the hubris implicit in the belief among central bankers that they can somehow determine what risk weights to use for each and every type of credit.

So what bothers me?

First, is there any evidence that banks were “bailed out” because of the political clout of the sector?  I’ve read huge number of the books written since the crisis, and tracked events through the crisis very closely, and that interpretation simply just doesn’t ring true –  in the US, the UK, Ireland, or anywhere else for that matter.  After all, by and large it was not bank shareholders (or senior management) who were bailed out –  and many of the senior management of banks had large proportions of their own wealth tied up in shares in their own banks.  The bailouts typically primarily benefited creditors  (not exclusively –  after all, even Bear Stearns shareholders walked away with a small amount of their money)  and – so the argument went –  the economy as a whole.  Creditors weren’t always voters, but most voters were creditors of banks in one form or another, and most were employees –  alarmed at the prospect of extreme economic disruption.

This isn’t the place to debate whether any or all of the bail-outs were good things or not, simply to note that –  as things were by 2008 –  they would have happened, largely as they did, if financial sector interests had had no clout and no superior access to politicians at all.

And what of the line that banks are simply too big and complex to be run effectively?  Well, for decades we saw that argument run about corporate conglomerates across the western world (including our own Fletcher Challenge).  But actually the market had ways of taking care of that problem –  companies were bought up, restructured, dismantled etc, by purchasers who could make more of the assets that the unwieldy conglomerates could.    The “asset strippers” weren’t always attractive personalities, and some probably went close to (or even beyond) the edge of the law, but the point simply was that the market has a way of ensuring that assets are owned by those who can place the highest value on them.   Bank takeovers aren’t always easy, but they happen.  It isn’t obvious what the (financial stability) policy problem is, unless a strong case can be mounted that some combination of size and complexity effectively buys a bailout insurance policy.  I don’t think the evidence for that point is particularly persuasive either.

At one point is his lecture drew the distinction between whether we thought as banks as a “den of thieves” or as a “monastery”.  I’m not sure either description is remotely warranted.  Avaricious, arrogant and unpleasant as many of these leading bankers seem to have been, I don’t see any sign that the crises of 2008/09 –  in any country –  occurred because anyone systematically set out to dupe anyone else.  Don’t get me wrong: I’m not suggesting there was none of that sort of activity, simply that much more of what went on is down to some combination of:

  • choices of politicians (choosing to adopt the euro, which involved holding interest rates well away from natural interest rates for year after year –  most obviously in Spain and Ireland –  and the high degree of political pressure brought to bear in the United States on the financial system to take on low quality housing loans)
  • collective over-optimism, among borrowers, lenders, citizens and politicians.

Were people let down?  Yes, no doubt.  Banks failed, but so did most of the world’s leading regulators and central bankers (as Kay put it, the effortless subsequent continued rise of several, who had been quite dismissive of risk before the crisis, illustrates the “unimportance of being right”), and most of the world’s leading finance ministers (and most of those who might have wanted to replace those central bankers and finance ministers).  So who should pay, and in what form?

And of course there is the “so what” question.  If one believes that the financial crises (or even the build up of debt prior to the crisis) was responsible for the world’s current economic travails (eg GDP per capita 15 per cent or more below pre-crisis trends) one might perhaps regard the financial sector as a dangerous bacillus, attacking the common wealth.  But as I’ve noted here several times, I don’t think the case is that strong.  Through its history, for example, the US was plagued by financial crises, and yet each time the economy bounced back  – usually quite quickly –  to much the same growth path it was previously on

What of New Zealand?  Is there too much finance here?    We don’t have complex banks (they lend, mostly in quite vanilla forms, and the borrow –  domestic households and institutions, and from abroad.)  We don’t have many complex instruments either –  actively traded or not.  It isn’t obvious banks have huge political clout either –  for better or worse, in the midst of the crisis we forced them to join the deposit guarantee scheme, we forced through the local incorporation policy, we compelled them to pre-position for OBR, and we’ve imposed higher effective minimum capital requirements than most of the countries.  We didn’t have a domestic loan losses financial crisis during 2008/09 (actually neither did the UK), and yet, as I’ve repeatedly highlighted, our economic performance over the last decade has been distinctly mediocre.  There is a lot going on globally, insufficiently understood, but it isn’t yet remotely clear that finance is the problem, rather than just another symptom.

finance and insurance

The New Zealand financial sector is larger than it once was. But much of that isn’t about  over-mighty financial institutions and their “master of the universe” bosses  – although we had our period of craziness in the mid-late 80s.  But if high house prices here  –  as in much of the West –  are about the interaction of supply restrictions and population pressures, the increase in the stock of credit is substantially an endogenous response to those structural distortions.  If governments make urban land really scarce and expensive, younger generations will need to borrow more real resources from older generations to be able to afford a house at all.  The stock of credit (on the one side) and deposits (on the other side) rises, and financial institutions facilitate that-  and value-added associates with that activity and accordingly appears in the national accounts.  Don’t blame banks for that, but governments that so badly mess up the markets in housing supply.

I’m left uneasy about what social value much of the activity in the financial sector generates.  As an analyst, even as a citizen, I’m curious about that.  But I’m not sure that Kay –  or others –  have made a convincing case that is deeply harmful either. In principle it could be –  as others might argue that sugar, alcohol, fast food, or fast cars could be harmful.    Kay avers that he wants less intrusive regulation, but in fact the thrust of his arguments tends to give aid and comfort to those who want more of it.  That appeals to regulators, responds to a public itch “something is wrong, and banks aren’t overly sympathetic causes”, but doesn’t rest sufficiently on a hard-headed analysis of the role of governments and regulators in past crises, and the importance of markets –  messy as they often are – as “a chaotic process of experimentation…the means through which a market economy adapts to change”.

That last quote comes from an excellent lecture, The Future of Markets, which I return to often, given by one John Kay in 2009.

In conclusion, I would just note that at one of his sessions this week, Kay was apparently asked about deposit insurance. He asserts that it is simply imperative: without it the pressure for bailouts of all creditors inevitably becomes almost impossible to resist.  It was a point I made here last week, and remains good advice for our political parties, our government, and for those among the official agencies who continue to believe that the OBR tool deals with these pressures.

Unborn firms utter no cries

Late last year, in a series of posts on the quarterly national accounts I showed this chart of export volumes per capita (for New Zealand and Australia).

exports real pc

Exports (per capita) had carried on growing over the last decade or so, although at a materially slower rate than they had been growing previously.

Exports matter, but they are only one outcome of the international competitiveness of the New Zealand economy.  Another way of looking at things is to think of the economy as divided between tradable and non-tradable sectors.  It is a useful analytical device, but (like many useful economic concepts) doesn’t map 100 per cent easily onto the official data we have available.

My proposition (not, I think, overly controversial) is that a high-performing economy will be one in which the tradables sector –  the bits selling to, and directly exposed to competition from, the rest of the world –  is growing strongly, absolutely and certainly in per capita terms.   Such growth in the tradables sector in a mark of the success of companies operating here in being able to meet, and succeed in, the global market.  There is, of course, nothing wrong with non-tradables activity: we want phone services, cafes, theatre, and holidays at the beach.  But it is exceedingly rare that a strong sustainable economic performance, especially in a small economy, is led from production in the sectors that aren’t exposed to international competition.

In an IMF Article report from perhaps 10 years ago the Fund staff had the clever idea of representing the tradables and non-tradables sectors in a single chart.  It was rather rough and ready, and the Fund knew it, but it helped illustrate something of how the New Zealand economy had been unfolding.   They started with the production measure of real GDP, and allocated the primary and manufacturing sectors to tradables.    Our exports and imports are typically either primary or manufactured goods, or they are services.  To proxy the contribution of services to tradables production, they took the services exports component (from real expenditure GDP) and also assigned that to the tradables sector.  Everything left over was non-tradables.   The resulting chart was reproduced in various fora around Wellington over the years, even used by the Minister of Finance  –  much to the distaste of purists.

I hadn’t seen the resulting chart for a while, and was curious how things had been going.  In particular, given the rapid growth in the population over the last decade, I was curious about how tradables sector activity had been doing per capita.  After all, both National and Labour governments have constantly talked of strengthening New Zealand’s international competitiveness, international connections etc.

In this chart, I’ve shown primary and manufacturing real value-added per capita, and real services exports per capita, back to when the quarterly population series began in 1991.  Each component here is indexed to 100 in 1991.  At the end of the period, these three components of tradables production are of broadly similar size.

tradables components

If your eye is drawn to the services line, as it probably is, bear in mind that not one of these series is now at its historic peak.  One peak was in 2004, one in 2005, and one (primary) in 1997.     By contrast, real per capita GDP is at its historic peak –  growth hasn’t been strong over the last decade, but has been around 8 per cent over the last decade.  Per capita export volumes haven’t been doing that well (see first chart above) –  but they have clearly done a whole lot better than the domestic (import-competing) component of tradables production.

So here are the aggregate tradables and non-tradables components, as proxied by this particular approach.

tradables and non-tradables gdp

I found it a rather bleak picture, to say the very least.  Tradables sector production, per capita, is now nowhere near as high as it was as much as 12 or 13 years ago.  It is most unlikely that New Zealand will make any progress at all in sustainably closing income and productivity gaps to the rest of the advanced world if it can achieve no growth in per capita tradables sector production over a period that long.

Why has it happened?  What has so strongly skewed production towards non-tradables?  I’d argue that it has, primarily, been rapid population growth, which had to be accommodated through a much higher exchange rate (the big step in the exchange rate dates back to 2003). For many of our tradable product sectors, raising our own population does nothing to materially boost output –  land and sea and mineral resources are given, and the (real and significant) productivity possibilities in those sectors are independent of population.  And the higher exchange rate just made it that much harder for other firms in the tradables sector to survive or thrive.  The exchange rate has been so high for so long that we don’t hear many squeals any more –  those who can thrive at these exchange rates do, and dead firms and unborn (ie never launched) firms utter no cries.  Loosely speaking, it is a fully-employed economy (no 5.3% isn’t full employment, but 4.5% might be –  and that difference is swamped by the scale of the divergences evident in this chart), but it isn’t a path to sustained prosperity.   Non-tradables firms, especially in Auckland, do well –  as they do in every population-fuelled boom anywhere (in history or now) –  but it isn’t a path to sustained national prosperity.

Are there some caveats to the story?  Yes, sure. The Christchurch repair and rebuild process exacerbated the skew to non-tradables, and there wasn’t anything much we could do about that.  And high terms of trade, in principle, made it less necessary to produce tradables volumes (price substitutes for volume)….but, in the longer term, higher terms of trade tend to induce strong investment and volume growth in the sectors that are benefiting.  There was no sign of that in New Zealand.

As I noted, purists don’t like the tradables/non-tradables chart, for a variety of reasons (some good, others less so).  A couple of SNZ staff made an effort a couple of years ago to do a slightly more refined version. It was a worthwhile exercise, but I wasn’t persuaded that the more complex version materially altered the results, while making it a bit harder to explain just what had been done.  Bottom line: this has been quite an unbalanced, more inward-focused, economy for more than a decade now, and there is little real sign of that sustainably changing.


The IMF at sea on New Zealand’s (lack of) growth

As I noted yesterday, the IMF released several “selected issues” background papers in association with the release of the New Zealand Article IV report.  These papers are usually a little more in-depth than the main report, and the topics chosen reflect some mix of the expertise and interests of the people on the staff team and the priorities of the New Zealand agencies involved (Treasury and the Reserve Bank).  In my experience, the efforts of the team are often spread too thinly and so unfortunately not many of the papers have added very much to the understanding of the macroeconomic issues facing New Zealand.

The papers this time are:

  • Prospects for potential growth in New Zealand
  • House prices, household debt, and financial stability in New Zealand, and
  • New Zealand – Options for Tax Policy Reform

It would be interesting to know whose initiative the last paper was done at.  My guess is that Treasury may have reacted to the Fund’s anguishing about savings with the comment “well, show us what might actually make a difference”.   Unsurprisingly, the Fund doesn’t conclude on an optimistic note:

while there is some ambiguity on the effectiveness of tax incentives to raise private savings, short of the introduction of a compulsory savings scheme there are no alternatives to providing incentives.

There are real doubts our policies will work, but……we have to do something.  Not exactly reassuring.

The potential growth paper has a few interesting charts, and recognizes the probable importance (as a symptom)  of the ex ante savings/investment imbalances [1] that have given us persistently high real interest rates (relative to those abroad) and a real exchange rate that has been persistently out of line with medium-term fundamentals.  But the authors don’t have much of substance to offer on the way ahead.  They, like everyone else, can see the gaps between us and the world, but they don’t seem to have a “model” –  a way of thinking about or understanding the issues – that can usefully help respond to the specifics of New Zealand’s underperformance.

They believe

there are few if any low hanging fruit in terms of reform……..however, there may be targeted areas for improvement

They claim that

increasing New Zealand’s international exposure is a major aspect of productivity oriented reforms

but the actual list of reforms, and the evidence or arguments connecting them to the desired outcomes, is thin (and sometimes questionable), to say the least

  • “directly enhance innovation through greater expenditure on R&D”
  • “increase labour productivity through education”
and a couple of ideas picked up from last year’s OECD report
  • user and congestion charging for infrastructure, and
  • “more frequently update immigration targets and skill shortage categories”

The final paragraph of the whole paper begins by noting that there are “no obvious liberalization policies at hand”, and then lapses into the rather trite (because there is nothing to back it)

efforts would have to be made to exploit opportunities for greater international integration in order to boost competitiveness and overcome the disadvantage of distance

But for all this, in its apparent enthusiasm to accentuate the positive the IMF actually understates just how poorly New Zealand has done in recent years (or decades).   In particular, I was surprised to find this assertion in the report, citing the experience over the period 1995 to 2012.

Compared with other OECD countries, New Zealand’s TFP growth performance compares favorably

I was taken aback by this claim, and wondered what I had missed, so I went to check the data on the OECD website.  The OECD compiles TFP estimates for only 20 of its member countries.  Here is the total growth in TFP for each of them for that 1995 to 2012 period.

oecd tfp growth 95 to 12

We’ve been the lower quartile country for that whole period.  The only four countries which did worse over that period are either in the euro or tied to it (Denmark), and three of them (Spain, Italy, and Portugal) have had a simply atrocious economic performance in recent years.  If one looks as just the most recent 10 year period for which the OECD has data (2003 to 2013) we were actually second worst of all these OECD countries.

Estimating TFP growth rates involves a model – a way of estimating the contribution of capital and labour to growth, isolating the resulting TFP residual.  The OECD’s approach isn’t the only one, and I’m not sufficiently expert in the field to offer an opinion on which approach is best.  One other big international database that reports TFP estimates in the Conference Board, which produces estimates for a much wider range of countries.

I had a quick look at 37 pretty advanced economies for which the Conference Board reports complete data.  For the IMF’s chosen period –  1995 to 2012 –  there were only seven countries that had recorded less TFP growth than New Zealand had done  (the ones who did worse than us on the OECD measure, and Chile, Norway, and Greece (for whom the OECD reports no data).  So even on this measure, for this range of countries, we’ve been no better than a bottom quartile performer.  The Conference Board has data for all 37 countries as far back as 1989-  and since then, only Spain, Portugal, Greece, Turkey and Hungary have done worse than us.

The Conference Board reports estimates up to 2014.   Here is how those 37 countries have done over the most recent 10 years for which they have data, 2004 to 2014.

conference board TFP 04 ot 14

The picture doesn’t really change.  It is, perhaps, a little less bad than on the OECD’s ranking, but again we’ve been no better than a lower quartile performer.

TFP isn’t the be-all and end-all, and for minerals producers in particular it can be driven downwards in periods of high commodity prices (because less accessible, or lower grade, resources are (profitably) mined).  But there is really no way of looking at the New Zealand performance and reading it as any sort of good news story.

It is surely about time that the elites –  be it leading offshore agencies like the IMF and OECD, or our political and bureaucratic ones –  began to recognize, and state openly, just how consistently poor New Zealand’s economic performance has been, and to acknowledge just how limited or inadequate the policy responses they put up to deal with it  are, and have been.   Identifying policy responses might be hard –  although I reckon that a major reorientation of our immigration policy would go a fair way –  but the first step is an honest assessment that recognizes that what we have been doing simply hasn’t been working.  And it is no use falling back on “but its nice place to live” – as I’ve noted previously, Uruguay looks to have nice beaches – or “but lots of people want to come here” –  well, of course, poorly performing as we have been, we are still richer than China, India, South Africa or the Philippines.  The better test is what our own people are doing – and they just keep on leaving, even though the hurdles to doing so (in Australia in particular) have been getting higher

[1] They even approvingly cite my 2013 paper.


The IMF Report: saving and vulnerability

The IMF released its latest Article IV report on New Zealand yesterday.  There are also some background research papers released with the report, and I might come back to look at them later.

There aren’t material surprises in the IMF’s views in the full report, which builds on the Concluding Statement released at the end of the staff mission here last November.  My comments about that statement (here) were fairly critical, noting both the marked change in the messages from one review to the next, and the fairly limited evidence base for many of the policies the Fund was recommended –  quite a few of which were a considerable distance removed from the core business, or expertise (macroeconomic policy and financial stability) of the International Monetary Fund.

Today I wanted to focus just on the Fund’s claim that there is a major policy problem as it affects savings in New Zealand, a proposition on which much of the rest of the report rests.  The Fund talks of a “chronically low national saving” rate, and worries about the vulnerability that allegedly results from a net international investment position (NIIP) of around -65 per cent of GDP.  In the Fund’s Board discussion, we read that “Directors agreed that raising national, and in particular private, saving is critical to reducing external vulnerabilities from the still heavy reliance of offshore funding”.  Note the strong words:  action is “critical”.

I’ve shown a version of the following chart before.  It is common to present charts of net national savings as a per cent of GDP, but to do so involves two errors: first, the numerator is net but the denominator is gross (the difference is depreciation), and second, the numerator refers to savings of New Zealanders and the denominator refers to economic activity occurring within New Zealand, whether owned by foreigners or New Zealanders.  A more conceptually meaningful approach is to do as I do here: compare the net savings of New Zealanders with the net national income of New Zealanders.  Here it is shown all the way back to 1970.

net savings to nni feb 2016

Savings of New Zealanders (public and private combined) as a share of income have been consistently lower than the median of the whole group of OECD countries.  But there is a very diverse range of experiences, and cultures, within the OECD group.  I’ve also shown the comparison with the median of the five other, probably more culturally similar, Anglo countries (US, UK, Canada, Australia, and Ireland).  Over the 45 year period, mostly we don’t look much different from the Anglo median –  we did worse in the years of very large fiscal deficits in the late 70s and early 80s, but other than the experiences are pretty similar on average.     Where is the evidence of a chronic savings problem?  And it is no defence simply to focus on private, or (worse) household savings: first, the boundaries between household and business savings are blurred, and second, the private sector takes account (typically implicitly) the savings behavior of governments over time.  New Zealand governments have done less badly than most for some decades.

The IMF makes no systematic effort to identify reasons why national savings rates might have been as they are.  Instead, they mostly repeat old lines that don’t have much basis to them.  For example, they assert that an overwhelming proportion of household assets are in the form of housing, even though new Reserve Bank estimates –  published almost a year ago –  make clear that that claim was never justified.  After all, relative to population, there is now a consensus that we have too few houses not too many.  The Fund also asserts that there is something wrong with the tax treatment of housing, but appears to make no effort to illustrate, whether in a cross-country or time series context, how that has contributed to national savings behavior.  They urge changes to Kiwisaver and the NZS, but again make little effort to illustrate how policy parameters in these areas explain savings behaviour.  All in all, it seems like a rather weak basis on which to rest quite strong policy recommendations.

The other aspect of this issue which they just seem to take for granted is the alleged vulnerability that the NIIP position gives rise too.  Buried deep in an Annex to the report, they do produce a chart making clear that there has been no worsening trend in the NIIP position for over 25 years –  the negative position tends to widen in boom times and narrow in downturns, but has fluctuated around a pretty stable trend level.  At present, the negative NIIP position is actually below (less negative) than the average since 1988.

The report has no analysis of the nature of the vulnerability that this NIIP position gives rise to –  even though addressing this vulnerability is considered “critical” by staff and Board.  And it gives no example of any country, anywhere, ever,  in which a stable (but quite high) negative NIIP position over 25-30 years has been (causally) followed by a crisis.  I’m pretty sure there are none –  and remind that IMF that for most of its first 100 years, New Zealand’s negative NIIP position was materially larger than it has been over the last 25 years, again without ending in crisis.  There are plenty of cases where a rapid worsening in the NIIP position over a few years led to trouble –  Spain, Ireland, and Greece are three recent advanced country examples –  but that is a very different situation from the New Zealand situation in recent decades.  As has been the case for many years, the IMF simply seems to struggle to come to grips with New Zealand.

Most of the negative NIIP position is represented by (net) banking system borrowing from abroad.  But that creates serious macroeconomic risks only if the assets that are financed by the overseas borrowing are of poor quality.  Often that is the case when foreign debt is rising quickly  –  but that hasn’t been the New Zealand story.  Perhaps the Fund believes that the New Zealand banking system is shaky?   But Directors noted that “the banking system is resilient and well-supervised” –  the resilience conclusion is certainly backed by the Reserve Bank’s own stress tests, which I discussed at length last year.

New Zealand deserves better quality analysis and insights from its membership of the IMF than it has had in the main part of this report.

The report also contains brief sections headed “Authorities’ views” –  the wording of which will have been approved by our Treasury and the Reserve Bank.   I was surprised to find that “the authorities agreed that raising national saving was an important policy objective”, going on to state that the authorities would “consider measures to boost private saving….in the future”.  There isn’t much elaboration of the point, but the statement itself was something of a surprise.  Last I had heard, the Minister of Finance was very sceptical that there was a “national saving problem” in New Zealand, and particularly that there was an issue materially amenable to policy remedies.  If one can’t convincingly identify policy distortions that materially lower national saving rates relative to those in other countries, it is hard to see a good case for policy interventions to encourage people to save when, on their own, they would not.    It would be interesting to know what was behind this latest, apparent, change of view.


Lessons from Mario Draghi

In two successive days last week, two heads of central banks gave speeches on monetary policy.   Graeme Wheeler’s speech was characterized by a rather desperate defensiveness –  attacking nameless critics for views that no one seems to hold, in an attempt to defend his (and the Bank’s) rather poor track record: a CPI inflation rate that hasn’t been at the midpoint of the target range for four years.

A commenter pointed me to ECB head Mario Draghi’s speech, given the following day, “How central banks meet the challenge of low inflation” .   It isn’t a perfect speech by any means –  the claim that “monetary integration in the euro area is both complete and secure” must just be one of those lines he has to use, regardless of the continuing severe stresses on the system.  It is a speech of two halves –  the second half is about the particular challenges of the euro area, but the first half is an excellent and authoritative discussion of how central banks generally should respond to low inflation.

Core inflation in each jurisdiction is quite similar: in 2015 CPI inflation ex food and energy was 1 per cent in the euro-area, and was 0.9 per cent in New Zealand.  If anything, New Zealand’s inflation target is a little higher than that for the euro-area: our Reserve Bank is required to focus on 2 per cent, while the ECB articulates its goal as keeping CPI inflation close to, but below, 2 per cent over the medium-term.

Draghi’s speech is well worth reading.  It is the speech of someone who has a deep belief in the power of monetary policy – that inflation is, over time, a monetary phenomenon, and that if inflation is persistently below whatever goal is set for the central bank it is the central bank’s responsibility to do something about it.    It is a refreshing speech, especially as the ECB is no doubt closer than it would like to the limits of conventional monetary policy (with the policy rate already below zero).    Draghi could have offered excuses, but instead it is robust call for monetary policy to simply do its job.

Draghi draws on the lessons of the 1970s, when central bankers often wanted to shift the responsibility for high inflation onto other structural forces.  He fully recognizes the wide range of shocks than can hit an economy (demography, technology etc), and the way some of them can persist, but  argues that monetary policy authorities are responsible for offsetting the effects of those shocks on inflation –  whether they are pushing upwards (as in the 1970s) or downwards (as at present).

… in a context of prolonged low inflation, monetary policy cannot be relaxed about a succession of supply shocks. Adopting a wait-and-see attitude and extending the policy horizon brings with it risks: namely a lasting de-anchoring of expectations leading to persistently weaker inflation. And if that were to happen, we would need a much more accommodative monetary policy to reverse it. Seen from that perspective, the risks of acting too late outweigh the risks of acting too early.

In sum, even when faced with protracted global shocks, it is still monetary policy that determines medium-term price stability. If we do not “surrender” to low inflation – and we certainly do not – in the steady state it will return to levels consistent with our objective. If on the other hand we capitulate to “inexorable disinflationary forces”, or invoke long periods of transition for inflation to come down, we will in fact only perpetuate disinflation.

This is the clear lesson of monetary history, especially the experience of the 1970s.

Nor does he offer up excuses of the sort that “inflation is low everywhere, so there isn’t much we can –  or perhaps should –  do about it”.

We now have plenty of evidence that, if we have the will to meet our objective, we have the instruments.

and

So there is no reason for central banks to resign their mandates simply because we are all being affected by global disinflation. In fact, if all central banks submit to that logic then it becomes self-fulfilling. If, on the other hand, we all act to deliver our mandates, then global disinflationary forces can eventually be tamed.

He even deals with the line of argument that easing monetary policy to get inflation back to target may do more harm than good.

Still, there are some that argue that even if central banks can lean against global disinflationary forces, in doing so they do more harm than good. In particular, expansionary monetary policies at home lead to the accumulation of excessive foreign currency debt or asset price bubbles abroad, especially in emerging markets. And when these financial imbalances eventually unwind, it weakens global growth and only adds to global disinflation.

To which his response is:

In fact, when central banks have pursued the alternative course – i.e. an unduly tight monetary policy in a nascent recovery – the track record has not been encouraging. Famously, the Fed began raising reserve requirements in 1936-37, partially due to fear of a renewed stock bubble, but had to reverse course the next year as the economy fell back into recession. That has also been the experience of some central banks in recent years: raising rates to offset financial stability risks has undermined the primary mandate, and ultimately required rates to stay lower for longer.

This suggests that the so-called “assignment problem” between monetary policy and financial stability at the domestic level should also apply at the global level. Monetary policy should not try to balance opposing objectives: it is optimal for all parties if it delivers its mandate. And if that creates financial stability concerns, they need to be addressed by other policies more suited to the task. And in fact there are several policy levers available.

Countries can improve their financial regulation and supervision to make their financial systems more resilient to external shocks. They can adjust their fiscal policies. They can adopt macro-prudential measures.

That is the sort of speech that Graeme Wheeler should have been giving last week – indeed, given how badly inflation has been undershooting the Reserve Bank’s target, he should have been giving it a year or two ago.  Instead, he drove up interest rates –  when his preferred measure of core inflation was even lower than it is now.  And even now that the OCR increases have reluctantly been fully reversed, we are left with real interest rates that are higher than they were two years ago, even as confidence in inflation getting back to target erodes further (and the terms of trade have fallen, the peak impulse from Christchurch has passed, and the global situation has materially worsened).

Chris Green, at First New Zealand Capital, had a commentary out late last week on the Governor’s speech.  I agreed with almost all of it.  But two lines particularly caught my eye:

“My sense is that the Governor is far more focused in defending his current position than objectively attempting to assess the optimal risk-adjusted monetary policy response”

and

“The perception that they give of a reasonably high hurdle before cutting rates would be more consistent with CPI out-turns around the top of the band, not having been below the midpoint for more than 5 years [I presume he means on the Bank’s preferred core measure] and not projected to get back there until the December quarter of 2017 –  at the earliest”.

Quite.   And one could add that the problem is compounded by the Governor’s reluctance to substantively engage with the issues –  rather than responding to straw men of his own imagining –  or indeed to open himself to sustained scrutiny from the media.

The Governor and his chief economist have been putting a lot of weight on inflation expectations measures recently, and suggesting that there is really nothing to worry about.  We’ll have a new round of inflation expectations data shortly, and I’ll come back to the topic then, but for now consider this chart, drawn from the Bank’s survey of household expectations.

household expecs Feb 16

People are asked whether they expect inflation to rise, fall or stay the same over the coming year.  The survey has been running for over 20 years, and in every single survey a net balance have reported expecting inflation to increase (suggesting that not much weight should be put on the absolute numerical value of the answer).  But what I wanted to highlight is that at present fewer people expect inflation to rise than at any time in the history of the series, with the exception of the depths of the recession in 2008/09.    But in March 2009, when only 20 per cent people expected inflation to rise over the coming year, the last annual inflation rate they’d seen was 3.4 per cent.  Of course –  in the middle of a recession, with plummeting oil prices –  they didn’t expect inflation to rise.  And they were right.  Annual inflation fell sharply.    The most recent observation in the survey was November 2015.  When those respondents completed the survey, the most recent annual inflation rate they’d seen was 0.4 per cent.  And still, not many (by historical standards) expected annual inflation to rise.   There is nothing to be complacent about in the inflation expectations data –  and even among more expert observers, medium-term inflation expectations are lower, relative to the target midpoint, than they have been since inflation targeting began.

It must almost be time for the Minister of Finance’s annual letter of expectations to the Governor.  As I noted last year, the persistent undershoot of the target has had little or no attention in  past year’s letters.  We must hope that this year’s is different.  The primary responsibility for the persistent undershoot of the target rests with the Governor, his chief economist, and his other senior advisers.  But the apparent passivity to date of those charged with holding the Governor to account –  the Minister of Finance, who set the target, and the Bank’s Board, paid to monitor the Governor’s pursuit of the target –  risks making them complicit in the failure.  After all, together they were responsible for the appointment of an individual as Governor who increasingly seems to lack the stature and qualities that the position demands.