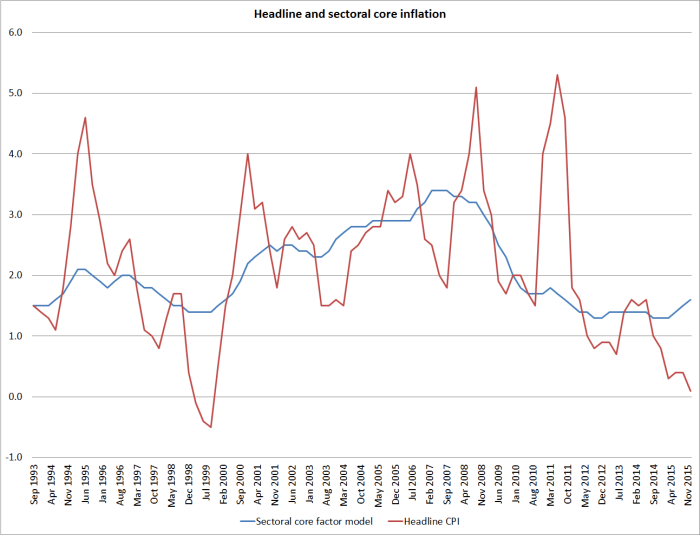
Keeping inflation near target: easier here than for most

Some of the discussion around New Zealand’s low inflation rate, and the question of what the Reserve Bank should do (or have done) about it, has a strong element of “it has been awfully hard to keep inflation up near target, not just here but everywhere in the advanced world”.  In other words, we shouldn’t be too critical of the Reserve Bank because they have just been struggling with the same problems everyone else has faced.  Everyone, perhaps, except Norway?

Inflation is, ultimately, a monetary phenomenon.  But monetary policy works and responds within a wider economic climate, where there can be all sort of other pressures at any one time.  Sometimes those other pressures work in the same direction as monetary policy, and sometimes in the opposite direction –  in those cases we might say it is (respectively) a bit easier or a bit harder than usual to deliver on inflation goals.  People have advanced various stories about these sorts of pressures to help explain both the rise in inflation in the advanced world in the 1960s and 70s, and the subsequent sharp decline.  Changed attitudes of monetary policy decision-makers contributed in both cases, but those attitudes weren’t the only factors.

Today I don’t want to try to illustrate that point over history, but rather to look at the pressure/shocks/pre-conditions that might have made it a little easier, or a little harder, for monetary policymakers in OECD countries over the period since just prior to the 2008/09 recession.

What about the pre-conditions?

Many advanced countries have been, or felt they were, constrained in doing more with monetary policy by the near-zero lower bound on nominal interest rates.  Thus, going into a period with lots of downward pressure on the inflation rate it helped, all else equal, to have high nominal interest rates. High nominal interest rates leave plenty of room to cut.  Going into the 2008/09 recession and aftermath, New Zealand had the third highest interest rates in the OECD –  only Iceland and Turkey had rates higher than New Zealand.  That wasn’t just a reflection of some last minute RBNZ madness in driving interest rates sky high.  Our interest rates have been above those in most of the rest of the OECD for a long time.

And going into the period of the recession and beyond, we had also had quite high inflation.  I’m not going to attempt to reconstruct the chart here, but work done at the Reserve Bank showed that among inflation targeting countries New Zealand was quite unusual in that our inflation outcomes had typically run above the midpoint of our (successive) target ranges.  Other countries had historically averaged nearer the midpoint.  Going into the recession, the Reserve Bank’s favoured measure of core inflation was actually above the 3 per cent top of the target range, and as this Reserve Bank chart I reproduced the other day illustrates, core measures had all typically been well above the target midpoint in the years leading up to 2008.
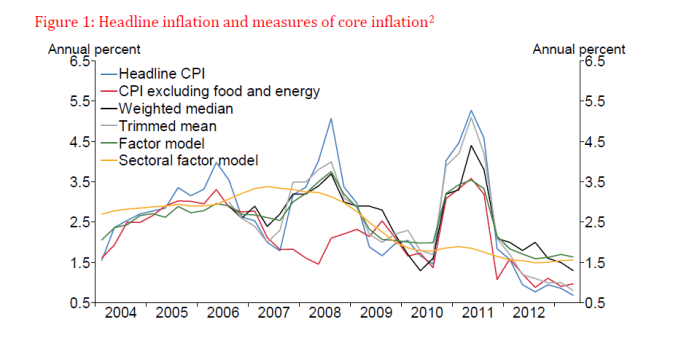
core inflation measures

So we had higher inflation to start with (and inflation expectations fairly consistent with that high inflation) and more room to cut policy rates should that be required.  Oh, and unlike half the OECD countries –  members of, or pegged to, the euro – we had a floating exchange rate.  Floating exchange rates increase a country’s ability to achieve its own inflation target whatever is going on elsewhere.

What about the fiscal pre-conditions?   If government finances are in such bad shape that there is little effective choice but to run severely contractionary fiscal policy, it can make it a little harder for monetary authorities if those authorities are trying to keep inflation up, especially if the near-zero lower bound is in view.

One way of looking at the fiscal situation is to look at the cyclically-adjusted balances prior to the recession.  Using the OECD’s measure, New Zealand’s average surplus over the years 2006 to 2008 was higher than those in almost every other OECD country.

fiscal surplus 06 ot 08Using data on the general government sector’s net debt, New Zealand’s position wasn’t quite as strong. But in 2007, we were one of the 12 countries where the government sector has less debt than financial assets, still one of the stronger positions among OECD countries.

So the pre-conditions looked pretty favourable for New Zealand to be able to keep inflation near target.  If anyone was going to be able to do so, in a strongly disinflationary environment, our high starting inflation, high starting interest rates, and strong fiscal position meant New Zealand was well-positioned to do so.

Pre-conditions are one thing.  But what about the shocks that each country faced?

Financial sector crises didn’t occur to same extent in all countries.  I’ve shown this table before, classifying advanced countries by the extent of the increase in non-performing loans since 2007. Real wealth losses –  whether borne by the government in bailouts, or by private creditors –  make it harder to keep inflation up, all else equal.   New Zealand is among the group of countries to the left of the table with the smallest increase in losses.

&Non-performing loans since 2007
NPLs
Source: World Bank.

It is never clear how to think about the impact of house price falls  –   how much of it is a real wealth loss, given that we go on living in the same house and consuming the same flow of housing services?  New Zealand did experience falling house prices during the recession, but as this chart I ran a few months ago illustrates, those aggregate losses have been fully recovered and, if anything, real house prices here have been a little stronger than those in the median OECD country.
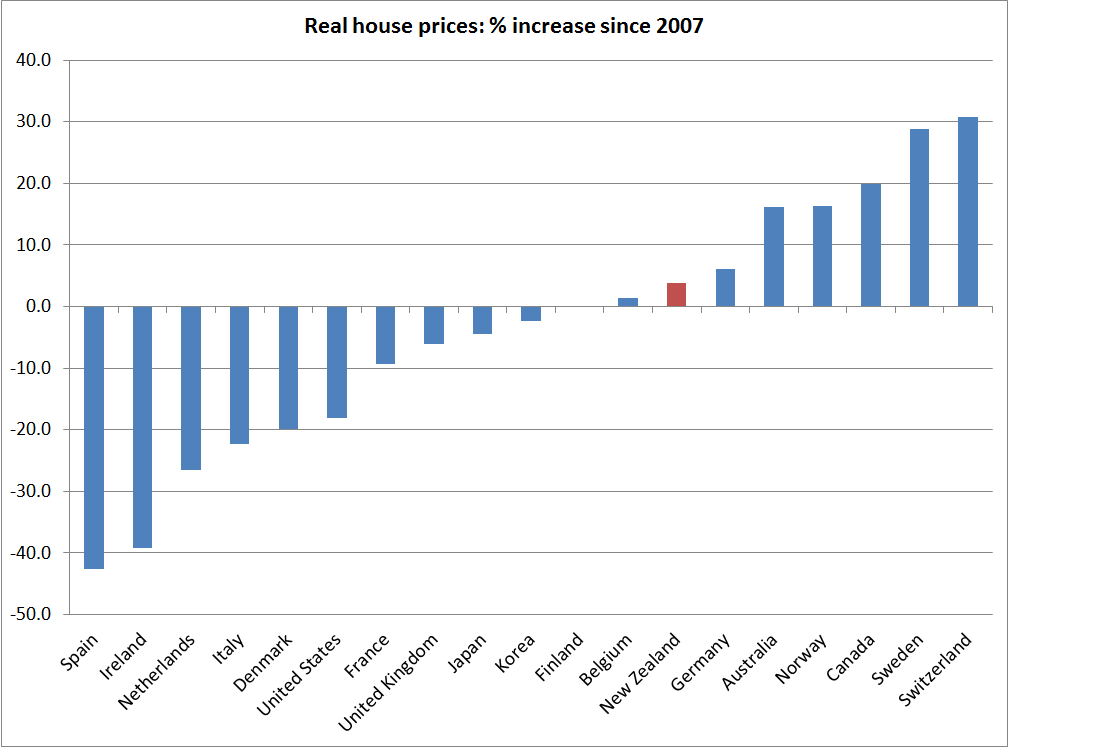
house prices since 2007

How about the terms of trade?  For a country like New Zealand, the terms of trade are largely exogenous.  A strong terms of trade boosts national incomes, supporting domestic demand (consumption and investment) whatever else is going on in the rest of the world. All else equal, if central banks are struggling to keep inflation up near target, they would prefer strong income gains, rather than the alternative, to support the efforts of monetary policy.

As this chart shows, New Zealand was among the handful of countries with the strongest terms of trade.  Even now the terms of trade are around 10 per cent higher than they were over the years prior to the recession.  That gave us an edge, all else equal, in keeping inflation up.
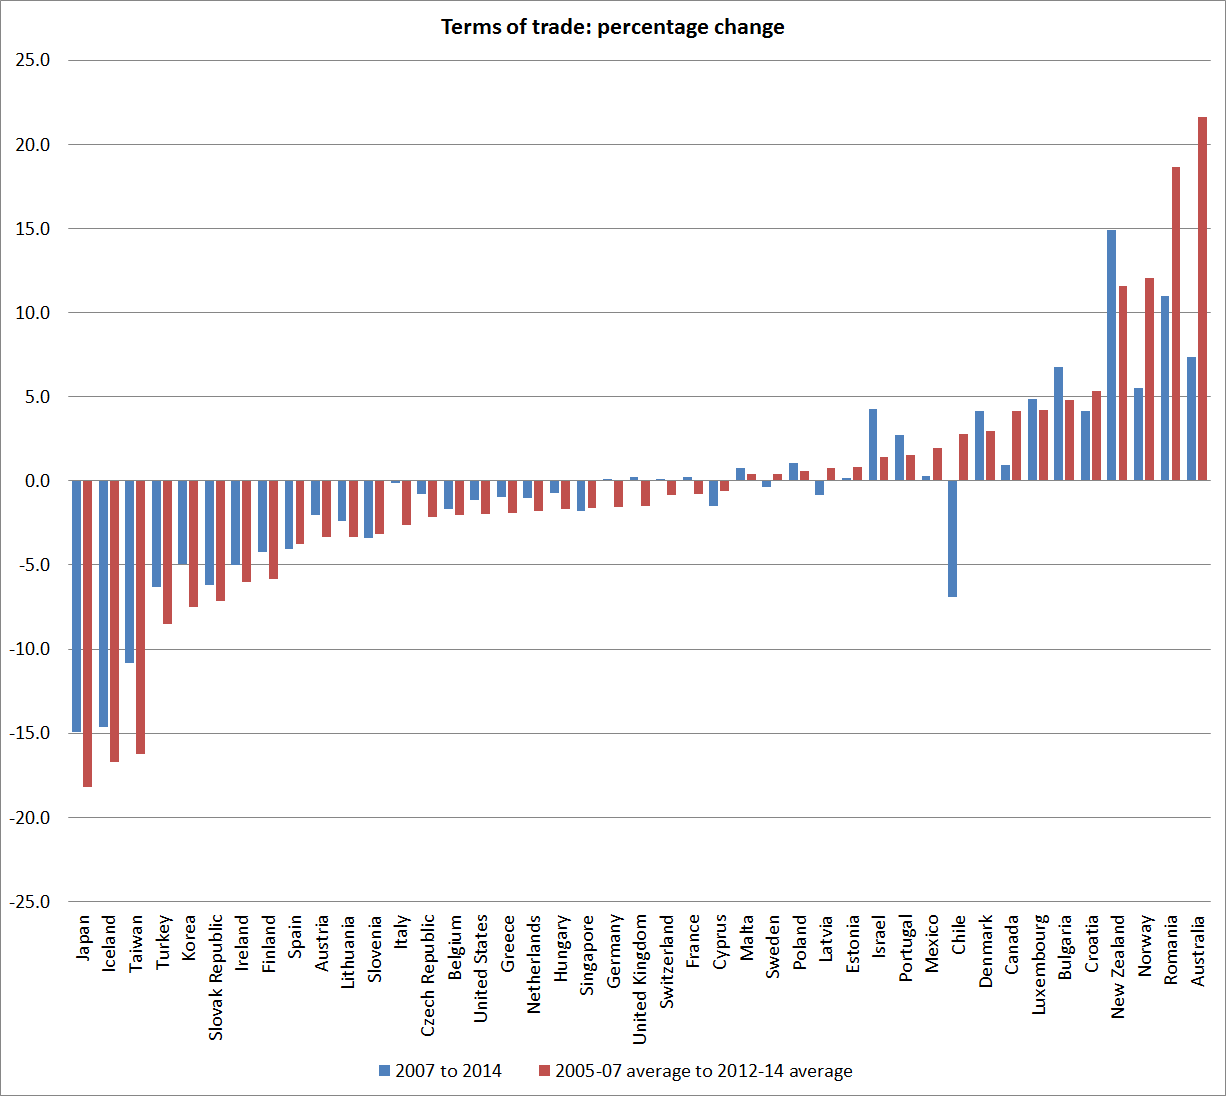
tot crosscountry

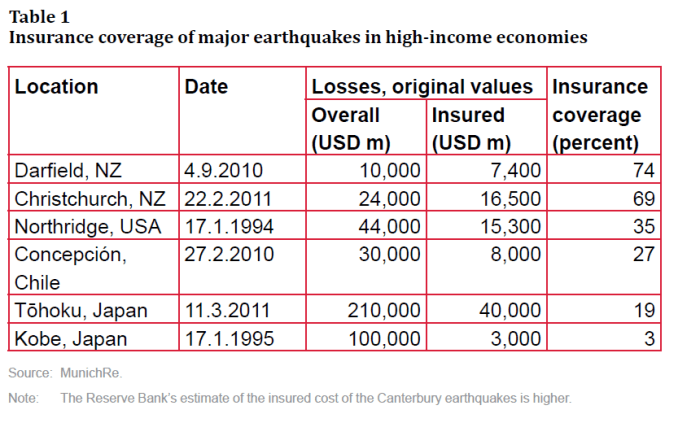
What about exogenous demand shocks?  It is often hard to think of examples of these, but the repair and rebuild process associated with the Canterbury earthquakes is one.  Other OECD countries have had to repair and rebuild after natural disasters – Chile and Japan both suffered from serious earthquakes.   But the damage in Japan, as a share of GDP, was much smaller than the damage in New Zealand and Chile (in both cases up towards 20 per cent of annual GDP).  And, as this table in recent Reserve Bank article highlighted again, what really marked New Zealand out was the extent of the insurance coverage of the losses –  most of that, in turn, covered by foreign reinsurers, rather than by domestic institutions.
insured losses

Earthquakes are awful, and often expensive, phenomena.   But the activity associated with the repair and rebuild processes can be a substantial near-term boost to demand and activity.  That is so even if all the losses are borne domestically – since people need a new house (or functioning water pipes) now, and might pay for it through higher savings over 40 years –  but it is much more obviously so when foreign reinsurers bear the bulk of the cost.  Activity needs to occur now, and someone external is paying for it.  That provides a lot of support for demand.  It could be quite troublesome if there was already a lot of inflation pressure, but –  much as one would wish the earthquakes never occurred –  it provides a lot of  potentially helpful support for demand (reinforcing monetary policy) when other inflation pressures are weak.

Looking through the list of OECD countries, I can’t see any countries that have had anything like that sort of large exogenous demand shock in the last decade or so.  Perhaps I’m missing some, and if so please feel to mention those case in the comments.

In general, declining population growth rates tend to be associated with relatively weak demand pressures.  That can be helpful when other demand and inflation pressures are strong, but more troublesome if other inflation pressures are weak –  as they have been, across the advanced world, in recent years.   But as it happens, New Zealand has had one of the faster population growth rates among OECD countries in the last decade or so, and in the last couple of years has had the fastest population growth we’ve experienced for 40 years.

Bringing it all together, thinking about things that have made it easier or harder for monetary policy to do its job and keep inflation up around target in recent years, relative to the situation in other advanced countries, we’ve had:

Favourable pre-conditions (things already in place in 2008):

  • high starting inflation (relative to target)
  • high starting interest rates
  • a floating exchange rate
  • low net public debt
  • a strong flow fiscal position

And favourable idiosyncratic shocks (or shocks avoided that others faced):

  • few direct financial crisis costs
  • no large sustained fall in house prices
  • a strong terms of trade
  • a large exogenous demand shock (earthquake repair process) largely externally-financed
  • continued strong population growth

None of this is to deny that the global environment  –  eg the declining productivity and population growth I highlighted yesterday, and global oversupply in various markets reflecting past excess investment associated with China –  might have made it more difficult, perhaps materially more difficult, generally for central banks to keep inflation up to around their respective targets.

But among advanced countries, it is difficult to think of any where it should have been easier to have kept inflation up near target than New Zealand.  Almost everything was going our way, and yet the Reserve Bank has consistently failed.

In any reasonable evaluation of the performance of an independent agency pursuing a target it does not control directly, one has to look at all the circumstances, not just at the bottom line, important as that bottom line often is.    One could easily envisage an alternative New Zealand in which many of the factors in the list above might have been reversed.  In such an environment, whatever else was going on in the rest of the world, one might not have been inclined to be very harsh in evaluating our own Governor had he persistently failed to keep inflation around the target.  But in the environment the Governor and his advisers have actually faced in the last few years, it is difficult to acquit the Reserve Bank of responsibility for failing to achieve its primary goal. It was easier for them than for almost all their overseas peers, and yet they’ve failed.  And no forecast I’ve seen suggests that situation is about to reverse rapidly.

The Reserve Bank published an article late last year on “Evaluating Monetary Policy”.  I discussed it here, and included a link to another earlier article they had published on a similar topic.  From the earlier article I highlighted a list of things the Reserve Bank’s Board (or the Minister) might want to take into account in evaluating the Governor’s performance, and perhaps considering any reappointment.

Some of the items the Reserve Bank’s Board might be expected to concern themselves with in fulfilling the monetary policy monitoring role include:

  • The processes the Governor uses to gather and interpret economic information.
  • The choices the Governor makes in allocating resources areas of the organisation relevant to monetary policy (including judgements he makes on whether to seek more, or fewer, resources, when the five-yearly funding agreement is negotiated)
  • The means the Governor uses to ensure that he is exposed to alternative perspectives.
  • The quality of the people the Governor appoints to advise him on policy choices.
  • The way in which the Governor applies section 3 and 4 of the PTA (dealing with deviations from the target range, and the avoidance of unnecessary instability).
  • The way in which the Governor thinks about and responds to the uncertainties around monetary policy.
  • The ability of the Governor to articulate the reasons for his policy choices, and his ability to convince others of his case.
  • The processes the Governor uses to assess past policy and learn from experience.
  • The stability through time in the Governor’s policy choices.

I’d now add to the list “the shocks and pre-conditions” the Governor faced over his or her term.  On this occasion, it doesn’t really seem to help his case.

Some Great Depression comparisons

Back in the early days of this blog, I illustrated how for advanced countries as a group cumulative growth in real GDP per capita in the period since the peak of the last cycle (2007) to 2014 had been no better than that in a comparable seven year period from 1929, during the Great Depression.

Here is an updated version of the chart I ran then for all the OECD countries

real pc gdp growth 07 to 14

The median growth rate –  o.22 per cent in total over seven years –  is so small as to be almost invisible on the chart.

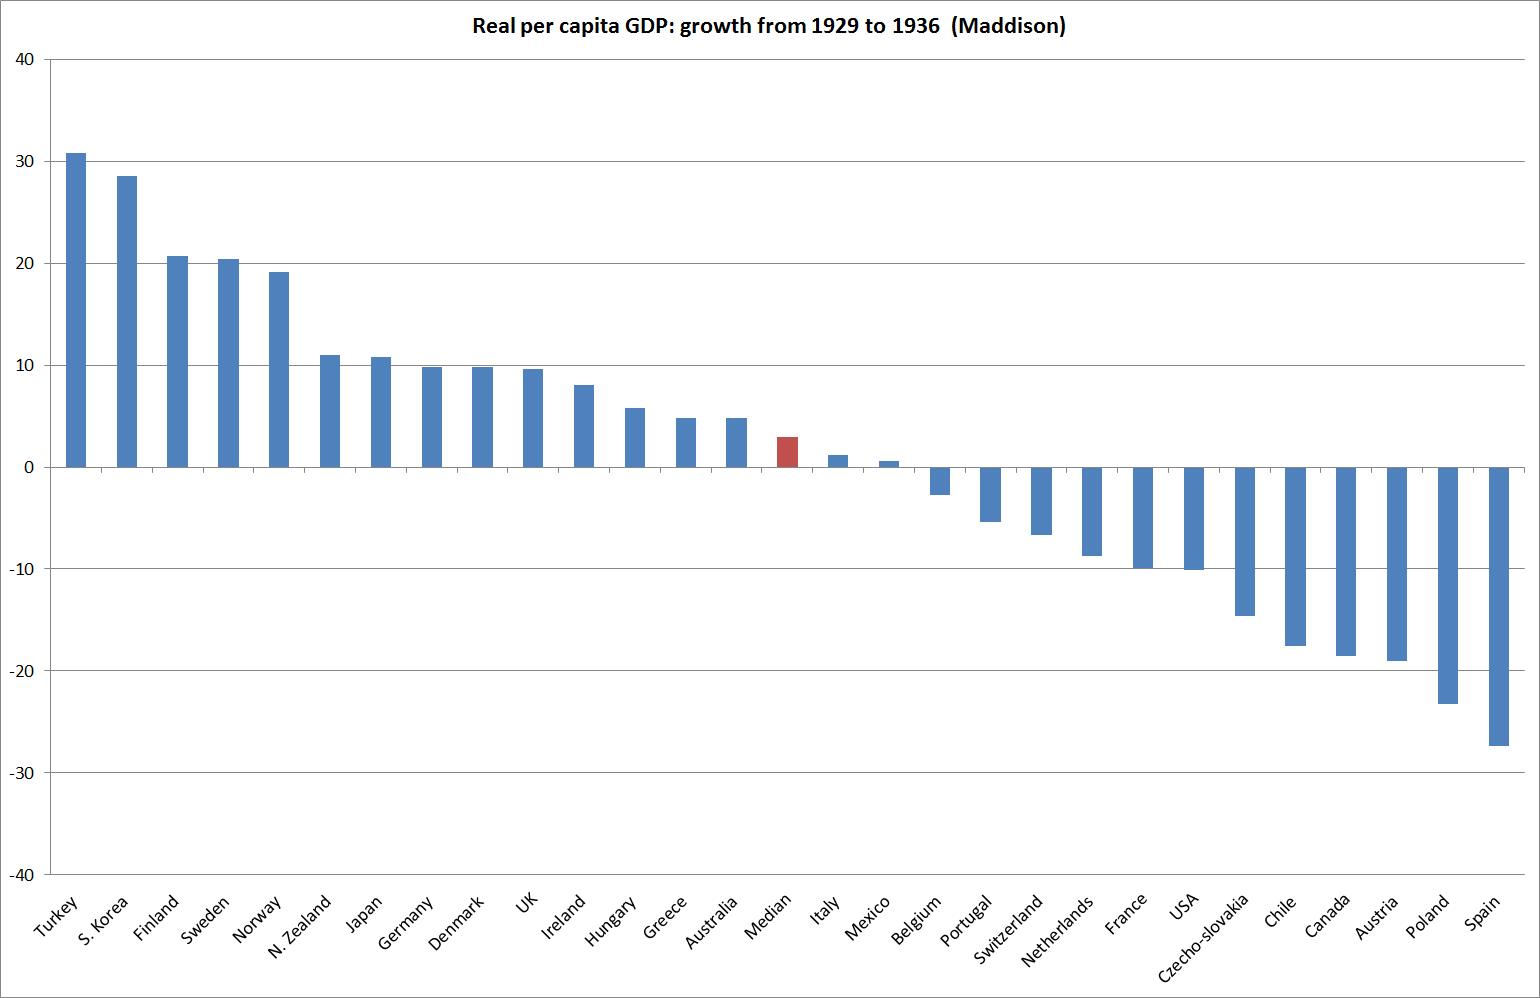
And here is the comparable chart, using the Maddison database of historical estimates, for the years 1929 to 1936

1929 to 1936b

I wouldn’t want to make much of the differences in the median growth rates –  given the imprecision of many of the historical estimates, and the likelihood of revisions to the more recent ones.  I was more struck by the lack of any material real GDP growth per capita in either period.

The Great Depression is seared in historical memory –  and whole generations of politicians came afterwards telling themselves and voters “never again”.  It is too soon to know whether the most recent period achieves the same permanent imprint on historical memories.  Perhaps in part it will depend what comes next.    But I’ll be a bit surprised if this episode has quite the same impact.  The Great Depression hit popular consciousness particularly hard because unemployment rates in so many countries rose very high, and stayed high for a long time, and in an age when government income support for those unemployed was typically less generous than it is today.

There aren’t (at least that I’m aware of) any consistent cross-country estimates of the unemployment rates in the 1930s.  But in most countries, the increases in the unemployment rates were very substantial (in the US, the unemployment rate is estimated to have peaked well above 20 per cent, and remained high for years).

By contrast, here is what has happened to advanced country unemployment rates in the last decade or so.

oecd U since 04

Whether one takes the median OECD country or, say, the total for the G7 countries, there was an increase in the unemployment rate of around 2.5 percentage points, which has been substantially reversed over the subsequent years. Unemployment rates are typically around where they were in 2006.  There are still awful cases –  Spain and Greece still have unemployment rates in excess of 20 per cent –  but the defining character of the last few years has not been very stubbornly high unemployment rates.

What really marks out the last decade  –  and contrasts it with the 1930s – is how poor the productivity growth has been. Without productivity growth, one can still end up with plenty of jobs, but they tend not to offer much in way of wage increases.

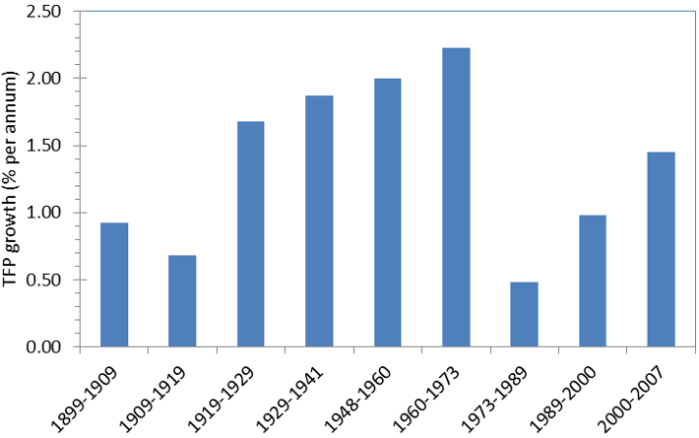
I’ve drawn attention previously to the work of US economic historian Alexander Field, who devoted a book to illustrating the very strong productivity gains (TFP) that the US had achieved in the 1930s.  A few weeks ago, I saw a nice summary of a new study by some other economic historians.   On the basis of their new work, they no longer see the 1930s as the period of fastest TFP growth in US history, but it was still very strong –  reflecting rapid technological and managerial innovations.  Here is the key chart.

Figure 1. TFP growth in the private domestic economy, US, 1899-2007 (% per year)

crafts us productivity

By contrast, here is a picture that uses John Fernald’s (FRBSF) business sector TFP estimates for the US over the last 25 years.

fernald.png

Business sector TFP growth is typically faster than for the entire economy, but for the last 10 years Fernald estimates average annual growth of  just over 1 per cent, dramatically slower than the 7 per cent average growth over the previous 10 years.

The slowdown in productivity growth isn’t unique to the US –  indeed on some measures, the US has done better than most –  and was becoming apparent in the data (again, not just this dataset), if not in the public consciousness, before the great recession of 2008/09 and its aftermath.

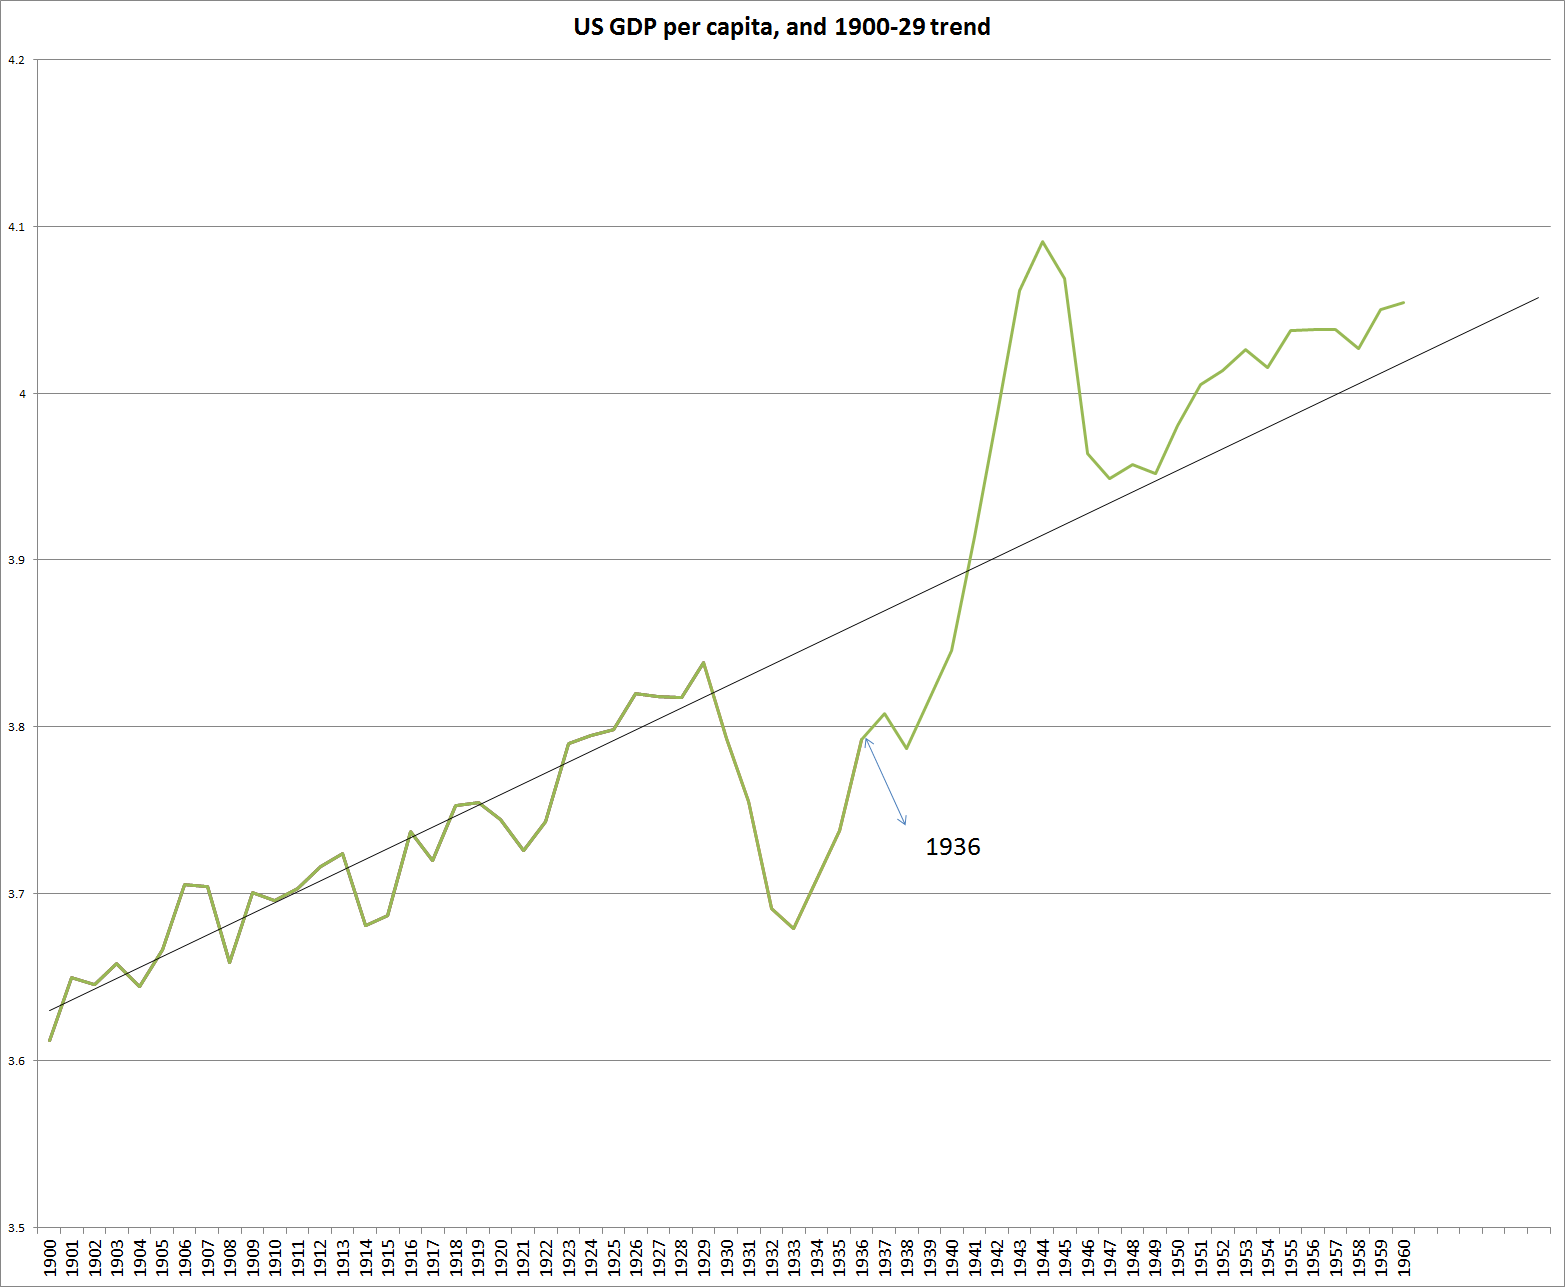
The contrast with the 1930s is striking.  That was, overwhelmingly, a failure of demand and of the global monetary system, and as those constraints were removed, the underlying lift in productivity supported a recovery in investment.  For the US, for example, post-war per capita GDP is on the same growth path as it had been pre-1929: output wasn’t permanently lower.
1936

What about the current situation?  Taken together, falling rates of population growth and falling rates of TFP growth materially reduce the volume of investment that is likely to be required, and profitable, at any given interest rate.  Add in apparently high desired savings rates around the world, and it is hardly surprising that real interest rates have fallen away so much.  Add declines in inflation expectations to the mix, and it has reinforced the decline in nominal interest rates.  The problems are mostly structural in nature, but they have been amplified by the reluctance of central banks to do what is required to keep inflation (or other nominal measures) up around target, in turn driven by a constant focus on a desire for “normalization” and a focus on some sense of where real interest rates “must” (in some sense) be in the very long term.  The reality, and perceptions, of the near-zero lower bound haven’t helped in many countries.

I’m pretty confident that in the longer-term real interest rates around the advanced world will be positive –  land is still fertile, as is the human imagination (so there will be a flow of new innovations and opportunities.  But there is no guarantee of such positive real interest rates in any particular decade (any more, in a New Zealand context, than there is a guarantee that our real interest rates will converge with those of “the world” in any particular decade).  It seems likely that some mix of lower global savings rate, higher birth rates, and structural reforms that create a better climate for productivity growth and investment are likely to be required to put the world economy on a better path –  one that, inter alia, might put us back on a path that supported more “normal” levels of nominal and real interest rates.  But those interest rates will be an outcome of a successful overall policy mix, not an intermediate target in their own right.  Monetary policy –  here and abroad –  in recent years has come too close to treating them as an intermediate target, rather than focusing on, and responding to, the data flow.


Perspectives from the Christchurch economy

As New Zealand readers won’t be able to avoid knowing from the blanket media coverage, today is the fifth anniversary of the most destructive of the thousands of earthquakes that have hit Christchurch and its neighbouring areas since September 2010.

Christchurch is “home” to me. I haven’t lived there for decades, and don’t suppose I will again. But almost all my wider family live there, and my ancestors for 150 years or more have lived in and around Christchurch.   Many of my family were, and are, badly affected by the 22 February quake: my elderly parents managed to get down the damaged stairs of their multi-storey apartment block, but never even got inside the building again.  The church where they had been raised, and married, and where several generations had been buried from, lay in ruins.

otbc

On Friday, presumably to mark the anniversary, the Reserve Bank released an issue of the Bulletin looking at how the economy of Christchurch and the Canterbury region has fared in the years since the worst of the quakes  (it is billed as “The Canterbury rebuild five years on”, but is mostly about economic activity in Canterbury, of which of course the rebuild is a significant, if temporary, new part).  The article builds on an earlier one along much the same lines published in September 2012.

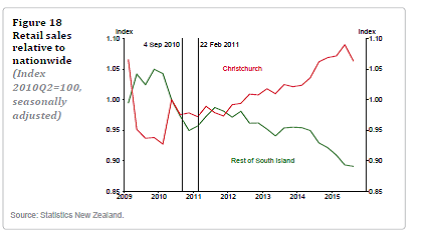
There is a range of interesting material in the article, as well as a few things that read oddly.  For example, the authors note on several occasions that “the bulk of commercial building reconstructions has yet to start”, which seems to defy the evidence of the senses (there has been a lot of building going on in and around the central city in the last year, public and private, and a lot of “for lease” signs on the new buildings), unless the Bank is much more optimistic than most people seem to be on just how large a CBD Christchurch is likely to have in the next decade or two.    And the authors include this chart, using SNZ data, suggesting that retail sales in Christchurch have been much stronger than in the rest of the country

chch retail sales

Which seems a little odd, since population growth has lagged behind that in the rest of the country.  Using the SNZ subnational population estimates, between June 2010 and June 2015 populations are estimated to have grown as follows:

New Zealand 5.60%
Canterbury regional council 3.30%
Christchurch city -2.30%
Christchurch city + Selwyn and Waimakariri 2.60%

Even allowing for the lower unemployment rate in Canterbury than in the rest of the country, it would seem surprising if retail sales per capita had grown so much more strongly than in the rest of the country (estimated retail sales 6 per cent faster –  see chart –  and population growth perhaps 2 to 3 percentage points slower.

But in commenting today, I didn’t want to focus on the fine details of a useful article.  Instead I wanted to comment briefly on three thoughts that struck me as I read.

First, in an article written by officials in a government agency, the authors are quite constrained in what they will have felt able to say about the rebuild process and the role of central government in it.  It is perhaps useful to read the Bank’s article alongside, say, the article in this week’s Listener.  And the Bank’s primary focus is, of course, on resource pressure issues, not the effectiveness or otherwise of the rebuild process.  But silence on some of these matters risks being read as endorsement.  I’ve noted already the comment about the commercial rebuild process, but if the authors are right that there is a lot more to come, perhaps it is worth pondering what role central government has played in  slowing down the process.  For example, the use of compulsory land acquisition powers, in pursuit of some official vision of what the city centre “should look like”, which will have contributed to much higher than necessary land prices in the central area.  Or the uncertainty which central government has created by promoting (almost certainly uneconomic) so-called anchor projects, and then making almost no progress on them –  leaving private investors considering projects that would sensibly locate close to the “anchor projects” in limbo.

Second, a couple of charts in the article prompt a “what might have been” thought about the entire economy.    Some have argued that the New Zealand economy would have performed much more poorly over recent years without the repair and rebuild process.  If anything, I think the opposite is true.  Right from the early days following the earthquakes, the Reserve Bank was focused on the size of the rebuild expenditure, and associated pressure on resources, that was to come over the following few years.  As probably the largest investment programme in New Zealand (share of GDP) since the Think Big projects in the early 1980s, and with a very domestic spending component to it, it was quite right for the Bank to focus on those issues and risks.  But, with the benefit of hindsight, I think that doing so helped leave the Bank more reluctant than it should have been to have cut the OCR as the record of persistently low inflation kept building up.  The sentiment was often along the lines of “it might be low right now, but it can’t last –  look at all those resources pressures to come in Christchurch in the next few years”.

If the economy had been fully employed, the repair and rebuild process would inevitably have had to “crowd out” some other economic activity –  most probably from the tradables sector.  In fact, we’ve had an underemployed economy throughout the last five years and could, with hindsight, have done with more demand, which would have generated more economy activity, less unemployment and a bit more wage and price inflation.  Without the spectre of the rebuild programme, there might have been more chance of it being allowed to happen.

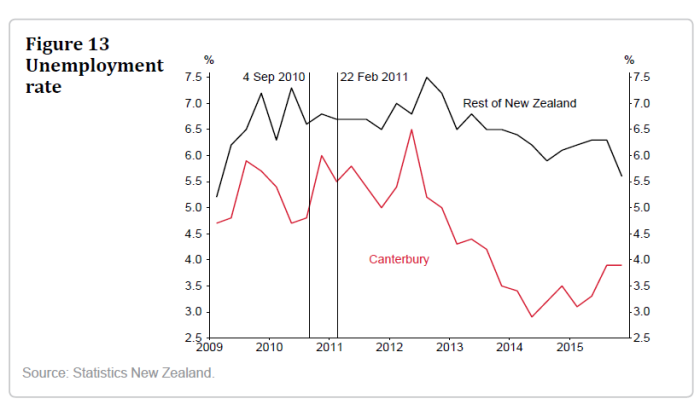
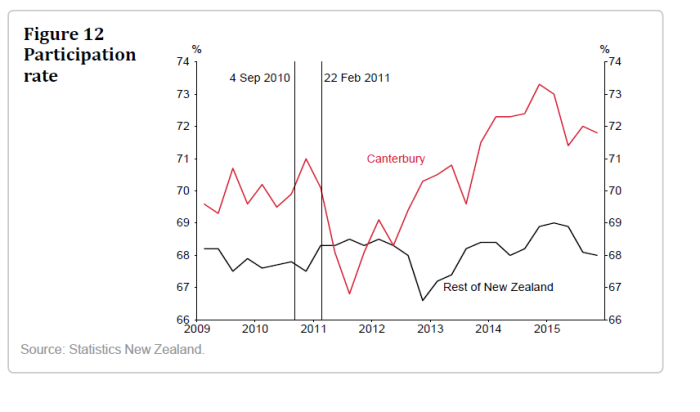
Part of what I’m talking about is captured in these two charts from the Bank’s article.

chch Uchch particThe labour market in Canterbury has been materially stronger than in the rest of New Zealand.  Even pre-quake, the participation rates were higher and the unemployment rates were lower (probably partly reflecting different demographics), but both gaps widened further in Canterbury’s favour as the demand/activity associated with the rebuild really got underway from 2013.
With a lower OCR over the last few years, and the associated lower exchange rate, the whole of New Zealand could have enjoyed a milder version of this sort of buoyant labour market.  The intense focused nature of the rebuild “shock” probably always meant that the Canterbury market, at peak, would be tighter than that in the rest of the country, but the rest of the country simply could have done materially better.  Demand makes a difference, and monetary policy can either hold back or stimulate demand.

Had the demand been there in the rest of the country to generate stronger labour market outcomes, there would have been inflation consequences. But that would have been a good thing, not a bad one.  Recall that inflation has been well below target for years.    And as the Bank notes

 In real terms, wages in Canterbury have increased by about 8 percent since the earthquakes, whereas wages outside of Canterbury have increased about 6 percent in real terms.

Hardly of a magnitude – 2 percentage points different in total over five years –  that, repeated nationwide, would have been sufficient to have blown the inflation rate back through the upper end of the target range.

One can’t simply mechanistically translate one region’s experience into that for a whole country,  but the simple comparisons outlined here point in the direction of what went wrong with monetary policy management in New Zealand in the last few years.  With a huge non-tradables demand shock (which, in macro terms, is what the rebuild represents) New Zealand should not have had any great difficulty keeping inflation up around target in recent years –  indeed, one could, if so inclined, have mounted an argument for it to have been a little higher for a few years, reflecting the intense one-off nature of the shock).

My final set of thoughts, rather more speculative, is around the longer-term health of the Christchurch economy.  The Bank repeatedly describes the Canterbury economy as being “resilient” (including in its press release) , but if anything I came away from the article more sobered and worried about the future of Christchurch than I had been.  In internal debates in the immediate wake of the earthquake, I was always one of those who pushed back against the idea that there would be a wholesale exodus from Christchurch, from which the city would never recover etc.  Apart from any other arguments, between risks of tsunamis, volcanoes, earthquakes, and floods where in New Zealand was really much safer in the longer-term?   And there hasn’t been such an exodus –  indeed, the population of greater Christchurch is higher it was in 2010.

But there always was Professor Ilan Noy’s work suggesting permanent adverse effects (population and economic activity) from past overseas natural disasters.  Noy is now at Victoria University and is listed as a co-author of the Reserve Bank’s article.

The Christchurch economy has historically drawn strength from a number of areas.  There was a large manufacturing sector, with a significant high-tech and export orientation.  That sector hasn’t been materially affected by the earthquake and subsequent rebuild process – but then the overall manufacturing sector (especially outside the construction-related bits) has been performing poorly (per capita manufacturing value-added is now only around 80 per cent of what it was in the early 2000s).   Christchurch has also built on the large rural hinterland –  which is still there, and probably more intensive than ever as vineyards (to the north) and dairy displace sheep.

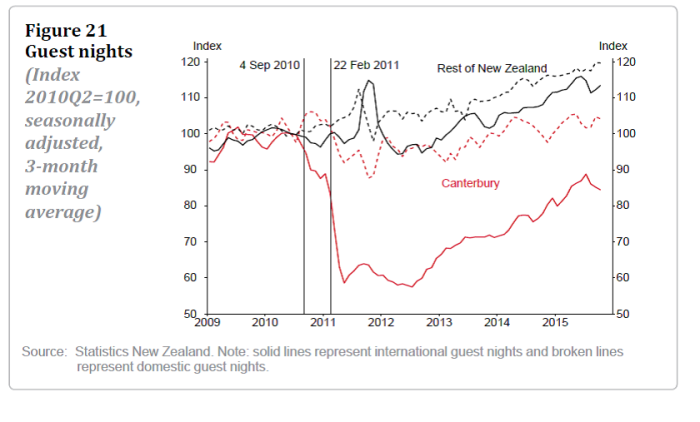
But Christchurch has also become a reasonably significant location for export education (one of the worst sets of fatalities was a English language school for foreign students) and some combination of tourist destination and gateway to the picturesque South Island. I’ve never been entirely confident that tourism is a robust basis for long-term high advanced country living standards (it isn’t tourism –  much more of it than New Zealand has – that makes France or the UK prosperous), but some of the charts in the article were sobering.

Guest nights

guest nightsInternational numbers are recovering, but there is a very long way to go.  Perhaps not too surprisingly (cause and effect) hotel capacity in Canterbury is only about 60 per cent of what it was.

Or international student numbers, where there has been no recovery at all (although I gather the picture for graduate students is a little more encouraging).

chch studentsThe chart for foreign fee-paying school students is even weaker.
The Bank ends its article noting

 In particular, activity in the tourism and education sectors remains markedly below pre-quake levels. Without increased activity in other sectors, the labour market in the region could see a reversal of the improvement that has occurred in recent years, leading to reduced participation, higher unemployment and outward migration.

No doubt activity in some of those tradable services sectors will recover further at some point, but how far and how quickly?  In some way’s Christchurch’s tradables sector plight probably isn’t a million miles out of line with the experience of much of the rest of provincial New Zealand, which has struggled to cope with the effects of a persistently high exchange rate, out of line with the longer-term real economic fundamentals.  In aggregate, economic activity in Christchurch has been held up by the repair and rebuild spending, but that won’t last for ever, and is no longer an impetus for growth (the volume of activity having now levelled off).  “Buoyant” might have been a better description than “resilient”.

Like many places in New Zealand, Christchurch is a nice place to live, but as the rebuild phase passes, there must be doubts about the ability of economic activity in the area to support high incomes for a growing population.  It is a concrete illustration of the more general need for a reorientation of policy in directions that would generate a lower real exchange rate –  a stronger competitive foundation –  for at least a decade, to help unwind the adverse effects of the last decade: successive non-tradables shocks, exacerbated by policy mistakes, resulting in an exchange rate too high, it appears, to support, much growth in the tradables sector.

As I noted, the Reserve Bank authors will have been constrained in what they could say.  The same constraints don’t apply to Professor Noy. Perhaps a journalist could consider approaching him, and inviting him to elaborate on his thoughts on the Canterbury economy and the apparent fragility of its rebuild-fuelled activity?

Justice Scalia on charging for OIA requests

The late Justice Antonin Scalia was something of a hero to thoughtful Christian conservatives, and no doubt to others who thought that the US Constitution should be read as it was written, not as a contemporary committee of ex-lawyers wished it had been written.

Over the last few days since Scalia’s death I’ve been reading various obituaries and appreciations, and taking the opportunity to read various articles and opinions he had written, mostly from before his time on the Supreme Court.    In doing so, I stumbled on all sorts of things –  including commentary on a 19th century case in which the US Supreme Court was called upon to determine the validity of a curious law which (in the great era of trans-Atlantic migration) forbade the offer of employment in the United States to someone still resident abroad.  Taking what Scalia considered was creative license with the Constitution, the Court struck down that law, allowing a New York church to recruit a vicar from the United Kingdom.

In clicking on various links I stumbled on this 1982 article in Regulation magazine, a journal that Scalia then edited.  The article ran under the heading “The Freedom of Information Act Has No Clothes”.  Much of his critical commentary is specific to the details of the American Freedom of Information Act, and particularly a bunch of extension enacted in 1974 when the presidency was at its weakest, just after the resignation of Richard Nixon.

Having been pushing the cause of easy access to official information  – the principle enshrined in our Official Information Act –  and lamenting the Reserve Bank move to charge for access to information, I was slightly disconcerted to find Scalia all in favour of charging for Freedom of Information Act requests.  The 1974 amendments had significantly liberalized the charging provisions

The question, of course, is whether this public expense is worth it, bearing in mind that the FOIA requester is not required to have any particular “need to know.” The inquiry that creates this expense-perhaps for hundreds of thousands of documents-may be motivated by no more than idle curiosity. The “free lunch” aspect of the FOIA is significant not only because it takes money from the Treasury that could be better spent elsewhere, but also because it brings into the system requests that are not really important enough to be there, crowding the genuinely desirable ones to the end of the line. In the absence of any “need to know” requirement, price is the only device available for rationing these governmental service

He raises a number of other concerns with the priority the statute gives to freedom of information cases (including the requirement to respond with a specified time –  10 working days in the US at the time), noting that

The foregoing defects (and others could be added) might not be defects in the best of all possible worlds. They are foolish extravagances only because we do not have an unlimited amount of federal money to spend, an unlimited number of agency employees to assign, an unlimited number of judges to hear and decide cases. We must, alas, set some priorities-and unless the world is mad the usual Freedom of Information Act request should not be high on the list.

Of the FOIA he writes

It is the Taj Mahal of the Doctrine of Unanticipated Consequences, the Sistine Chapel of Cost-Benefit Analysis Ignored

And he concludes

The defects of the Freedom of Information Act cannot be cured as long as we are dominated by the obsession that gave them birth that the first line of defense against an arbitrary executive is do-it-yourself oversight by the public and its surrogate, the press. On that assumption, the FOIA’s excesses are not defects at all, but merely the necessary price for our freedoms. It is a romantic notion, but the facts simply do not bear it out. The major exposes of recent times, from CIA mail openings to Watergate to the FBI COINTELPRO operations, owe virtually nothing to the FOIA but are primarily the product of the institutionalized checks and balances within our system of representative democracy. This is not to say that public access to government information has no useful role-only that it is not the ultimate guarantee of responsible government, justifying the sweeping aside of all other public and private interests at the mere invocation of the magical words “freedom of information.”

I wasn’t ultimately persuaded.  But it is always worth reflecting on arguments one disagrees with, perhaps especially when they are made by someone whose arguments one usually finds persuasive.  Perhaps it is partly a matter of the passage of time: society seems to put a greater weight on open government now than was perhaps the case 35 years ago.   Perhaps it is partly that, in the New Zealand context at least, there is little evidence of an overweening burden being placed on the public purse by Official Information Act requests.  And perhaps too our “institutionalized checks and balances” are weaker than those in the United States –  no powerful, and well-resourced, congressional committees, for example.   The economic argument, which Scalia alludes to, that products that are unpriced will attract a very high level of demand, rings less true when, say, an organization as large and powerful as the Reserve Bank attracts perhaps 70 requests, of all types and across all issues, in a busy year.

Another Scalia piece I enjoyed, from a few years later by when he was a judge on the US Court of Appeals, was headed On the Merits of the Frying Pan, presented as part of a Cato Institute conference on Economic Liberties and the Judiciary.

Scalia discusses the question of whether substantive economic freedoms (as distinct from protection of procedural due process) should be built into the Constitution.    He warns both (a) be careful what you wish for, and (b) more generally, reminds his readers and listeners that constitutions should really reflect matters on which there is already a deep social consensus.  There wasn’t one –  and probably isn’t –  for economic freedom, in the US or here.

First, be careful what you wish for

Many believe- and among those many are some of the same people who urge an expansion of economic due process rights-that our system already suffers from relatively recent constitutionalizing, and thus judicializing, of social judgments that ought better be left to the democratic process. The courts, they feel, have come to be regarded as an alternate legislature, whose charge differs from that of the ordinary legislature in the respect that while the latter may enact into law good ideas, the former may enact into law only unquestionably good ideas, which, since they are so unquestionably good, must be part of the Constitution. I would not adopt such an extravagant description of the problem. But I do believe that every era raises its own peculiar threat to constitutional democracy, and that the attitude of mind thus caricatured represents the distinctive threat of our times. And I therefore believe that whatever reinforces rather than challenges that attitude is to that extent undesirable. It seems to me that the reversal of a half-century of judicial restraint in the economic realm comes within that category. In the long run, and perhaps even in the short run, the reinforcement of mistaken and unconstitutional perceptions of the role of the courts in our system far outweighs whatever evils may have accrued from undue judicial abstention in the economic field.

And then on constitutions

The most important, enduring, and stable portions of the Constitution represent such a deep social consensus that one suspects that if they were entirely eliminated, very little would change. And the converse is also true. A guarantee may appear in the words of the Constitution, but when the society ceases to possess an abiding belief in it, it has no living effect.

I do not suggest that constitutionalization has no effect in helping the society to preserve allegiance to its fundamental principles. That is the whole purpose of a constitution. But the allegiance comes first and the preservation afterwards.

Unless I have been on the bench so long that I no longer have any feel for popular sentiment, I do not detect the sort of national commitment to most of the economic liberties generally discussed that would enable even an activist court to constitutionalize them. That lack of sentiment may be regrettable, but to seek to develop it by enshrining the unaccepted principles in the Constitution is to place the cart before the horse.

If you are interested in economic liberties, then, the first step is to recall the society to that belief in their importance which (I have no doubt) the founders of the republic shared. That may be no simple task, because the roots of the problem extend as deeply into modern theology as into modern social thought. I remember a conversation with Irving Kristol some years ago, in which he expressed gratitude that his half of the Judeo-Christian heritage had never thought it a sin to be rich. In fact my half never thought it so either. Voluntary poverty, like voluntary celibacy, was a counsel of perfection–but it was not thought that either wealth or marriage was inherently evil, or a condition that the just society should seek to stamp out. But that subtle distinction has assuredly been forgotten, and we live in an age in which many Christians are predisposed to believe that John D. Rockef eller, for all his piety (he founded the University of Chicago as a Baptist institution), is likely to be damned and Che Guevara, for all his nonbelief, is likely to be among the elect. This suggests that the task of creating what I might call a constitutional ethos of economic liberty is no easy one. But it is the first task.

As even those with an alterative judicial approach have noted this week, Scalia brought a combination of energy and intellect to his work that constantly improved even the judicial reasoning advanced for decisions with which, as a matter of legal interpretation, he profoundly disagreed.

Meeting the inflation target in one OECD country

There is a small OECD country whose export commodity prices surged prior to the 2008/09 recession, and again in the years after that recession.  It has grappled with high and rapidly rising house prices –  some of highest ratios in the world – and high and rising levels of household debt.  It wasn’t New Zealand I had in mind, but Norway.

There has been a lot of talk from those opposing further OCR cuts of how countries everywhere are struggling to get inflation up, as if meeting New Zealand’s inflation target was either (a) a lost cause, or (b) not something we should be bothered about anyway.

So I found Norway’s experience interesting.

The Norwegian government has set an inflation target for the central bank:

The operational target of monetary policy shall be annual consumer price inflation of close to 2.5 per cent over time

They have all the usual ‘outs’

In general, direct effects on consumer prices resulting from changes in interest rates, taxes, excise duties and extraordinary temporary disturbances shall not be taken into account.

So far, so conventional.  The precise words are a bit different, but the gist is no different from New Zealand’s Policy Targets Agreement –  ours focused on 2 per cent inflation, and theirs on 2.5 per cent.

And, much as the Reserve Bank used to, the Norges Bank recognizes that there is no one foolproof indicator of underlying inflation

There is no one indicator that provides a precise picture of underlying inflationary pressures in all situations. Different measures of underlying inflation are discussed in Monetary Policy Report.

In fact, they include on their website a nice summary table of four different measures

And here is how they’ve been doing.

Inflation indicators

CPI CPI-ATE CPIXE Trimmed mean 1) Weighted median 1)
Jan.16 3.0 3.0 2.6 ND ND
Dec.15 2.3 3.0 2.6 2.3 2.2
Nov.15 2.8 3.1 2.8 2.5 2.4
Oct.15 2.5 3.0 2.8 2.4 2.3
Sep.15 2.1 3.1 2.9 2.4 2.3
Aug.15 2.0 2.9 2.7 2.3 2.4
Jul.15 1.8 2.6 2.5 2.1 2.4
Jun.15 2.6 3.2 3.1 2.3 2.4
May.15 2.1 2.4 2.4 2.1 2.3
Apr.15 2.0 2.1 2.1 2.1 2.5
Mar.15 2.0 2.3 2.3 1.9 2.4
Feb.15 1.9 2.4 2.3 2.0 2.3
Jan.15 2.0 2.4 2.4 2.0 2.1

1) Owing to Statistics Norway’s changes to the statistical structure at a detailed level, estimates for January 2016 are temporarily unavailable.

ATE excludes tax changes and energy products

XE excludes tax changes and (estimated?) temporary changes in energy prices.

The target is 2.5 per cent inflation, and the average of the last observations of the four underlying measures is 2.5 per cent.

Inflation in Norway had been below target, but they cut official interest rates further  –  currently, the Key Policy Rate is 0.75 per cent, down from 1.5 per cent a couple of years ago.  The central bank reports that inflation expectations have been fairly stable, so that the whole of the cut in the nominal policy rate has also been a fall in the real policy rate.

As you might expect, economic conditions in Norway haven’t been great in the last year or so, since oil prices plummeted –  even though most of the direct effects of fluctuating oil revenues are sterilised in the Petroleum Fund.  The unemployment rate –  while still one of the lowest in the OECD at around 4.6 per cent –  has increased by around a full percentage point, and is as high as it has been at any time in the last fifteen years.

But, nonetheless, the inflation rate has increased and core measures suggest it is around the target midpoint.    That hasn’t been the New Zealand picture. What is the difference?

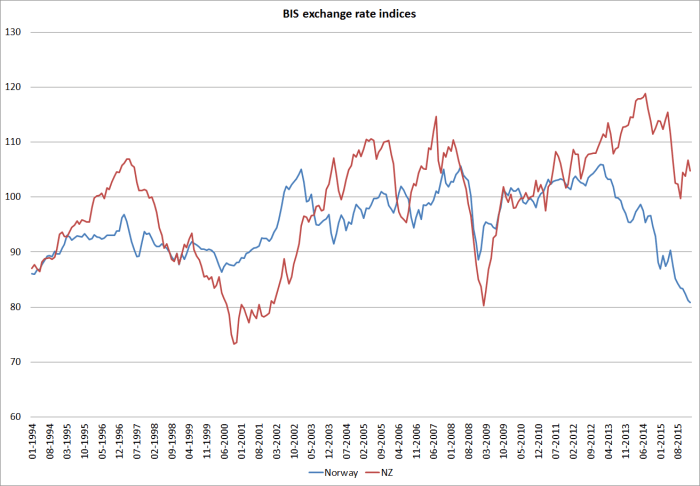
A key proximate part of the story is the behaviour of the respective exchange rates.  Here are the BIS broad exchange rate indices for the two countries.  Norway’s exchange rate is the lowest it has been for decades, while ours –  off the 2014 peaks for sure  –  hangs around the average level of the last decade or so.

bis exch rate norway and nz

People could fairly respond that oil and gas are far more important to Norway than, say, dairy is to New Zealand, and oil prices have fallen even more steeply than dairy prices.  All of which is true.  Then again, all fluctuations in dairy prices flow straight through to private domestic incomes –  unlike Norwegian oil revenues.

My point isn’t to draw exact parallels, but just to highlight a case of an advanced economy, with a severe adverse terms of trade shock, which has managed to keep inflation near the target –  they’ve been willing to do what was needed, and in parallel the exchange rate response has been large.

The direct effects of higher import prices have helped to boost Norway’s inflation rate.  That shows up in that the exclusion measures (ATE and XE) have been a little above target, while the central tendency measures (trimmed mean and median) are still a touch below.

Here is a chart from the Norges Bank’s (excellent) recent Monetary Policy Report.

norway inflation

The inflation rate for imported consumer goods has increased quite substantially, while that for domestically produced goods and services is  estimated to be holding comfortably around the 2.5 per cent target rate.  Outcomes like these are mutually reinforcing with the inflation expectations measures  – expectations consistent with the target make it easier to keep meeting the target, and outcomes around target help validate the prior expectations.

There might still be questions about what happens when the exchange rate stabilises and imported inflation drops, especially if the unemployment rate is then still high (by Norwegian standards).  Alert to the risks, the Norges Bank has flagged the possibility of further cuts in the Key Policy Rate.  But again, my point is not that the Norwegians have solved their problems for all time, but that they are now meeting their inflation target once again. Our central bank isn’t.

As a reminder, in Norway (relative to the position a couple of years ago) real interest rates have fallen. In New Zealand they have risen.  Ponder a counterfactual in which our real interest rates were 100 or 150 basis point lower than they are now –  and that is about the magnitude of the change in the gap between the two countries’ real interest rates over the last couple of years.  I think it is hard to dispute that we would have (a) a materially lower exchange rate, and hence higher tradables inflation, and (b) somewhat more domestic and net external demand and hence more upward pressure on non-tradables inflation.  There would be few doubts in anyone’s mind of the Governor’s commitment to delivering on the 2 per cent target he signed up to a few years ago.  Oh, and we’d have the good fortune to have an unemployment rate that would probably have a 4 in front of it, and probably be near the NAIRU.

Perhaps New Zealand doesn’t yet need real interest rates quite that much lower –  I’ve been arguing for some time for an OCR of around 1.5 to 1.75 per cent. The point really is just to illustrate what has been done in Norway – a small commodity-dependent country, with serious house price issues –  and what could have been, and perhaps could still be, achieved here.

Thoughts prompted by the expectations survey

The Reserve Bank’s quarterly survey of expectations results were released the other day.  As a reminder, it is a survey  of business people, sector leaders, and quite a few economists.  The vision has always been that the survey should capture some mix of informed people and people who might influence actual behavior – whether through their own business transactions, or through their commentary or advice to others.    There is a sample pool of about 100 potential respondents, and they typically seem to get about 65 or 70 replies each quarter.  Some criticize the survey for its small sample, but for what it is trying to do, in a small country, it has never seemed too bad to me.  It is, after all, asking for numerical answers to quite a bunch of macroeconomic questions.  I know that when I fill it in, I sometimes have to go back to the data to check what the latest reported numbers were –  not carrying QES wage inflation data in my head.

For inflation expectations specifically there are other surveys with larger samples.  ANZ provide their long-running Business Outlook survey, and their newer survey of household expectations, and the Reserve Bank will release its  latest survey of household expectations next week.  At the other extreme is the (inaccessible to the general public) AON survey, designed primarily to provide inputs for actuaries evaluating pension funds.  They ask about, inter alia, longer-term inflation expectations, but they ask only a handful (perhaps 7) economists.

I’ve never been quite sure what to make of inflation expectations measures.  Inflation expectations play  a significant, and quite plausible, role in conventional macroeconomic models.  The difficulties come with mapping the data we have available with the concepts in the models.  For a start, what horizon matters?  In principle, 10 or 20 year ahead expectations sounds interesting, abstracting from all the short-term noise, whether around taxes and government charges, petrol prices, or even swings in the exchange rate.  Then again, how many people sign up to 10 year nominal contracts?   No one sets wages or selling prices that far ahead.  And while plenty of bonds are issued with long maturities, when corporates issue them they typically seem to swap back to floating rates.  So 10 year ahead expectations probably provide some useful information about how confident people are that, say, the framework will hold or be delivered on, over 10 years, but I doubt they make very much difference at all to this year’s inflation rate, or the challenges a central bank faces in meeting its inflation target over the next couple of years.  I don’t know much about the politics of the next 20 years, but if forced to write down a number for average inflation over the next 20 years I might still write down 2 per cent.  But with huge error bounds….and grateful that nothing rests on it and that my pension is inflation indexed.

Shorter-term expectations matter more. But not too short.  Quarter or year-ahead expectations are influenced by specific stuff people know about –  relative price changes and administered taxes and charges.  In trying to make sense of inflation expectations, analysts are typically trying to look through those effects, to get a sense of the “norms” people have in mind when they set selling prices, negotiate wages, and make decisions to borrow or save.  If firms have in mind a benchmark inflation rate of, say, 1 per cent, then when they come to review their pricing schedules –  perhaps every six or twelve months –  pricing adjustments are likely to be different (lower) than if firms had in mind a benchmark or normal inflation rate of 2.5 per cent.  Same goes for wage negotiations.  And for how potential borrowers react to any particular nominal interest rate.   When those norms are above the inflation target, it can be hard to get actual inflation down to target –  more interest rate pressure is needed, than otherwise, to deliver the desired inflation rate.  And vice versa.  Two year ahead expectations have often been seen as a reasonable horizon to focus on for these purposes –  far enough that it gets beyond most (but not all) of the immediate noise, but close enough that it is more or less within the planning horizons of many.  In the latest RB survey, for example, the actual question asked in early February 2016 was about the annual inflation rate for the year to December 2017.  Halfway through that year respondents are asked to focus on is only 16 months away.   (Similarly, it was pleasing that when the ANZ launched a household expectations survey they asked about two year ahead expectations).

If, in principle, measures of two year ahead inflation might usually give one a steer on the “pricing norms” that firms and households are operating on (at least implicitly), there is still the matter of whether the answers to survey questions actually give us the information we really need.  As I’ve noted before, for example, the ANZBO survey and the Reserve Bank household survey measures have consistently, over decades, been materially above actual average inflation.    In the 20 years the RB household survey has been running, mean expectations have been just over 1 per cent higher than the average inflation outcome.  Does it mean households really didn’t believe the Reserve Bank would do it job?  Does it mean those are the inflation rates people implicitly contract on?  We simply don’t know (at least without a lot more formal research).  There is no incentive for people to invest any time or effort in responding to one question in a substantial telephone survey –  whereas they might well be when they ponder taking out a mortgage, or negotiating a pay increase.

All of which is a roundabout way of getting to the point that historically the Reserve Bank has put most weight on the two year ahead inflation expectations measure from the Survey of Expectations.  And it has done so because (a) there is now a good long time series (back to 1987), (b) it fits the prior that, typically, it will be horizons just beyond the immediate noise that matter, given that most contracts reprice at least every year or two, and (c)  because historically  it had a mean which seemed to align quite well over time with actual inflation.  One way to see this is to compare the two year ahead expectation with the Bank’s preferred sectoral factor model indicator of core inflation (remember what I said yesterday –  whatever the potential problems, for historical periods it is probably as reasonable as any measure, effectively smoothing through the noise in headline inflation).

infl expecs and core inflation

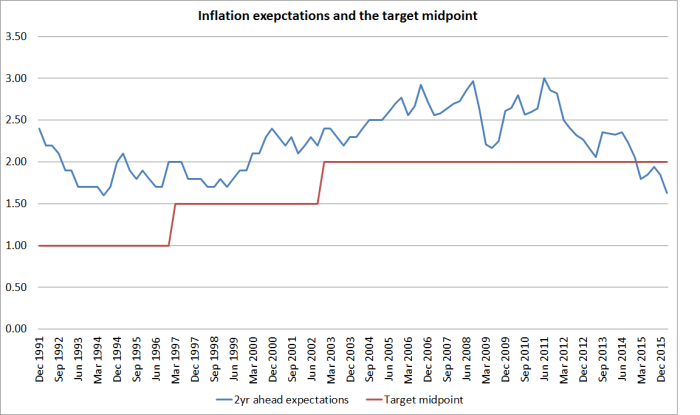
So what actually happened in the most recent survey?  Two year ahead expectations fell by 0.22 percentage points to 1.63 per cent [1].  Relative to the midpoint of the inflation target, that is the lowest in the history of the survey.  That isn’t all a bad thing –  despite the rhetoric suggesting we were crazed mechanistic inflation zealots, actually under both Don Brash and Alan Bollard inflation had averaged higher than the successive target midpoints, and expectations (in this survey) seemed more or less consistent with that.  But we don’t have a price level target, and if expectations start undershooting the target that is pretty undesirable as well.

infl expecs and target

The size of the fall in inflation expectations wasn’t unprecedented, but it was pretty large for this (not overly noisy) series.  In the period since low inflation became the norm (say since 1992) the only materially larger quarterly falls were (a) in the depths of the 2008/09 recession, and (b) in March 2012, when (post GST) the headline inflation rate had just fallen, in a single quarter, from 4.6 per cent to 1.8 per cent.

So this fall will have got the attention of the Reserve Bank, its analysts and forecasters.  It can’t really have been expected  – only 2 weeks ago the Governor told us explicitly that “survey measures of inflation…are now consistent with inflation settling at 2 per cent in the medium term”.  That was arguable, at best, previously.  It doesn’t really wash at 1.63 per cent –  and the prospect of further falls from here.

In the internal debate in the Bank, some will try to dismiss the latest fall as “just about petrol prices”.  Inflation expectations measures do respond, to some extent, to headline inflation, some seem “excessively” responsive to petrol prices, and even this two year measure (of informed respondents) is a bit sensitive to headline movements.  But, as I have pointed out on several occasions, the latest annual CPI inflation rate excluding petrol was only 0.5 per cent.  The more internationally conventional ex food and energy measure of inflation was only 0.9 per cent.  So if headline inflation is influencing two year ahead expectations (a) that seems quite reasonable –  it looks as though there is some information in trends in the headline rate, and (b) nobody much seems to expect headline inflation (including or excluding petrol) to pick up soon.  It looks as though respondents are just gradually giving up on the Reserve Bank’s story that inflation is heading back to 2 per cent any time soon.    It should be doubly sobering for the Bank that this comes in a survey in which responses to the other questions are not uniformly bleak: large falls in inflation expectations have usually gone hand in hand with more pessimistic GDP growth expectations, but in this survey those expectations have actually risen a little.

If people more generally –  not just these respondents –  are giving up on the Reserve Bank story, that will make it materially harder to get inflation back to target.

In one sense, it often seems wrong and excessively “mechanistic” to put too much weight on a single survey, and of 65 people –  it often did to me, when I sat around contemplating the survey results and wondering what OCR advice to offer successive Governors.  And in isolation that would be fine.  But it isn’t the only information we have –  rather, if anything, it is somewhat belated confirmation that the persistent undershoots of the inflation target have changed how people are thinking about prospects for inflation in New Zealand.   I suspect the Reserve Bank, perhaps rather grudgingly, will come to the same conclusion.

Recall what Mario Draghi, head of the ECB, said in the speech I discussed the other day

… in a context of prolonged low inflation, monetary policy cannot be relaxed about a succession of supply shocks. Adopting a wait-and-see attitude and extending the policy horizon brings with it risks: namely a lasting de-anchoring of expectations leading to persistently weaker inflation. And if that were to happen, we would need a much more accommodative monetary policy to reverse it. Seen from that perspective, the risks of acting too late outweigh the risks of acting too early.

And it is not as if New Zealand monetary policy has somehow already got ahead of the problem.  If the two year ahead measure is a reasonable proxy for the inflation norms now abroad in New Zealand –  and it may yet prove too high – real interest rates have actually risen over the last couple of years.

The Reserve Bank lists three lending rates on its main retail rates page: a business lending rate, an SME rate, and new customer floating mortgage rate.  In nominal terms, all are almost exactly now where they were at the start of 2014 (just before the OCR tightening cycle began). Inflation expectations, by contrast, are 70 points lower than they were then.  With an unemployment rate above any measure of NAIRU, and inflation persistently below target, rising real interest rates  have not obviously been something this economy needed. Retail deposit rates are lower than they were two years ago – by even they are no lower in real terms.  And as funding spreads are rising –  as they appear to have been recently, reflecting market unease about banks internationally  –  all else equal, the pressure on retail rates over the period ahead will be upwards not downwards.

And all this is before we focus on the continuing high exchange rate, the continuing weak commodity prices, and the growing stress persistently weak dairy returns are going to be placing on demand and activity (even if they aren’t necessarily a threat to the soundness of our banks).  Let alone the worsening global situation.

And, of course, there are market measures of implicit inflation expectations (from the difference between indexed and conventional bond yields).  These are weakening everywhere, but a chart someone sent me yesterday highlighted that the fall has been particularly sharp in New Zealand.  As of yesterday, a 10 year conventional bond had a yield of 3.06 per cent, and a 2025 inflation indexed bond was yielding 2.12 per cent.  That gap is now less than 1 per cent (and look how far it has fallen this year so far).

infl expecs indexed bonds

These aren’t perfect proxies, and bond investors’ expectations don’t directly affect (CPI goods and services) pricing now, but I don’t think central banks –  ours in particular –  can afford to be indifferent to message from bond markets: people with money on the line are no longer acting as if they think inflation is going to be near target on average over the next decade.  They might be wrong, but why would central banks be so confident that those investors are wrong –  especially when central banks, ours foremost among them, have themselves been persistently surprised by how weak inflation has been.  In part, in turn, that  has been because central banks –  ours among them –  have been persistently focused not on doing “whatever it takes” to create confidence that inflation targets will be delivered, but on doing as little as they can away with, perennially focused on “normalization” and some long-term benchmarks of where, surely, interest rates have to get back to one day.

There is a story abroad  – I saw it in a commentary from one of the local banks yesterday –  that low inflation is good and inevitable.  It certainly isn’t inevitable here –  looser monetary policy would, for example, lower our exchange rate generating additional resource pressure over time.  And it isn’t good either.  The story seems to go that structural features are driving price levels down.  But remember that productivity growth rates globally have been falling, not rising.  And stories about global overcapacity tell you mostly about demand having failed to keep up with supply capacity:  discretionary monetary policy exists to influence demand.  The indifference to what is going on is hauntingly reminiscent of some of the discussion and debate during the Great Depression –  when there was excess supply capacity (reflecting, eg, past heavy investment in agriculture), even amid rapid ongoing productivity gains –  and a sense in too many circles, for too long, that nothing very much should be done about monetary policy and the monetary system.

[1]  For what it is worth, when I completed the survey I did not lower my two year ahead expectation from the one I recorded in the November survey. On both occasions, I wrote down 1.4 per cent.


How many OIA requests do government departments receive?

The blogger No Right Turn, prompted by the Reserve Bank’s OIA charging policy, lodged requests with all government departments, and the Reserve Bank, about how many requests they had had in the last year, and how many they’d charged for.  His results are reported here –  unsurprisingly, charging is very unusual.

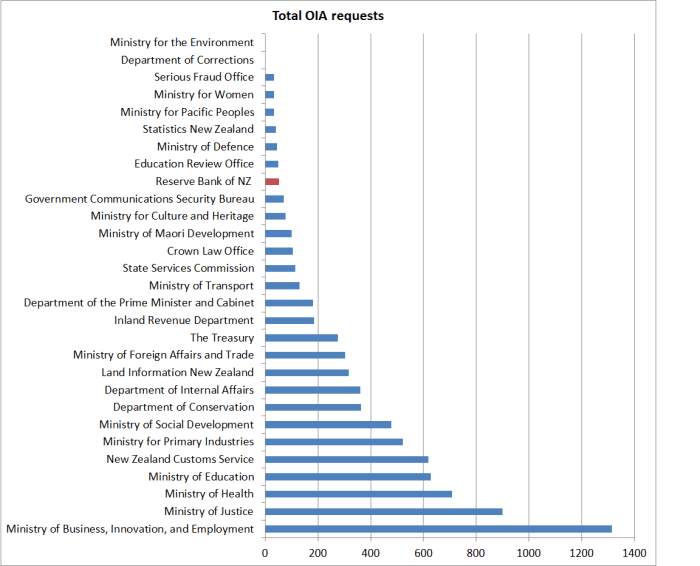
This chart takes his data on the total number of OIA requests each department received in the previous year (mostly the answers are for the financial year 2014/15). There don’t appear to have been responses yet from Environment and Corrections.

OIA requests

Every agency has different responsibilities, some are much larger than others (and one has to be a little wary of how things are classified, eg there is a note on the IRD response saying that their numbers include only requests handled at National Office (ones from media, MPs, and those of a sensitive nature)), but the Reserve Bank does not stand out among government departments as overburdened by requests.  The Ministry for Women, for example, or the Ministry for Pacific Peoples –  both with fewer requests – are tiny departments with little or no independent power or responsibilities.  The Treasury, it turns out, had five times as many requests as the Reserve Bank in this particular year.

By contrast to MfW or MfPP, the Reserve Bank independently sets monetary policy (with a huge short-term impact on the economy and the sectoral distribution of incomes), it regulates banks, non-bank deposit takers, and insurance companies (and now directly impinges on housing mortgage borrowers), it is a major payments system operator, it takes large financial risks in international markets, and it issues our notes and coins.  In some ways, against the backdrop of this data, it is a little surprising that such a powerful independent agency has not received more requests over the years.


Once telephones took forever….

Don Brash tells a good story of taking over as CEO of  the merchant bank Broadbank in the early 1970s and being told by the Post Office it would take several months to get some new phone system installed in the dealing room.  It wasn’t just merchant banks. Te Ara, the on-line encyclopaedia records that

business customers in particular wanted more sophisticated telephone services which were available internationally, and households were often frustrated by the time it took to get a telephone.

and

Delays in the installation of new telephones affected more than residential customers. In 1984 Treasury, at the forefront of the push for re-organisation of the Post Office, waited two months for existing telephone jacks to be shifted. Senior officials exchanged angry letters. Treasury argued that it was inefficiency, and the Post Office insisted it was pressure of work.

It is easy enough to get a telephone today.  It is a shame one can’t say the same about official information –  that reforming legislation having come a few years earlier than the telecoms ones.

As I noted the other day, last year I asked the Reserve Bank for any papers relating to work it had undertaken on reforming the Bank’s governance model (single decision-maker, role of the Board etc).  That request was lodged on 29 June.    On 24 August –  almost two months later, notwithstanding the “as soon as reasonably practicable” provision in the Act, the Bank declined my request almost in full (releasing one paper not that relevant to the issue).  They cited numerous reasons including the rather grandiose claim that to release such papers would damage “the substantial economic interests of New Zealand” .  I documented all of that here.

A few days later (27 August) I complained to the Ombudsman’s office.  They acknowledged receipt of the complaint and noted, as is typical, that it would probably take some time to get to it.

This afternoon, 17 February, a nice letter from the Ombudsman’s office was dropped into our letter box, informing me that they are just now getting underway with an investigation and that the Chief Ombudsman, Peter Boshier, will be investigating my complaint.  That is welcome.

It is a genuinely nice letter, quite apologetic about the “workload pressures” that “have led to delays in progressing this matter”.   I am not intending here to be critical of the Ombudsman’s office at all –  Parliament determines their resources, and they must do their best within those constraints.

But it is now almost eight months since the first request was lodged.  I presume it will take another month or two for the matter to be resolved.   Perhaps 10 months on from the initial request I might finally get an answer.

I think the specific issue is an important one, of some public interest, but it clearly isn’t that time-critical.  For plenty of other matters, time matters more.  But if this is a typical lag –  as I can only assume it is –  no wonder plenty of government agencies find it worthwhile to stall, and wait out the Ombudsman.

Telephone delays etc were quickly resolved once the industry was deregulated.  The same solution doesn’t look to be available here.    Perhaps not many problems can be solved simply by throwing more money at them –  and there may be scope for productivity improvements in the Office of the Ombudsman  –  but an effective well-functioning Ombudsman’s office, with prompt turnaround times, does have the feel of a currently underfunded public good.

Core inflation and the Reserve Bank

Since the Governor’s speech a couple of weeks ago (building on the January OCR review announcement), I’ve been reflecting again on how best to think about what is going on with inflation in New Zealand.

The Governor cited a single measure of core inflation, the sectoral factor model measure of core inflation, to assert his comfort with the current headline inflation rate.  As I noted at the time, it is very rare for any specific measure of core inflation to be cited in official Bank announcements.  The typical story has been along these lines

There is no agreed upon ‘best’ approach to measuring core inflation, and each approach has various advantages and limitations. Some work best in some circumstances; some in others.

That line is taken from the abstract to a nice Reserve Bank Bulletin article reviewing core inflation issues and measure, published a little earlier in the current Governor’s term).

The same year they published a nice Analytical Note on the sectoral core measure itself. The non-technical summary at the start of that paper notes

There are many ways to measure core inflation. Statistics New Zealand publishes a range of measures that involve removing volatile price movements before inflation is calculated, or excluding certain groups of items from the calculation. As well, the Reserve Bank of New Zealand has a set of models that produce core inflation estimates. Every model is different, and the Reserve Bank uses the full suite of measures when forming an assessment of what is going on with inflation.

(For the record, I edited both these publications, but both were widely circulated in draft, and were approved by the Assistant Governor  –  Chief Economist – and the Bank’s Communications Committee, on which all four governors sit and actively participate. I don’t recall such lines ever being contentious.)

The Analytical Note went as far as to publish this chart, illustrating the variety of measures the Bank looked at.

core inflation measures

Incidentally, note the nice longer-term time series for the weighted median and trimmed mean series.  The Bank no longer publishes these (linked) series on its website, just reporting the very short official series published by Statistics New Zealand.  This is something that should be remedied –  as, for example, the Reserve Bank of Australia does.

But now, apparently, the Governor favours the sectoral factor model to the exclusion of all other core inflation indicators.  It is certainly convenient that it is, at present, the highest of any of the range of core inflation measures, and that the inflation rate, on this measure, has increased over the last year.

Here is a table I ran a couple of weeks ago:

Annual inflation, year to Dec 2015
Trimmed mean 0.4
Weighted median 1.5
Factor model 1.3
Sectoral factor model 1.6
CPI ex petrol 0.5
CPI ex food and vehicle fuel 0.9
CPI ex food, household energy and vehicle fuel 0.9
CPI ex cigarettes and tobacco -0.3
Non-tradables ex govt charges and alcohol and tobacco 1.8

But neither the Governor, nor his officials, have given us any reasoning as to why they think that on this occasion this indicator is the single best representation of what is going on –  so much so that the other measures aren’t even worth mentioning.  I suppose one could lodge a request but (a) I doubt there would be anything to support the Governor’s preference, and (b) no doubt, we’d be told it was none of our business and that information had to remain secret to, for example, “prevent damaging the economy of New Zealand“.    For an institution that likes to hold itself out as being transparent about its economic reasoning and analysis –  and which has more (taxpayer-funded) macro analysts and researchers than any other agency –  it really isn’t good enough.

Relatedly, if the sectoral core model is really providing much the best steer, what has changed since the start of 2014?  Recall that sectoral core inflation then had been almost dead-flat at around 1.4 per cent for a couple of years –  and yet the Governor began an aggressive tightening cycle.  Perhaps it was a misleading measure then, but the best measure now?  It is possible, but surely we are owed an explanation?

sec core and headline

Why might we be a little sceptical that some “true” notion of core inflation is (a) rising, and (b) as high as 1.6 per cent  (itself still materially below the midpoint)?

First, the sectoral factor measure is the product of a model, and that model has error bands around it. Even the historical period numbers are midpoint estimates of a range which the Bank tells us is around 0.6 percentage points wide.

sec factor uncertaintyAnd, as with all of these sorts of models, the problems are particularly acute for the most recent observations. The model is, in effect, trying to discern the common trends in the various component price series, but it can do that increasingly reliably with the benefit of more time and more data. That makes tools like this most valuable for identifying the underlying inflation processes in periods of history (eg looking back now on the pre 2008 boom) and relatively less useful for “spot” reads on what is happening right now. In that sense, it is a little like filter-based estimates of the output gap, and it is similarly unwise to put too much weight on real-time estimates of any one model of the output gap.

Second, there is no sign of any pick-up in wage inflation, or in measure of inflation expectations.

Third, the measures that are easier to disentangle mostly aren’t suggesting core inflation is rising, or that it is as high as 1.6 per cent. Take, for example, the internationally quite commonly used approach: CPI inflation rate excluding food, household energy and vehicle fuels is only 0.9 per cent.   It isn’t always reliable – in 2007 it ran below most other measures of core inflation because of some large changes in government charges (childcare subsidies). But we know (SNZ tells us) this time round that taxes and government charges are not, overall, affecting the inflation rate. It is a good example of why one needs to look at all the measures, and use them to develop an overall story. Focusing on a single indicator is often likely to be quite dangerous – especially when it is something of a black-box, prone to endpoint problems.

And here is a concrete illustration of something that bothers me about the sectoral factor model results at present.

We know that the repeated increases in tobacco excise has been having a big impact of overall non-tradables inflation in recent years (and the overall CPI). More recently, cuts to ACC motor vehicle registration charges have worked the other way. Statistics New Zealand do not give us a series of overall CPI inflation excluding tobacco and government charges, but they do provide one for non-tradables inflation (at least from 2007). And the Reserve Bank helpfully publishes separately the non-tradables component of the sectoral factor model.  The chart shows overall non-tradables inflation as well. (The 2010 surge is the increase in GST, administratively excluded from the sectoral factor measures.)

sec core NT

Over the period since 2007, the combined effects of tobacco tax increases and central and local government charges have substantially boosted non-tradables inflation (the red line has been well above the blue line). So it is troubling that the non-tradables sectoral factor model component looks so like the overall non-tradables series over the period since 2009, even though it is substantially boosted by factors that no one would regard as core inflation – they are administered (by governments) prices.   I’m less bothered by the idea that sectoral core inflation in the non-tradables sector might have been flat – a lot of the inflation in recent years looks to have been in the construction sector (think Christchurch) and the model will tend to look past that as not representative of the whole economy.

But if the Bank is going to drive policy – its assessment of the current inflation situation relative to target – off a measure that has looked more like a series that includes lots of administered taxes and prices, than it does the series that excludes those effects, they need to give us a lot more explanation than they have done to date. It is possible that there is a good and convincing story, and that the sectoral factor model is really capturing something important that has been going on in non-tradables inflation that simply isn’t visible to the naked eye (or in other price series), but we need to see that story. and the other supporting evidence for it. What is it, for example, that is leading to the sectoral measure holding up, and even rising, just as the overall non-tradables inflation rate converges (downwards) on the series excluding those government-determined prices?

Personally, I think it would be safer for the Bank to work on provisional basis that core inflation is around 1 per cent at present. That is around where the exclusion measures would suggest, and well above the trimmed mean – the approach to core inflation approach that, for example, tends to get most coverage among analysts in Australia.

[UPDATE: And don’t lose sight of the fact that the average of the blue line –  excluding the GST spike –  has been below 2 per cent since 2009.  No one I know of would expect non-tradables inflation to be at or below 2 per cent if core or underlying inflation in total were anywhere near the 2 per cent target midpoint.]

This whole episode is pretty unsatisfactory, and a poor reflection on the Bank. Reasonable people might differ on the appropriate stance of monetary policy. But the attempt to justify the stance on a single (complex) core measure, without substantive elaboration or explanation, when that same core measure would appear to have warranted policy easings when the Bank began aggressively tightening two years ago, looks disconcertingly like a Governor fixing for a time on the highest convenient measure of inflation. That isn’t good policy or good governance. And I suspect it makes many of the Bank’s own economists quite uncomfortable.

As a reminder of the Deputy Governor’s 2013 report of the Bank’s aspirations

The Reserve Bank is deeply committed to transparency – of policy objectives, policy proposals, economic reasoning, and of our understanding of the economy, and of course of our policy actions and intent. Clear communication and strong public understanding make our policy actions more effective.

We are working to enhance the openness and effectiveness of our communications

It just isn’t happening.

And note that all these quotes are from 2013, early in the Governor’s term, before things started going really wrong. And before they responded to those mistakes  –  which any humans will at times make –  by turning inward, pretending that nothing is wrong, and avoiding serious scrutiny and debate.  Digging deeper holes doesn’t usually solve such problems.

It was wryly amusing to note the other day that the Governor of the People’s Bank of China – central bank of a brutal repressive state not know for any sort of transparency – had given an extensive interview (not necessarily revealing a great deal) to a publication not historically known as a party mouthpiece. Our Governor has, I’m told, not given a single substantive interview in his three and half years in the job.


Negative interest rates: some thoughts

I’ve been keeping an eye on the range of commentary and analysis appearing recently on negative policy interest rates –  options and limitations.  The issue has come back to prominence because of the BoJ’s recent modest move to introduce a negative policy rate, and amid the rising concerns about global growth and, perhaps, financial fragility that have been reflected in market prices –  equities, bonds, commodities, CDS spreads etc –  since the start of the year.

Doing something about removing, or markedly easing, the near-zero lower bound on nominal interest rates has been a cause of mine for some years.  While I was working for The Treasury in 2010 I wrote a discussion note, that got some circulation inside and outside the institution, concluding (somewhat to my own unease) that in some respects the world was less well placed than it had been in, say, 1930  – the early days of the Great Depression.   Back then, countries could get rid of the Gold Standard –  and eventually did so –  markedly easing monetary conditions in the process.  Having got nominal interest rates to around zero in much of the advanced world, there wasn’t a great deal else monetary policy could do if economies were to turn down again (or simply fail to recover).  Unsterilised fiscal policy (direct purchases of goods and services) might be an option on paper, but by then the tide had already turned against expansionary fiscal policy, and public debt levels in many countries were becoming worryingly (to the public, and conventional political wisdom) high.

The remaining option was to do something about the near-zero bound, which existed –  in a fiat money system –  only because of policy and legislative choices (typically, a state monopoly on currency issue, and a commitment to convert bank deposits into those state issued notes at a fixed one for one parity).   Why hold large proportions of one’s wealth at materially negative interest rates when –  once a few set up and holding costs were negotiated –  one could hold bank notes at a zero return?  (Some earlier thoughts on these issues are here and here)

No central bank had taken policy rates negative during the 2008/09 recession.  For some –  New Zealand was a good example –  there was simply no plausible need.  But in others –  the US and the UK appear to have been the prime examples –  it didn’t happen partly because the relevant authorities really weren’t sure about the implications would be.  Whole business models –  money market mutual funds, which had run into troubles in 2008 anyway –  had been built around the idea the interest rates don’t go negative.  And, at the time, it seemed to pretty much everyone that interest rates would be extremely low for only quite a short period, so why risk creating a mess, disrupting well-established business models, for a small short-period additional kick.

As we know, interest rates have now been very low for a very long time.  Some argue that wasn’t necessary, or wasn’t desirable, but whether one focused on an inflation target, on the level or growth of nominal GDP, or even economywide credit, it is difficult to conclude that interest rates in most countries should have been any higher in the last few years than they have been.  One could, in fact, mount a good argument that they (a) should have been lower, and (b) would have been lower if the technological/regulatory bound had not been there.   If, for example, inflation targets in the previous 20 years had been 4 per cent, not 2 per cent, I think there is little real doubt that real interest rates would have been lowered further.

In the last few months of Alan Bollard’s time as Governor of the Reserve Bank of New Zealand –  when yet another wave of the ongoing euro-area crisis was upon us –  I led an internal working group looking at some of our options if there were to be a new global crisis and a material downturn in New Zealand.  We concluded that in our relatively simple system there were few or no obstacles to taking the OCR negative should that be needed –  there was, for example, nothing like the money market mutual fund sector to trouble us.  We didn’t reach a firm view on how far the OCR could be cut before banks and other investors might turn to physical cash instead, but it seemed reasonable that we would have been able to cut to perhaps -50 or -75 basis points.  With a few suggestions to check that our technology could handle negative interest rates, we put the report aside as that wave of tensions eased.  Negative interest rates have not yet been needed in New Zealand.

What we didn’t do was to explore how to get around the floor that would inevitably be there at some point. I guess it wasn’t a high priority for the Reserve Bank of New Zealand –  with policy rates among the highest in the world, we were further from the floor (whatever it was) than most countries.  And –  always a comfort  – if our interest rates ever did get to zero (or negative) it seemed likely that the New Zealand exchange rate would be very weak.  We aren’t a surplus country, or any sort of serious “safe haven”, and if there are no yield advantages to holding NZD assets, in most circumstances there won’t be much foreign demand to hold them.

But as far one can tell, no one else in the senior levels of officialdom  anywhere else was doing very much about it either.  One can –  and should – bemoan the lack of contingency planning, but it probably just reflects the same mistake that has been made around the world since the crisis and downturn started to get underway in 2007.  There was a reluctance to recognise what was coming[1], a slowness to react even as the crisis was open us, and once the immediate worst of the crisis was over the constant relentless focus has been on “normalisation”.  And it wasn’t just central bankers…..market economists and participants were often just as focused on the tightenings that, it was confidently assumed, were to come.  It was the path that led various central banks into premature tightenings and then policy reversals  –  New Zealand leading the way, with two lots of reversals.  And it hasn’t just been about small central banks, or big ones –  pretty much everyone has shared in the delusion that it wouldn’t be long until we were well on the way back to “normal” –  real interest rates perhaps not much lower than they had been on average in, say, the decade prior to 2007.   The US Federal Reserve has often been as fallible as anyone, and it seems increasingly likely that its own “normalisation” programme might be brought to an end, and reversed, after just one tightening.

It all means that dealing with the zero lower bound doesn’t seem to have been treated very seriously by central banks and finance ministries.   We now have several advanced economies –  covering a large chunk of the advanced world’s economies –  with negative policy rates, but in each case it still comes with the question “how far can they go”, and in each case so far the move to negative rates has been less than whole-hearted. Central banks look and sound as though they are backed into it very reluctantly, rather than embracing enthusiastically what needs to be done.

Negative rates have been applied to only a portion of banks’ balances at the central banks –  structured, it seemed, to have as little impact as possible on banks and their customers.  There has been a logic to that –  the focus in many of these countries was on the exchange rate channel, and the announcement effects of moves to adopt negative rates appear typically to have been to weaken the respective exchange rates.  But it hasn’t exactly been a ringing endorsement of the efficacy of negative policy rates.  It all seems to have been accompanied by a fear of upsetting established business models, and a fear that before too long the limits of negative rates will be reached.

JP Morgan has an interesting note out last week looking at how far various central banks could take policy rates negative, without imposing more of a “tax” on banks than is being imposed in the most negative central bank now.  They suggested that some central banks could take a (tiered) negative rate as low as perhaps -4 per cent.

But monetary policy isn’t supposed to work by imposing taxes on banks, but by influencing private sector behaviour through a variety of channels.  Substitution effects matter.  And so do expectations channel.

But if central bankers don’t believe that they can do much more, or that their tools won’t really have much impact –  or perhaps, in their heart of hearts don’t really want to do much more ( after all, surely we need to keep “normalisation” in mind) –   it is hardly surprising that people more generally (not just market participants) become nervous when new risks come to the fore (China, Portugal, Italian banks, stresses on commodity producers or whatever)   When there is no ringing endorsement from central banks for banks to pass negative rates decisively through to firms and households (savers and borrowers) no wonder banks are tentative in doing so.  And that central bank tentativeness further undermines the potential effectiveness of the tools they might still have.  We see that with global inflation expectations falling, so much that central banks are struggling to avoid rising real interest rates.

I’m reading Scott Sumner’s The Midas Paradox at present, a stimulating take on the Great Depression.  As he notes, in that climate for a country to devalue, or go off gold, was stimulatory.  But when markets feared a country might go off gold, even if it had no desire to do so, that was severely contractionary (people –  and institutions – ran to gold, rather than paper money, with a cumulative contractionary effect). There wasn’t a belief that central banks could credibly do much to offset that sort of tightening in conditions.   There aren’t direct parallels to today’s situation, but if people think that the monetary options are almost exhausted it amplifies the adverse impact of any emerging bad economic news

It is all unnecessary.  If central banks five or more years ago had put their minds to dealing with the zero bound, we’d be far better positioned today.  Authorities could say with conviction that there was no limit to how far policy rates could be cut.  Banks –  and savers/borrowers –  would be that much more attuned to the possibility of materially negative rates (nominal, not just real).  As people like Miles Kimball have pointed out, it doesn’t take the abolition of all physical currency – which continues to have real convenience value for many people/transactions.   And that is why it still is not too late to act.  Central banks could cap the issuance of their currency, and work with ministries of finance to enable variable conversion rates.  These are unfamiliar concepts to the public –  and would take some socialisation.  But every day that is lost in beginning work on these sorts of initiatives exposes the world economy to really serious threats if the current set of risks crystallise (or another lot do a little further down the track).

In having delayed so long, when central governments and governments do finally move it risks looking like a panic measure.  It isn’t clear how to avoid that now –  but the best chances to avoid that sense is in those countries that still have some conventional monetary leeway (New Zealand and Australia among the few).

And, of course, the other option that could have been pursued was a higher inflation target.  I’ve written about this previously, as have others.  I still regard it as less desirable than the alternative  – doing something directly about the near-zero bound. That is particularly so in countries that have already pretty much reached the limits –  if the central bank has no effective instruments why would anyone give much weight to an increase in an announced inflation target.  Again, the options are different for New Zealand and Australia.

Central banks and governments have delayed far too long already, and they now risk reaping a very nasty harvest –  or, more accurately, seeing it imposed on their populations.  It was when central banks and governments finally moved off the Gold Standard –  usually just as reluctantly as today’s central bankers are too fully embrace negative rates and/or higher inflation targets –  that economies finally began to sustainably recover from the Great Depression.  Today’s threats are a little different in the details, but there is a pressing need for markets, the public and politicians to come to believe with some conviction that inflation will return, and that authorities have the instruments to raise inflation effectively and without question.  Persistent doubts on that score  –  including doubts of self-belief among the central bankers –  only increase the risks of a very nasty global deflationary period over the next few years.  Cutting policy rates barely as fast as inflation expectations are dropping away isn’t a recipe for boosting demand –  or creating any sort of robust confidence that inflation targets will be met.   Central bankers barely believe they will. Why would anyone else?

[1] I recall a serving G20 Governor telling me at a conference in early 2008 that he couldn’t understand what the Fed thought it was up to cutting interest rates.  A few months earlier, at another international meeting, a senior Fed staffer told us that while the market was beginning to look for cuts, the Fed still thought the next Fed funds move was upwards.