New Zealand interest rates: persistently higher than those abroad (Part One)

New Zealand’s interest rates have been higher than those in the rest of the advanced world for decades.  Making sense of why is one element –  I argue an important one –  in getting to the bottom of why New Zealand’s relative economic performance has been so poor, and in particular why we’ve made up no ground relative to most other advanced countries in the last 25 years or so.  Our productivity growth has been slower than that of most other advanced countries, and after a disastrous few decades we entered the 1990s already less well off than the typical advanced country.

If we had good comparable data for the earlier decades (say 1950s to 1970s), and market prices had been free to reflect underlying pressures, our interest rates would have been higher than those in the rest of the advanced world then too.  Instead, we made much greater use of direct controls (on imports, credit, foreign exchange flows) than most advanced countries did.  We don’t really get comparable interest data again until the mid 1980s.

When I say that our interest rates have been higher than those in other advanced countries, I really mean “real” interest rates.  Differences in inflation rates really complicate the picture at times in the past –  in the 1970s and 1980s for example, New Zealand had some of the highest inflation rates in the advanced world.   But over the last couple of decades, inflation rates have been much lower and much more stable, across time and across countries. I could spend a great deal of time constructing estimates of “real” interest rates, but none of them would be ideal (eg there are no consistent cross-country measures of inflation expectations) .   And so the charts I’m showing in this post, will use nominal interest rates.  Where relevant, I will mention changes in inflation targets, actual or implicit.

And when I say that our interest rates have been higher than those in other advanced countries, I don’t necessarily mean “in every single quarter, against every single country”, but on average over time (actually, in the overwhelming majority of quarters, against the overwhelming majority of countries).   New Zealand’s OCR actually got as low as the US federal funds rate target in 2000 (both were 6.5 per cent), but it didn’t last more than a few months.  Changes in inflation targets do make a bit of a difference: in the early 1990s for example, we were targeting 1 per cent inflation.  Australia didn’t have an explicit target at all for a while, and when they adopted one it was centred on 2.5 per cent.  So our nominal short-term rates were somewhat relative to theirs in the early 1990s.   Adjusting for (say) differences in inflation target, our policy rates have been higher than theirs throughout the last 20 years, with the exception of the peak of mining investment boom.

The point of this series of posts isn’t really to establish that our interest rates are, and have been, higher than those in other advanced countries.  No one seriously contests that.  But just to illustrate the point briefly, here are a couple of view ofs the long-term bond yield gap.

long-term-bond-yields-0ct-16

One line shows the gap between New Zealand and the median of the all the OECD countries for which there is data since 1990 (ie mostly excluding the eastern European countries), and the other is the gap between New Zealand and the median of Australia, Canada, Sweden and Norway, four not-large countries that control their own monetary policy.

The gap is larger than it was in the early 1990s –  when we had an unusually low inflation target –  and even if you take just the last 20 years (or even the last 10) there is no sign of the gap narrowing.  There are cyclical fluctuations, of course, but our long-term interest rates are well above those in other advanced countries (with mostly quite similar inflation targets).

And here is the same chart for short-term interest rates (again, OECD data).

short-term-int-rates-oct-16

Again, no sign of any convergence occurring.  Even the latest observations (on which almost no weight should be put –  rates fluctuate) aren’t much different from the averages for the last 20 years.

And since commenters sometimes highlight small countries, here is the short-term interest rate gap between New Zealand and the median of the seven smallest OECD countries that have their own monetary policy for the last 20 years (a period for which the OECD has data for all of them).

short-term-rates-small-oecd-oct-16

So our interest rates (a) are and have been higher than those abroad, (b) this is so for short and long term interest rates, (c) is true even if we look just at small countries, and (d) is true in nominal or real interest rate terms.  And the gap(s) shows no sign of closing.

But the really interesting question isn’t whether our interest rates are higher, but why.  That will be the focus of the next post.


Housing reform, the Corn Laws and possibilities for New Zealand

Brendon Harre, who writes interesting and thought-provoking pieces on housing (including contributing from time to time to the new Making New Zealand housing blog), had another stimulating article out this week, titled Housing affordability: Reform or Revolution .  Harre is strongly of the view that supply-side reform of the urban land market is critical to making home ownership affordable again, but is particularly interesting because he comes at the issues from a left wing perspective: the sheer injustice of the sorts of house price outcomes we (and so many other similar countries) have experienced in recent decades.  He fears that if reform doesn’t happen, extreme populist movements –  the modern “revolution”  – could.

In his latest article, Harre picks up on a point I’ve made several times previously.  I’ve argued that it is difficult to be optimistic about the supply-side reforms happening in New Zealand any time soon, partly because there are few or no known precedents of countries or regions/cities (and certainly not from among the Anglo countries) undoing restrictive land use regulations once they have been put in place.  He links to a post I did a few months ago suggesting that perhaps Tokyo might have been something of a counter-example, but essentially accepts the point that, thus far, there few modern examples of successful supply-side land use/housing reform.  In pondering why this might be, and how it might be changed, Harre suggests thinking about other cases from history in which policy reforms have finally overcome longstanding resistance, to free-up markets and bring prices down.

In a New Zealand context, he could have thought about the eventual removal of the sort of heavy import protection which for decades meant that New Zealand was a rare country where cars were not only very expensive, but often held their value over time.  Or of the removal of most agricultural industry support in the 1980s.

But on this occasion he looked at the movement that led, over decades, to the repeal of Corn Laws (which tended to hold up the price of wheat, benefiting landowners but at the cost of urban workers and industrialist) in the United Kingdom in 1846.    You can read the story for yourself, and I’m not an expert in the area (although the few books I pulled off my shelf suggested a different emphasis in a few areas), but the lessons Harre draws are

What are the lessons from the campaign for affordable food?

  • Achieving a strategic alignment of a broad cross-section of social groups is important
  • Acknowledging that moderate incremental reform can prevent future radical revolutions.
  • If traditional media does not report on your campaign create new media. The Economist newspaper was founded by the British businessman and banker James Wilson in 1843, to advance the repeal of the Corn Law.
  • Simple clear statements/images with a strong moral message are effective.

Harre ends on an optimistic note.

For New Zealand to become a fairer society, we should learn the lessons from earlier struggles for economic, social and political justice. If these lessons were applied to New Zealand’s housing crisis, in my opinion affordable housing could be easily solved.

I remain rather more skeptical.  As a technical matter, housing price scandals (here and abroad) are easily resolved.  But the challenges aren’t technical, they are political.

Harre draws hope from the recent Obama administration initiatives to encourage states, cities, counties etc to rethink their zoning rules

President Obama has chosen to address supply restrictions by releasing a Housing Development Toolkit, advising States and local jurisdictions on how to best manage urban planning to achieve affordable housing. Some US cities are very restrictive, so these reforms may cause a measurable downward price correction, but it is too early to tell. There are both supporters and detractors for the President’s approach, which if followed to its logical conclusion by going from advice to a command would remove some aspects of planning autonomy from local government control.

But…the US federal government has no responsibility for zoning and other local land use laws, the Obama administration is weeks from ending, and there seems little appetite in the places that matter in the US to make the sorts of land use liberalisations that many economists favour.  Of course, it is good to see the Administration (even an outgoing one) pick up the issue, but substantively it might matter not much more than, say in a New Zealand context, the ACT Party favouring such reform.  And housing affordability isn’t such an issue in the US, no doubt partly because if New York or San Francisco are “unaffordable” there are other big fast-growing cities people can move to without such regulatory burdens.

I’m not sure that reform is inevitable, even with a decades-long perspective.  After all, awful as the current system is, it could maintain an uneasy equilibrium in which more people involuntarily rent than used to, people buy homes much later in life than they used to with more debt, and then –  on average –  they reap a transfer back from their parents late in life.   I don’t favour such an outcome, but after several decades already of progressively more unaffordable home ownership for the relatively young, there is still no sign of this becoming some sort of moral crusade for justice, let alone efficiency.

Reverting to the Corn Law process briefly, my British economic history textbook records that

By 1846 the Anti-Corn Law League was the most powerful pressure group  England had known, and upon their techniques of mass meetings, travelling orators, hymns and catechisms a good deal of later Victorian  revivalist and temperance –  even trade union –  oratory was based.

Translated into the language and style of a different age, I don’t detect anything like that at present around land use regulation (outright homeless is a little different).

As Harre, and the economic historians note, the rising “ideology” of free trade played a part – though not necessarily a decisive part –  in getting the Corn Laws repealed.  There was an alignment between that belief system and the cause of “cheaper food for urban workers”.  But in New Zealand –  or Canada, or Australia, or the UK, or most of coastal USA –  is there any sign of that sort of ideological movement around housing, cities etc?  I don’t detect it.  There is no sign of the rhetoric of choice, freedom, flexibility etc assuming a dominant role –  among the public let alone among the elites.  The talk is still endlessly of smarter planning, and top down visions for what cities and other urban areas should be like –  our own Productivity Commission put its imprimatur recently on local authority desires to plan cities.  If there is ever talk of reform, it is of targeted specific interventions, not of getting planners out of the way, and allowing markets to work.  In my own suburb, there is currently a process underway –  hours and hours of meetings between “community representatives” and the Wellington City Council –  on a 10 year plan for the suburb –  and no one seems to find this strange, not 25 years on from the fall of European communism.

This isn’t intended to be a counsel of despair.  Things can change, but there doesn’t at present seem to be a pressing demand for change –  and particularly not for the sort of regulatory changes that would really make a major sustainable difference.  That means if change is really going to happen any time soon, someone –  some party –  is going to have to be willing to spend a lot of political or reputational capital on making initially unpopular change.  And that cost is only rising with each passing month in which more households – in Auckland and increasingly elsewhere –  take on debt at the new higher house prices.  Falling house prices don’t actually threaten most of those people –  servicing is the real issue –  but that doesn’t stop the prospect sounding pretty frightening.

One obstacles to getting comprehensive land use reform is fear in some circles –  particularly on the environmental left –  about what post-reform cities might look like.  Many talk disdainfully of “sprawl” –  as if there is something profoundly wrong about people in a small, lightly populated, country wanting a decent backyard for their kids to play in etc.  But even when the attitude isn’t disdainful, it is often fearful –  how far will Auckland stretch, and all those questions about roads and other infrastructure.  If Auckland really is going to grow by another million people those issues become a lot more pressing than otherwise.  People can, and do, come up with all sorts of smart solutions –  differential rates, MUDs etc-  and I’m quite sympathetic to all those arguments.  But they don’t really resonate with the wider public, and some visceral unease about “sprawl” (and even the loss of “prime agricultural land”) seems to.  It isn’t only the public: the Green Party is likely to be part of the next non-National government.

Which is partly why I think any successful sustainable package of land use reforms, particularly in New Zealand, should be accompanied by a commitment to much lower rates of non-citizen immigration for the foreseeable future.  As readers know, my main arguments about immigration policy aren’t about house prices –  which can be “fixed’ with proper supply side reforms –  but if one of the real barriers to land use liberalization is unease about population-driven “sprawl”, why not just take the policy-driven component of population growth out of the mix for a few decades?  It is not as if the proponents of immigration can show the real economic gains to New Zealanders from our immigration policy, and we know that GDP per capita in Auckland has been falling relative to that in the rest of the country, not rising.    There is no hard trade-off, only the scope for mutually reinforcing packages of reforms that might finally make a more liberal approach to urban land use possible in New Zealand, if some political leader (or coalition of parties) is really willing to take the risk.

Individual political leaders can make a real difference.  It would be great if one would stake a lot on urban land use reform, but anyone considering it needs to recognize the lack of precedents, the potential losers, and the worries and beliefs that underpin the durability of the current model here and abroad. And they probably need to find not only the right language to help frame repeal choices and options, but find a package of measures which helps allay – even if only in part, and for a time –  the sorts of concerns some have.  Plenty of the elites don’t really believe in choice and freedom  –  especially for other people –  but perhaps they might be a little more relaxed if they weren’t (reasonably or otherwise) worrying about the idea of an Auckland that stretched from Wellsford to Hamilton.

IMF advocacy for immigration: some caveats

The other day I came across mention of a chapter in the IMF’s latest World Economic Outlook on the economics of immigration.  It turned out to be only half a chapter (from page 183) but it had some interesting discussion and material.  It probably won’t surprise anyone that although immigration is a long way from the IMF’s core responsibilities, the Fund is pretty gung-ho on the benefits.  My own stance is, of course, more skeptical: I doubt the economic benefits to recipient countries are typically anywhere near as large as the enthusiasts make out, and in New Zealand’s specific case I think the evidence increasingly suggests that high rates of immigration in the post-war decades (continuing to today, as strong as ever) have been detrimental to the economic fortunes of New Zealanders as a whole.

Whatever the truth is, the IMF might want to be a little more careful as to how they present the material in support of their claim.  The World Economic Outlook is one of the flagship documents of the Fund, widely circulated and discussed (including at the Executive Board level) before release, not just some obscure researcher’s working paper.

And so I was interested to find this

There is a positive association between long-term real GDP per capita growth and the change in the share of migrants (Figure 4.16, panel 1).

I noted the careful wording (“association” rather than “causal relationship”) and went looking for the chart.

imf-immigration-chart-1

Which left me a little puzzled. The text said there was a relationship, illustrated by this chart, between increases in migrant numbers and real GDP per capita growth.  But the chart itself showed only a relationship between total real GDP growth and immigration.  That sort of positive relationship was hardly surprising –  growing migrant numbers raises the population, which tends to raise total GDP –  but the interesting question was surely about per capita growth.  And it wasn’t just a labelling error –  it was easy enough to reproduce the Fund’s chart, showing what the labels said it showed.

And so I started digging around.  The IMF uses a group of 19 advanced countries, the choice presumably limited by data availability (so, for example, Belgium, Italy, Iceland, Japan and Korea –  among advanced OECD countries –  aren’t included).  And they focus on 1990 to 2010, presumably also to ensure that all the data (for some of the background modelling) was available.  And rather than total migrant numbers, they look only at migrants over 25.  In the charts that follow, I just follow their basic approach/time period.  In terms of country selection, I’d note just two caveats: first, a large part of Luxembourg’s GDP is produced by people who don’t live in Luxembourg but commute in each day (so GDP per capita can be a bit misleading) and in Ireland the corporate tax system has helped contribute to a huge gap between GDP and GNI –  and it is the latter that measures income accruing to the Irish. Finally, it is worth noting that more than half the countries in the sample are in the euro, and 1990 to 2010 covered the period of convergence to the euro, and then the full effects of imposing a common interest rate on quite different economies.

With those methodological notes out of the way, what did the chart of growth in GDP per capita over 1990 to 2010 look like when graphed against the change in the migrant share of the (over 25) population over that period?

imf-migration-and-gdp-pc

The red dot (hard to see, but lower right) is New Zealand.  The outlier (top right) is Ireland.  Excluding Ireland, there is almost no relationship at all, and certainly not one that would pass any tests of statistical significance.

And in case you do want to include Ireland, bear in mind that the big surge in immigration to Ireland came after the most rapid growth in GDP, or GDP per capita.

ireland-popn-and-growth

Over 1990 to 2010, Ireland’s strong growth in real per capita GDP was pretty clearly not caused by immigration.

GDP per capita has its limitations, and the Fund –  and most immigration advocates –  typically argue that the most valuable gains from immigration arise from improvements in productivity. So using, the Fund’s period, the Fund’s sample of countries, and the Fund’s immigration variable, what did the (simple bivariate) relationships look like with, first, real GDP per hour worked growth, and then (often regarded as the best sort of productivity growth) multi-factor productivity (MFP) growth?

(In all these chart’s I’m drawing GDP and productivity data from the Conference Board’s Total Economy Database.)

Here is the relationship with real GDP per hour worked.

imf migration and gdp phw.png

Again, New Zealand is in red (lower right) and Ireland is the outlier.

This relationship might not be very statistically significant either but –  at least excluding the Irish outlier –  if anything it runs in the wrong direction for the IMF story.  Over this period, and on this particular measure/sample, there was a modest negative association between immigration and labour productivity growth.

And what about MFP growth?

imf-mfp

That relationship, especially excluding Ireland, is even more negative than the one for labour productivity.  And just to confirm that even on MFP, the immigration surge in Ireland came well after the best of the MFP growth.

ireland-mfp-and-popn

All in all, on these measures, for this sample of countries, over this period, there doesn’t seem to be much left of the IMF’s story.  Yes, immigration obviously tends to make economies bigger in total, but there is little sign in the informal analysis that it has made them more productive, and thus made the average individual citizen of the recipient country better off.

Of course, where it can the IMF likes to rest its claim on more sophisticated analysis than that.  Later in the chapter, they report that

Recent research suggests that migration improves GDP per capita in host countries by boosting investment and increasing labor productivity. Jaumotte, Koloskova, and Saxena (2016) estimate that a 1 percentage point increase in the share of migrants in the working-age population can raise GDP per capita over the long term by up to 2 percent.

The recent IMF “spillover note” that is drawn from is available here.  The authors use much the same countries, the same immigration variable, and the same sample period as in the WEO analysis above.   They also focus on the level of real GDP per capita, and the level of productivity, not just growth over a particular period.  Their approach has a number of advantages over earlier studies (including the focus just on advanced countries) and as the Fund notes, the estimated real GDP per capita gains are less than in some previous studies.

I’m not a technical modeler, so I’m not going to try and unpick the paper on those grounds.  My simple proposition is that the results do not, even remotely, ring true.

Here is a chart from the paper showing the stock of migrants in the sample countries.

stock-of-migrants

Think about France and Britain for a moment.  Both of them in 2010 had migrant populations of just over 10 per cent of the (over 25) population.  If this model was truly well-specified and catching something structural it seems to be saying that if 20 per cent of France’s population moved to Britain and 20 per cent of Britain’s population moved to France (which would give both countries migrant population shares similar to Australia’s), real GDP per capita in both countries would rise by around 40 per cent in the long term.  Denmark and Finland could close most of the GDP per capita gap to oil-rich Norway simply by making the same sort of swap.    It simply doesn’t ring true –  and these for hypothetical migrations involving populations that are more educated, and more attuned to market economies and their institutions, than the typical migrant to advanced countries.

(The study produces similar results for real GDP per person employed, but they do not test the relationship with either GDP per hour worked, or with MFP.  The authors suggests that the gains from immigration come through an MFP channel, but this seems doubtful –  especially over this period, and this sample, given the bivariate MFP growth chart above).

There are other reasons to be skeptical of the results in this IMF paper.  Among them is  that there is a fairly strong relationship between the economic performance of countries today and the performance of those countries a long time ago.  GDP per capita in 1910 was a pretty good predictor of a country’s relative GDP per capita ranking in 2010, suggesting reason to doubt that the current migrant share of population can be a big part of explaining the current level of GDP per capita (and some of the bigger outliers over the last 100 years have been low immigration Korea and Japan and high immigration New Zealand).    In fact, I’ve pointed readers previously to robust papers suggesting that much about a country’s economic performance today can be explained by its relative performance 3000 year ago.  How plausible is it that so much of today’s differences in level of GDP per capita among advanced countries can be explained simply by the current migrant share of the population?

And then, reverting to bivariate charts (but one from a relatively recent IMF working paper)

imf-hours-and-mfp

Total hours growth is not just determined by immigration, but differences in immigration rates account for a large part of the differences in population growth, and growth in total hours worked, over long periods of time such as those in this chart.  There is just no sign, over that period and those countries, of the longed for link between productivity growth (here MFP/TFP) and growth in anything remotely linked to differences in the volume of immigration.

To revert just briefly to the IMF WEO chapter, one of the advantages of looking at just 18 or 19 countries is that the authors should be able to illustrate their point, at least impressionistically, by reference to individual pairs of countries.  If nothing else, it is a bit of a realism check, but it can also help make the overall story seem more persuasive. But there is nothing of that in the IMF’s discussion and advocacy.   And nor is there any effort to deal with what might reasonably look like problems for the story.  The two countries with the largest increases in migrant share over 1990 to 2010 were Ireland and New Zealand.  In Ireland, as I’ve shown, the immigration clearly came after the peak productivity gains –  perhaps a case of sharing the gains, but hardly one where immigration looks causative.  And New Zealand, well….readers know the New Zealand story.  In 1990 we were supposed to be well-positioned to catch up again with the other advanced countries –  the sort included in the IMF sample –  and we had a big migration surge (by international standards of pretty good quality migrants) and yet over the full 20 years we’ve had among the lowest productivity growth rates (labour and MFP) of any of these countries.

Perhaps there are some other countries, or country pairs, where the intuitive case is more compelling.  It is shame the IMF didn’t put in the effort to find them

The Reserve Bank interest rate projections

The other day the Reserve Bank slipped out an advisory informing people that whereas they have previously published projections for the interest rate on 90 day bank bills, in future they will be publishing projections for the OCR itself.

The Reserve Bank has published economic projections since the early 1980s, and began publishing projections –  as distinct from simply technical assumptions –  for short-term interest rates in 1997.  Back then, we didn’t have a policy interest rate that the Reserve Bank set, and the 90 day bank bill rate was the most heavily-traded short-term interest rate and the most useful indicator of short-term money market conditions.

Somewhat belatedly (by international standards) we introduced the Official Cash Rate (OCR)  in March 1999.  The OCR wasn’t a rate that directly affected anyone outside the banking sector  – at the time it was introduced it wasn’t even a rate directly received or paid by anyone, simply the midpoint between the rate we paid banks on their deposits, and the rate we were willing to lend to banks on demand at.  But the OCR quickly established the expected quite tight relationship with rates that did affect firms and households in the real economy.  It was never a precise relationship –  one was for overnight money, one was for a 90 day term; one was for unsecured interbank lending and the other for almost risk-free transactions –  but it was close.

I don’t know recall whether we had much of a discussion at the time the OCR was introduced as to whether the projections should be published in terms of the OCR or the 90 day bill rate –  and there is no reference to the issue in the Bulletin article we wrote at the time.  But probably the view at the time (which I’d have endorsed) was that we should stick with the 90 day bill rate because (a) it was a rate that more directly affected real people, and (b) all our models were built in terms of the 90 day bill rate (and we had no time series of the OCR to re-estimate them).    After years of not directly controlling interest rates at all, we probably also liked the additional degree of ambiguity that the gap between the 90 day bill rate and the OCR provided in our communications.

Seventeen years on, it probably does make sense to switch over to using the OCR.  This post isn’t to disagree with the Bank’s change –  which, in the scheme of things, is a pretty minor matter.

But I was a bit puzzled by some of the reasoning the Bank advanced for making the change.   They mentioned two considerations.  The second one they list is fine

The publication of OCR projections as opposed to 90-day bank bill rate projections also brings the Bank into line with the practice of other central banks that publish expected policy paths.

Not many other central banks do publish short-term interest rate projections, but those that do use the policy rate itself, rather than some market rate closely linked to the policy rate.

But their main argument is that the relationship between the OCR and the 90 day bill rate (and perhaps, by implication, other rates that affect real economic activity and inflation) had changed or even broken down.

Historically the 90-day bank bill rate has provided a good gauge for the stance of monetary policy because it typically moves in a consistent manner with the OCR. Variations in the past have generally been temporary and experienced during periods of financial stress. More recently, regulatory changes in global financial markets have also been altering the relationship between the 90-day bank bill and OCR, complicating the Bank’s communication of the monetary policy outlook.

I knew things had gone a little haywire during the financial crisis –  relative to risk-free assets, yields on anything involving bank risk had gone much higher than usual.  But that was some years ago and –  frankly –  in the middle of a global crisis of that severity, projections are even less use than usual anyway.  But what about over the longer sweep of history, pre-crisis and more recently?  Here is a chart of the OCR and the 90 day bill rate.

ocr-and-90-s

And here is the gap between them.

90s-less-ocr

Not much looks to have changed.  If anything the gap is a bit less volatile since the 08/09 crisis, but that is probably mostly because the OCR itself has been less variable. That might change again at some point.

And it is worth noting that the relationship hasn’t changed materially even though what the OCR itself is has changed over the years.  It started out as the mid-rate between the Reserve Bank’s deposit and lending rates, but for the last decade or so it has been the deposit rate the Bank pays on (the bulk of) bank settlement account balances at the Reserve Bank.

Economic activity and inflation pressures aren’t directly affected by the OCR.  What matters more to firms and households are the rates they themselves receive and pay.  The Reserve Bank doesn’t publish very good data on those rates, but they do publish a number of long-running indicator series.

And there have been some significant changes in the relationships between wholesale interest rates and some of these key retail rates in the years since the financial stresses of 2008/09.    Here is the gap between the 90 day bank bill rate and (a) variable first mortgage rates, and (b) six month term deposit rates.

retail-wholesale-gap

Retail term deposits matter much more to banks now than they did, for some combination of regulatory and market reasons (and the cost of longer-term foreign wholesale funding –  not shown – influences just how eager banks are to pay up for term deposits).  As a result, both term deposit rates and floating mortgage rates are much higher, relative to 90 day bill rates, than they were in the pre-crisis years.  That is a major change that the Reserve Bank had to take into account (and consistently has).

But here is the same chart, except that this time I’ve used the gap between the OCR and the retail rates.

ocr-retail-gap

As you’d expect –  because the OCR and 90 day bill rates track so closely –  they tell almost exactly the same story.

I don’t doubt that, as they say

The Bank views publishing a projection for the OCR as a more transparent way of presenting the expected policy actions needed to achieve its inflation target.

But the gains will be small at best.  They will still be publishing smoothed quarterly projections, rather than specific projections for each OCR review –  the latter, which I’m not advocating, would take the transparency about policy rate expectations to the extreme.  And the Governor is still likely to be torn between times when he really wants to give a clear strong signal, and times when he is uncertain enough about the future, even a few months ahead, not to want to do so.

There is a reasonable case for the change the Bank is making, but –  contrary to what they suggest -the justification isn’t in any change in the relationship between 90 day bill rates and the OCR itself.  There hasn’t been one.   And if there have been problems with the Bank’s communications over the last few years –  and there have –  those problems have had very little, arguably nothing, to do with the precise short-term interest rate variable the Reserve Bank chooses to publish projections for.

In many respect, the bigger questions –  which everyone would grant are more important –  are whether

(a) the Reserve Bank should publish policy rate projections at all, and

(b) more radically, it (and other central banks) should publish economic projections at all.

I could devote entire, lengthy, posts to each, but won’t do so today.  My own view is that central banks shouldn’t publish policy rate projections –  most don’t –  and that if they publish economic projections at all, there is no value in projections for much more than a few quarters ahead.  The reason is really quite simple: central banks know almost nothing about the future (and neither, with any degree of confidence, does anyone else).

Here (purely illustratively) is the chart of 90 day bill rates, and Reserve Bank forecasts from each of the last three December MPSs.

90s-forecast-and-actual

These haven’t been uniquely difficult years. There was no domestic recession –  forecasters never pick recessions – the unemployment rate didn’t change very much, and if there were ups and downs in some of our export sectors it isn’t obvious that taken together things were much harder to read than usual.   And yet the Reserve Bank really had no idea where the OCR/90 day bill rate would be.  At times I’ve been quite critical of their specific misjudgements, but poor as some of those were, over long periods of time our Reserve Bank is probably no better or worse at medium-term forecasting than any of their peers.  It typically isn’t, and probably can’t, be done well.

A common defence is “oh, but we know the projections won’t be accurate, but at least we can give a sense of how we might react if (when) things turn out differently”.    But even that isn’t very persuasive. If they really think they can give us useful stable information about how they will react to changing circumstances, it should be enough to publish the model (s) they are using and the reaction function embedded in them.  As it is, I’m skeptical there is very much information in either those model reaction functions or in the published policy rate projections.  They might tell you how the Governor thinks now we would react in, say, 18 months time, but in truth he won’t know until he gets there –  partly because there will be a lot of contextual material not captured in today’s forecasts.  In the current New Zealand context, the medium-term forecasts are particularly useless –  the current PTA expires in only 11 months and, most probably, the current Governor will have retired and been replaced by then.  Different Governors will read the same data, and even the same PTA, differently.

Does it matter?  After all, if the policy rate projections –  beyond perhaps the next quarter –  have almost no useful (forecasting) information, perhaps they just do no harm?   I think they do do some harm, simply because resources are scarce and policymakers and their analytical staff have to choose where to focus their efforts. In my experience at the Bank, considerable time was devoted to trying to divine the future –  and haggle about the policy track that we would present.  Time spent on that, largely fruitless, task is time that couldn’t be spent making sense of what we already know, but don’t adequately understand: what has already happened (eg to core inflation) and why.  Central bankers –  and others –  whether here or abroad don’t have adequate answers to that, and without such answers attempts at projecting future policy rates etc are even more futile than usual.

When the Reserve Bank Board begins to turn their attention to choosing the next Governor, I’m sure they won’t be looking for a “soothsayer in chief” –  and they would be foolish to do so.  They will, I would expect, be looking for someone with the temperament and judgement to react wisely to events as they actually unfold, and to lead an organization as it does likewise.  It is hard to enough to do that, and even often to make sense of actual incoming (prone to revision) data, without maintaining the pretence that central banks –  or anyone else –  can read the future, and usefully tell us now where they think interest rates might be 12 or 18 months hence.


A Victoria University professor on New Zealand immigration

By the end of World War Two there hadn’t been much net migration to New Zealand for 20 years.

net-migration-20s-to-50s

There had been a big wave of assisted migration in the first half of the 1920s –  almost all those moving to New Zealand then were substantially financially assisted, initially largely by the British government, keen to assist ex-servicemen to resettle in the dominions, and then by the New Zealand government.  Financial assistance to migrants had long been a feature of New Zealand (provincial and central) government policy –  compared with the option of moving to Canada or the US (or even just staying in the UK), moving to New Zealand was expensive (time lost as well as fares).  But inflows to New Zealand dropped off after the mid 1920s and government assistance to migrants was largely discontinued from around 1927.  Over the twenty years, 1927 to 1946, annual net migration to New Zealand averaged less than 0.1 per cent of the population.  Not surprisingly, there was little movement during the war, and in the 1930s the outflows of the first half of the decade –  the UK was much less badly affected by the Great Depression than New Zealand was – largely balanced out the moderate inflows later in the decade.

At the end of World War Two, there was considerable angst about population prospects.  Birth rates around the advanced world, including New Zealand, had been low, and in many countries there was unease about what a flat or falling population might mean.  And the war itself had brought to the fore the idea that a lightly populated country might be unnecessarily prone to invasion threats.

There were no legal obstacles to immigration to New Zealand from Britain (or the other Dominions): as New Zealanders could move freely to Britain, so Britons could freely move here (as they could until the 1970s).  But in 1947, the government restarted the assisted migration programme – initially those selected had to contribute £10, but within a couple of years that requirement had been dropped.  Even though life in post-war Britain was pretty tough, and the gap in material living standards then was probably as large as it ever was, the government didn’t find it that easy to fill the number of free places it was offering.  But total immigrant numbers did pick up sharply and (as illustrated in the chart above) by 1952, the net inflow of immigrants had almost reached the sorts of levels soon in the first half of the 1920s.  And despite earlier worries about the birth rate, the “baby boom” happened here too.  In 1952, the total population increased by 2.5 per cent –  an even larger increase than we’ve experienced over the last year or so.

In 1952, Professor Horace Belshaw, an immigrant (as a child) himself, former student of Keynes at Cambridge, and by then McCarthy Professor of Economics at Victoria University and one of the most widely-published New Zealand academic economists of his day, turned his attention to the question of immigration to New Zealand.  In his short (32 page) booklet, Immigration: Problems and Policies, Professor Belshaw discussed some of the economic (and other) effects of high rates of immigration.

I’m going to reproduce here some of Belshaw’s material.  Regular readers will probably note a certain similarity with the economic analysis I have been presented about more recent New Zealand immigration policy (although I only found the Belshaw material a few years ago).

In beginning his discussion, Belshaw notes

In considering the volume of immigration which is in “the best interests” of New Zealand, it is necessary to distinguish between the “absorption capacity” at any particular time and what is desirable over the longer period…..we must compare the effects of a given growth of population with the effects of the larger population resulting from this growth.

…for example, the long run position will be affected by whether or not more intensive production in agriculture will yield a lower return per head with a somewhat larger population, whether the supply of electric power can be economically expanded to satisfy not only the increased use of electricity per head of population, but also the larger number of heads.  And the answer in both cases may be affected by technical discoveries not yet made.

Belshaw discusses a number of the transitional issues

Cultural absorption.  As he notes, most of the migrants at the time were from the UK and Northern Europe, and so

There will be personal misfits enough and the need to give assistance in orienting to the New Zealand way of life, but the cultures they bring with them at sufficiently close to our own to raise no special difficulty of absorption, and there are no social or political reasons to fear the growth of minority problems among groups which preserve a separate identity, such as have plagued the United States. On the other hand, migrants bring with them new skills, different accomplishments, and ways of looking at things which should prove economically advantageous and culturally enriching.

Immigration and the Labour Shortage

At the time when there are more vacancies than workers, it is natural to assume that immigration will relieve the labour shortage. This however, is a superficial view.  The immigrants are not only producers but also consumers. To relieve the shortage of labour it would be necessary for more to be contributed to the production of consumer goods or of export commodities used to buy imported goods than the increased numbers withdraw in consumption.  That is unlikely….[and] there will be some temporary net additional pressure on consumption.

Immigration and Capital Needs

Of much greater importance is the fact that each immigrant requires substantial additional capital investment, not in money but in real things.  Houses and additional accommodation in schools and hospitals will be needed. In order to maintain existing production and services, and even more to maximize production per head, there must be more investment in manufacturing and farming, transport, hydro-electric power, municipal amenities and so on.

To anticipate a little, immigration is not likely to ease the labour shortage while it is occurring, and is more likely to increase it because although additional consumers are brought in, more labour than they provide must be diverted to creating capital if the ratio of capital to production is to be maintained.  So the unsatisfied demand for consumers’ goods and therefore for labour to produce them will not be met.

…the fact remains that while it is occurring a population increase of the order under consideration will reduce the volume of capital per head, and for the time being cause production per head to increase slower than with a smaller rate of population increase. Immigration must be assessed in relation to its contribution to this situation.

The expansion of population of itself will increase inflationary pressures, for the net effect is to create additional purchasing power to finance capital creation without producing an equivalent volume of consumers’ goods and services.  This is another way of reiterating the point that it will not reduce labour shortages….. A sufficiently austere fiscal and financial policy might curb the inflationary effects, but not the necessity for capital formation nor the reduction for the time being in living standards.

As capital formation proceeds, the contribution of increased population to consumption will grow, and after five or six years may exceed current consumption per head. Meanwhile, however, each successive increase in population exerts inflationary pressures until such time as the aggregate increase in production from a larger population exceeds the annual capital formation needed by the growing population,  This would take a very long time.

He summarises his conclusions “in respects of current effects of immigration and population increase”.  Extracts:

2. Immigration of the scale contemplated is likely to increase inflation pressures and of itself increase rather than reduce the shortage of labour.

3. It will also increase the balance of payments problem and the need for credit controls, higher interest rates or import controls.

6. While it is occurring and for some time thereafter immigration on the scale contemplated is likely to lower living standards, either by reducing the supply of manufactured consumers’ goods or of facilities and amenities such as school and hospital accommodation, or by imposing additional strains on existing private and public capital.

My general conclusion is that the effects of such a volume of immigration on the New Zealand economy while it is occurring at the present time , are on balance prejudicial.

From the effects of immigration while it is occurring (and for several years afterwards), Professor Belshaw then turned more briefly to consider the effects of a larger population, once any transitional challenges had washed through.

Is it in the interests of New Zealand that the population should double in, say, 28 years (ie increase at a rate of about 2.5 per cent per year) and that immigration of a scale necessary to bring this about by supplementing natural increase should be arranged?  We reiterate that the problem is posed in these terms because immigration and natural increase have many similar effects.

He briefly looks at some non-economic factors

Strategic considerations.  In some quarters increased immigration is supported for strategic reasons. I have seen no analysis of the real issues by the proponents of this view, and in the absence of such a study confess to some reluctance to attach much weight to it in modifying opinions arrived at on other grounds.     ….a more likely strategy [than invasion] would be to blockade us into submission or ineffectiveness. The contribution of any conceivable immigration to New Zealand’s manpower then seems likely to make little difference.

Humanitarian Aspects of Immigration.  Presumably the immigrants will be better off than in their own countries, and the New Zealand community might be prepared to incur some sacrifices, if these prove necessary, to satisfy such a humanitarian impulse; but any possible volume of immigration will have a very small effect in relieving pressures in the home countries of the migrants.

Belshaw goes on to note that our then, in effect, “white New Zealand” immigration policy was unlikely to command much international admiration no matter how many migrants we took.

Cultural and Economic Enrichment.  Regarded from New Zealand’s own interests, a sizeable volume of immigration should prove advantageous in more ways than one…..The New Zealander who returns home after some time abroad [as Belshaw recently had] is often depressed at the unnecessary drabness and uniformity in the New Zealand way of life, and at the paucity and low level of achievement in many of the arts and crafts.  New blood may perhaps weaken the complacency with which these are accepted, and add spice and variety.  And there is no reason why these should be gained at the expense of those conditions and those national qualities which still make New Zealand so pleasant a place to live.  Is it really necessary, for example, that even in our main cities, our restaurants should be so reminiscent of the pioneering epoch (flies and all), and that the best food in the world should be so cavalierly treated?

As he notes, before turning back to economic considerations

this general line of argument supports the case for immigration, but not for any particular figure.

In commencing his economic discussion, Belshaw notes that

Presumably we should like to see such a trend of growth of population as is conducive to the maximum real income per head

while acknowledging that the answers and his opinions “must be very largely conjectural”.

He notes

it is a reasonable assumption that over the longer period immigrants will contribute much the same to both production and consumption per family as the general population. So we need not distinguish between immigrants and indigenous population when considering the effects of larger size, except insofar as the immigrants have brought new stimuli, arts and crafts, which we might otherwise lack.

Belshaw notes that there are some genuine economies from a larger population

As population becomes larger we should expect a variety of economies to result, increasing the effectiveness of labour applied to a given volume of capital.  The transport system would probably be more effectively utilized as the volume of traffic reduced overhead per unit of transport service…..There seems no reason why the machinery of government need increase pari passu with population apart from the extension in the range of government functions.

I believe these advantages to be real; but there is another side to the story.

….Here the capital requirements for population growth come into the picture. Previous discussion will have indicated that in my view these requirements are of such dimension as to greatly retard the increase in capital per head of population  Failure to increase, or even maintain capital per head will in large measure offset the benefits from a bigger population, increase the problem of bottlenecks, such as in relation to power, and by virtue of inflationary pressures distort the economy.  It seems unlikely that the annual increase in the production of consumers’  goods facilitated by a bigger population will offset the transfer of production to capital formation required by an increasing population. I fear that with a population increase of 2.5 per cent, we shall be faced with continued incentives to controls, primarily as a check on inflation…. Such controls may actually discourage enterprise. On these grounds I should consider that a smaller dose of inflation –  and therefore a smaller rate of population increase –  would be preferable.

Belshaw also discussed the scope for growth in exports, having devoted a considerable portion of his career to agricultural economics

The trend of external demand seems likely to be buoyant for farm products, though there may be recessions from time to time. Currently there are shortages in forestry products; but I have insufficient information to offer a judgement on prospective world demand some years hence. On the other hand, diversion of production to capital formation and the consequent internal inflationary pressure will adversely affect internal costs [in other words, raising the real exchange rate ] and divert labour away from farming and so impede expansion.  My view is that in consequence there will be less expansion in farming with a 2.5 per cent increase in population than with a smaller increase.

…I anticipated that we shall derive an expanded real income from overseas as a result of improvements in the terms of trade and of expanded exports; but reiterate that this expansion is likely to be larger with a smaller population increase….Hence on this score also we should expect a larger income per head with a lower population  increase.

Belshaw concludes his paper thus

Some probable developments favour immigration and others are unfavourable. But it is those elements favourable to the case for population increase which are most conjectural and uncertain. The current recurring disadvantages of a large population increase, and therefore of a large volume of immigration, seem to be more clearly demonstrable than the advantages of the larger settled population which would result from them.

The economy, and particularly the policy structure around it, in 1952 was different than it is now, and so not all the language easily translates into current discussions.  We don’t have exchange controls or (many) direct credit controls, and on the other hand, interest rates are much more variable, as are the nominal and real exchange rates.  But the essence of Belshaw’s story, almost 65 years ago, is really very similar to the lines I’ve been running about New Zealand.  Rapid population growth, now driven largely by immigration policy, almost inevitably puts considerable pressure on domestic resources, skewing resources away from production for consumption or exports to simply keep up with the capital requirements of a larger population.  Immigration doesn’t ease labour shortages, and if anything exacerbates them (at any economywide level).

Although I agreed with his conclusions, I didn’t find Belshaw’s analysis of the implication of a larger population as persuasive as his analysis of the transitional (multi-year) pressures.  But we know that there is no evidence that larger countries have achieved faster growth than smaller countries.  And I’d emphasise some different points than Belshaw does, especially the apparent constraints of distance/location, which would have been much less apparent in 1952, when agricultural and pastoral exports alone still produced top tier incomes for a small distant population.

But it is just a shame that successive governments in the 1950s and 1960s –  and again since the late 1980s –  have paid more attention to plaintive short-term cries from employers of “skill shortages, skill shortages” (only ever apparently relieved by recessions) than to the lack of good analysis and evidence that high rates of immigration actually make New Zealanders better off. Perhaps high immigration benefits native populations in some places and at some times –  I’m quite open to that possibility – but there is little sign they have in the past, or are now doing so, in post World War Two New Zealand.

After all, when Belshaw wrote, New Zealand had probably the third highest material living standards in the world.  Now, depending on the list you consult, we are no better than about 30th.  Other things have contributed to that glaring failure, but the repeated pursuit of a larger population (as a matter of policy) certainly shows no sign of having helped.  It was bad enough that the cautions of Belshaw –  and other economists –  were ignored back then. It is much worse now when for decades there has been a steady net outflow of New Zealanders, dispassionately assessing the prospects for themselves and their families in the country they know best, and deciding to leave.

Experts: harness them, don’t let them set the course

There was interesting long article in The Guardian the other day by Sebastian Mallaby, the author of a new biography of Alan Greenspan, on “The cult of the expert – and how it collapsed”.  His focus is central banking, but his concerns range much wider. For Mallaby, the (alleged) “collapse” of this “cult” is something to lament.

Of course, when you are brought up the son of a former senior British ambassador, educated at Eton and Oxford, previously a columnist for the Financial Times and then the Washington Post, when you are married to the editor of The Economist, when your books are biographies of two prominent unelected figures – Greenspan and James Wolfensohn, former head of the World Bank –  and when your column is published in The Guardian –  house journal of the British left-liberal technocratic elite – such a lament might be seen as not much more than a piece of class advocacy.

But I’ve usually found Mallaby interesting, and this column – which is well worth reading – had me reflecting again on quite what I think experts should be for.  To get ahead of myself (and pre-empt a long post), my answer was “advice” and “execution”, but only rarely for “decisions”.  That is a quite different answer than the one Mallaby offers. For him, experts simply need to sharpen up their act, become a bit more politically savvy, and show that they deserve the power they have assumed.

Quite early in his article, Mallaby poses the question thus

No senator would have his child’s surgery performed by an amateur. So why would he not entrust experts with the economy?

That one seemed pretty straightforward to me.  When one of my kids needed surgery a few years ago, I wanted expert advice on the options, risks and implications, and I wanted an expert carrying out the surgery, but the decision to proceed with one option rather than another wasn’t the surgeon’s.  It was mine.  The doctor has some specialized knowledge and technical skills, on the sort of case he had probably seen hundreds of times before (and I’d seen not at all).  And if the doctor ended up doing a completely different procedure than the one I’d authorized, or botched the operation, I had specific remedies and complaints procedures I could follow.  I’m sure there are complex cases, and sometimes genuine debate among medical professionals about the best way to treat some conditions, but ultimately the decision to proceed or not is made by the patient (or parent/guardian).

The same might go for house renovations.  A good architect, and capable expert builders and other tradespeople, can together enable an outcome that I couldn’t deliver myself.  Most of us need, and value, expert advice, and expert execution, but the decision to renovate the house, and how far to go, is the customer’s.  It is about choices and preferences on the one hand, and advice from experts who actually usually know what they are doing on the other.

It isn’t clear to me that there are very many areas of public policy where arrangements should be much different.

There are plenty of areas where in the administration of policy we don’t want politicians to have a hands-on role.  It is one of the cornerstones of our system that rules and laws, once established, should be applied impartially, without fear or favour.  Whether it is Supreme Court judges interpreting and applying the laws, or clerks administering benefit eligibility rules in WINZ, we don’t want politicians –  or any other of the “powerful” – getting a better deal, and more favoured treatment, than anyone else.  It is an ideal, and it isn’t always perfectly realized, but it is an ideal that is important to keep before us in designing and monitoring systems.  But it isn’t mostly an issue about technical expertise, but about impartiality in deciding on the administration of the rules.

Setting the rules themselves is quite a different matter.  That is, in many respects, the essence of politics and political debate –  hard choices, conflicting interests, conflicting evidence, and sometimes conflicting values.

As Mallaby notes, central bank operational independence, especially around monetary policy, became something of a stalking horse for people with interests in many other fields of policy.

The key to the power of the central bankers – and the envy of all the other experts – lay precisely in their ability to escape political interference. Democratically elected leaders had given them a mission – to vanquish inflation – and then let them get on with it. To public-health experts, climate scientists and other members of the knowledge elite, this was the model of how things should be done. Experts had built Microsoft. Experts were sequencing the genome. Experts were laying fibre-optic cable beneath the great oceans.

He draws on the published thoughts of Alan Blinder, Princeton economist, who spent time as chairman of the Council of Economic Advisers, and as vice-chairman of the Federal Reserve.  As Mallaby tells it:

His argument reflected the contrast between his two jobs in Washington. At the White House, he had advised a brainy president on budget policy and much else, but turning policy wisdom into law had often proved impossible. Even when experts from both parties agreed what should be done, vested interests in Congress conspired to frustrate enlightened progress. At the Fed, by contrast, experts were gloriously empowered. They could debate the minutiae of the economy among themselves, then manoeuvre the growth rate this way or that, without deferring to anyone.

To Blinder, it was self-evident that the Fed model was superior – not only for the experts, but also in the eyes of the public.


…..Blinder advanced an alternative idea: the central-bank model of expert empowerment should be extended to other spheres of governance.

Blinder’s proposal was most clearly illustrated by tax policy. Experts from both political parties agreed that the tax system should be stripped of perverse incentives and loopholes. There was no compelling reason, for example, to encourage companies to finance themselves with debt rather than equity, yet the tax code allowed companies to make interest payments to their creditors tax-free, whereas dividend payments to shareholders were taxed twice over. The nation would be better off if Congress left the experts to fix such glitches rather than allowing politics to frustrate progress. Likewise, environmental targets, which balanced economic growth on the one hand and planetary preservation on the other, were surely best left to the scholars who understood how best to reconcile these duelling imperatives. Politicians who spent more of their time dialing for dollars than thinking carefully about policy were not up to these tasks. Better to hand them off to the technicians in white coats who knew what they were doing.

And yet, 20 years on, there is no sign that the public  –  really anywhere in the advanced western world –  wants to hand more policy-setting power over to technocrats and unelected officials.  (On other hand, the power grab by officials –  and even ministers averse to the involvement of legislatures –  goes on in almost every country; the administrative state keeps growing.)

The Reserve Bank of New Zealand Act gets a brief mention in Mallaby’s article.  In conception, it was perhaps the strongest possible case for delegating operational policy decision to officials (“experts” –  although none of the three decision-making Governors since 1989 would really have qualified as monetary policy experts when they were appointed).   It seems to me that three or four beliefs/propositions underpinned the case for handing over decision-making power around the conduct of monetary policy:

  • politicians had all the wrong incentives and would almost invariably postpone hard decisions, creating a bias towards inflation, and excessive economic variability,
  • it was relatively straightforward to specify the goal society wanted pursued with monetary policy (so officials weren’t being asked to make meaningful trade-offs, just “read the data, and do the right thing –  the latter according to the societal rule”)
  • it was relatively straightforward for able technocrats to make the right decision –  consistent with the societal rule.
  • holding officials to account was quite straightforward.

There is a small element of caricature in the way I’ve written that list, but I think it gets at the essential assumptions behind the monetary policy bits of the Reserve Bank Act.

Perhaps it was a reasonable story for ministers and officials to tell themselves in the early post-liberalization years.  But none of it bears much relationship to reality.

Perhaps politicians postpone hard decisions on monetary policy –  though it has never been clear to me why this should have been more of a problems in respect of monetary policy (where the lags are quite short) than in other areas of public life (where the lags are often long, and adverse consequences hard to pin down even years later).  And, of course, we’ve now spent the best part of decade grappling with inflation rather lower than most official targets suggest desirable.

And people pretty quickly realized that technical experts could disagree –  at times quite vociferously –  and that there was no very obvious reason to consistently favour one technical expert over another.  And there were/are real choices being made –  on things that matter to voters, such as how much to prioritise lingering unemployment gaps, and on things where it isn’t easy for society to write down in advance how it wants to technical experts to manage the tensions and trade-offs.  And there is no reason to think that “technical experts” are any better placed to decide those trade-offs (or less prone to be influenced by their own class or educational interests/biases) than the public as a whole through the political process.

And, largely as a result, effective accountability for central bankers is limited at best –  really only at the time of potential reappointment.  There are no complaints procedures or expert review and investigatory bodies.  And while the New Zealand case isn’t general, in our case not only is the power handed over to an unelected agency –  notionally ‘expert’ –  but it has been handed over to a single individual for many years at a time.  That isn’t done in other areas of public policy, even when policymaking powers have been delegated by Parliament.

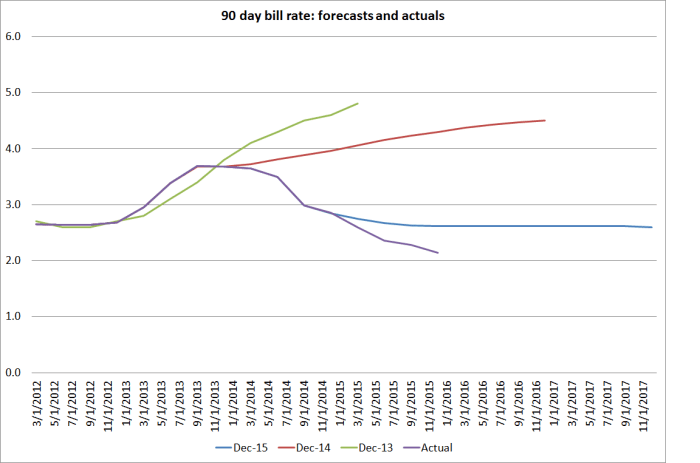
A fundamental part of any proposal to delegating policymaking power to “experts” has to be that such “experts” really know what they are doing.  But the evidence for that, even as regards monetary policy is now pretty slender.  I certainly wouldn’t be hiring as builder or a surgeon someone who had as bad a track record as the world’s central bankers have had over the last decade or so.  That isn’t intended as a personal criticism of any of them, all of whom have no doubt sought to do their best.  But they’ve constantly misjudged inflation pressures, and not randomly but systematically.  I’m not even suggesting replacing them with another bunch of superior experts.  It is just that the limitations of our knowledge are simply too great.  Even if we could all agree that the only thing we wanted from our central banks, year in year out, was 2 per cent inflation, there is no expert consensus on how best to deliver it, and what expert consensus there is has a pretty poor track record.

And, of course, there is even less agreement in practice –  where society seems not just to want 2 per cent inflation, year in year out. In the current climate, some favour a more aggressive use of monetary policy, perhaps to use demand to soak up laid aside labour and prompt a resurgence in the supply side of the economy (Janet Yellen’s recent speech seemed to point a bit in that direction).  Others are quite content to put inflation targets somewhat on the backburner for a while, out of fear of incipient financial crises (in this part of world, both Graeme Wheeler and Phil Lowe) seem inclined to that sort of thinking.  In Sweden not long ago the monetary policy decision-making body was torn apart by the tension between these sorts of views.  There is no straightforward generally agreed analytical framework, revealed only to the “experts”, enabling them to make such decisions better than anyone else.

Thus, I was bit troubled when I read Phil Lowe’s first speech as Governor.  In it he notes some of these choices and trade-offs, but then falls back on the (non-statutory) concept of “the public interest” (the RBA’s statutory goals are much vaguer than those of the RBNZ, but “the public interest” doesn’t feature, at least not directly).

He notes

So when thinking about what type of variation in inflation is acceptable, it is natural for us to start by asking ourselves: what is in the public interest?

But

Granted, this can be hard to define and opinions can differ

And

This might all be less tightly defined than some people would like. But given the uncertainties in the world, something more prescriptive and mechanical is neither possible nor desirable. Inevitably, judgement has to be exercised. Successive governments have appointed nine dedicated Australians to the Reserve Bank Board to exercise that judgement in the public interest.

I have a lot of sympathy for the view that a “more prescriptive and mechanical” target for discretionary monetary policy isn’t really possible.  But if it isn’t possible, why should suppose that Lowe, his deputy, the Secretary to the Treasury, and the non-executive directors –  not one of whom ever faces an electoral test –  are best placed to work out what is in “the public interest”?  Better than the (somewhat dysfunctional) elected governments?    If there is going to be an operationally independent central bank, I think the Australian governance model is clearly superior to our own (though in turn probably inferior to the UK’s) but why would one delegate such discretionary powers at all?  One could no doubt mount an argument for lower, or higher, interest rates in Australia at present, even with a shared assessment of the outlook for inflation.  The differences will turn on preferences, values and –  frankly –  hunches.  They won’t turn on, say, the sort of solid track record of a surgeon who has done much the same operation hundreds of times before.  None of us –  central bankers, outside economists, politicians, the public –  have ever seen quite such conjunctions of economic circumstances before.

None of which is some call for rank populism.  As I said very early on in this post, there is a valuable role for experts in advice and execution.  We want capable people who know exactly what they are doing conducting the market operations that implement monetary policy.  And it is likely that economists and related experts can offer some useful advice on the options that societies face around monetary policy and the underperformance of economies in recent years.  But the “experts” just don’t know that much at present – that isn’t an accusation, it is a fairly neutral description of what one reads in speech after central bank speech.  And it isn’t a matter of shame, but of alignment.  We shouldn’t –  and generally don’t –  delegate policy decisions when the evidence base is weak and there are real and contested tradeoffs.

And all this has been about monetary policy, where perhaps once the case for delegation looked strongest.  Banking regulation is perhaps a clearer illustration of my point: we want people administering the rules without fear or favour, we need detailed expertise on specific instruments or institutions, and we need expert advice as input to policymaking.  But in setting policy there are real and inescapable choices, and there is little obvious reason to think decision-making on what the rules should be should be delegated to “experts”.  Take LVR policy as a recent New Zealand example: all the choices have distributional implications, there is little or no established body of knowledge of research, and in the end the decisions that have been made rest on little more than educated hunches, and about risks, costs and tradeoffs.  Perhaps they are the right hunches, but we have no way of knowing. It isn’t remotely like asking a doctor to use his expertise to reset a broken bone.  If the case for such policy is so strong, let the experts persuade the politicians –  who are elected, and can be unelected.

Mallaby is writing with two backdrops in mind.  The first is his recent biography of Greenspan, who appears as a hero in the story.  And the second is what he appears to regard as the “disaster” of Brexit and the Trump insurgency (even if the latter now appears unlikely to storm the citadel).  About Greenspan, you can read Mallaby’s argument for yourself.  I’m more inclined to the view, reflected in Peter Conti-Brown’s book that I wrote about earlier in the year, that Alan Greenspan is an argument for term limits for heads of central banks.  Over 19 years as head of the Federal Reserve he became such a dominant presence, including in the political debate, that (among other things) his views somewhat overshadowed the looming risks that eventually culminated in the 2008/09 crisis.  And frankly, no matter how able –  and Greenspan didn’t walk on water –  there is something amiss when a technocrat, never facing an election, wields that much power.

I was (and am) a Brexit supporter, so I can’t share Mallaby’s distaste for Michael Gove’s dismissal of “experts” in that debate.  How one’s country should be governed, in close association with which other countries, seem quintessentially like an issue on which the public might quite reasonably have a view.  To be sure, as always, there is a place for expert advice on the issues and implications of the various possible choices, but “experts” have interests too, and they are necessarily or always those of the wider public.  As I noted earlier in the year, in many cases the end of the British empire led to independent successor states that struggled economically.  Perhaps independence was a “sensible economic choice”, but in sense that is the point; people value different things, and perhaps put a premium in that case on self-government, even if at some economic cost.

Towards the end of his article, Mallaby notes

Democracy is strengthened, not weakened, when it harnesses experts.

And I agree.  But the operative word there is “harnessed”.  Experts have a valuable role as advisers and –  in policy matters often a different set of “experts”  –  as implementers.  Expert advice can help illuminate the costs and consequences of the choices and tradeoffs societies make –  whether relatively mundane ones around monetary policy, or more existential ones around decisions to go to war, to construct welfare states or whatever –  but “experts” are typically ill-equipped to make those decisions for us.  In fact, often enough, even what appears to be a consensus of expert opinion –  or establishment opinion (often the same thing) – is left in tatters by experience.  To end on a note more of politics than economics,  there was a column in the New York Times a few days ago

Almost every crisis that has come upon the West in the last 15 years has its roots in this establishmentarian type of folly. The Iraq War, which liberals prefer to remember as a conflict conjured by a neoconservative cabal, was actually the work of a bipartisan interventionist consensus, pushed hard by George W. Bush but embraced as well by a large slice of center-left opinion that included Tony Blair and more than half of Senate Democrats.

Likewise the financial crisis: Whether you blame financial-services deregulation or happy-go-lucky housing policy (or both), the policies that helped inflate and pop the bubble were embraced by both wings of the political establishment. Likewise with the euro, the European common currency, a terrible idea that only cranks and Little Englanders dared oppose until the Great Recession exposed it as a potentially economy-sinking folly.

Like most cults, the “cult of the expert” is more dangerous than Mallaby –  or most of the expert class – acknowledges.  And hotly contested political debate, messy as it often, wrong directions that it sometimes takes, are how we make the hard choices, the trade-offs, amid the inevitable uncertainty. Abandoning that model is akin to gutting our democracy of much of its substance.  So I still want an expert operating on my child, but I want parliaments making laws and setting taxes (not officials) and parliaments taking us to war (not generals).  And I increasingly wonder whether monetary policy decisions should be left to officials either –  no matter how technically able, and how many of them on the decisionmaking panel.


Eden Park advertisers and the NZ tradables sector

My wife and son were watching the rugby test on Saturday evening but, not being overly interested in rugby, I started paying attention to the companies that were advertising at the ground.

All Blacks tests are one of the international showcases of New Zealand, with a substantial overseas broadcast audience.  And that particular test was against the Wallabies, and Australia is the largest export market for New Zealand firms’ goods and services.

I can’t be sure I jotted down all the advertisers: I was dependent on the camera angles Sky showed and I wasn’t paying rapt attention to every second of the game.

But these were the companies/brands whose adverts I thought I spotted:

AIG,  Adidas, American Express, Ford, Mobil, Asteron Life, DeWalt, Stihl, KitKat, Gatorade, Kia

Kennards, Owens, Resene, ASB, Pacific Build Supply, Bedpost, Barfoot and Thompson, Drymix, Rebel Sport, G.J. Gardner, Steinlager, Air New Zealand, Mainfreight and Zestel Gum (yes, I had to look up that one) and Auckland (Council or a CCO).

So I noted 26 advertisers.  One was a local government agency.  Of the remaining 25, 11 were overseas firms/brands, selling into the New Zealand market and in other countries.

It was the other group of firms/brands that interested me.  Of them, as far as I could tell only two were New Zealand based internationally-oriented firms: Air New Zealand, and Mainfreight (which now has substantial overseas operations).  And Air New Zealand, while currently very successful, collapsed only 15 years ago, remains majority state-owned, and one assumes its continuing independent status largely depends on the heavily regulated nature of the international airline and landing rights market.

I gather there are some reasonable substantial exports of Steinlager, but then Steinlager is a product/brand now produced by a Japanese-owned company.

Perhaps on another occasion a rather different mix of companies would have been advertising, and the New Zealand based ones might have been a more outward-oriented group.  But in microcosm, it did seem to capture something of the strangely-imbalanced New Zealand economy, struggling to make inroads in international markets or against international competition.

That phenomenon is nicely illustrated by my regular chart showing tradables and non-tradables components of GDP (recall that primary production and manufacturing, and exports of services make up “tradables” –  and the rest of GDP is non-tradables).  It is only a rough indicator, but it seems to have told quite sensible, intuitively plausible, stories.

T and NT GDP oct 16.png

In per capita terms, tradables sector GDP is still lower than it was on average in the first eight years of the 2000s (prior to the recession). In fact, the peak in the series was way back in 2004q2.  There has been no sustained growth in average per capita tradables sector production for 15 years.

That shouldn’t really be very surprising.  With able people and fairly good institutions, still the main thing New Zealand has going for it, as location for internationally-oriented businesses, is the natural resources that are here.  And when the population increases as rapidly as it has in the last 15 years, with no major new natural resources to tap, and with sustained upward pressure on the real exchange rate, it is hardly surprising that there has been so little (per capita) tradables sector growth.

Or so few successful outward-oriented New Zealand firms to advertise to the world from Eden Park.


Does Australia really need “the English influence”?

I’ve been intrigued for some time by the way in which some Australian business and media leaders seem to think that New Zealand –  perhaps especially under the stewardship of the current government – is a model of governance and economic management to be emulated.  Indeed, when it suits, this idea even reaches all the way up to some politicians.  On the day of his successful party-room coup to topple Tony Abbott, Malcolm Turnbull declared

“John Key has been able to achieve very significant economic reforms in New Zealand by doing just that, by taking on and explaining complex issues and then making the case for them. And I, that is certainly something that I believe we should do and Julie [Bishop] and I are very keen to do that again.”

As I noted in a post at the time, the list of “very significant economic reforms” was so short I couldn’t think of any.

What puzzles me more is when senior New Zealand commentators buy into the same story.  Fran O’Sullivan’s column in the Herald yesterday, “Oz needs the English influence” seemed to do exactly that.  It is interesting to know how some influential Australians see the New Zealand story, but O’Sullivan seems to share the belief, noting that our economic performance is “something to skite about when it comes to transtasman rivalry”.

Of course, everyone knows Australia has its problems.  They still have a federal government budget deficit, and we don’t. The Prime Minister has changed so often in the last decade, it must almost look familiar to Italians. And in Wayne Swan and Joe Hockey, they’ve had a couple of Treasurers who didn’t command much respect.  And Australia is coming off the back of a massive mining investment boom –  in many respects a nice problem to have, and in contrast to the lack of much of market-led export-oriented business investment boom in New Zealand any time in recent decades.

And, of course, if the National-led governments of the last eight years have all been minority governments, John Key and Bill English mostly seem to have managed the politics quite adeptly: they are still in office, and look to have a reasonable chance of winning again next year.  And English is a thoughtful Minister of Finance, even if not one with much of an economic plan.

But one can always find thoughtful individual ministers –  I recall reading speeches by Craig Emerson, a minister in the Rudd/Gillard governments and a former senior public servant, and wishing we had ministers who could give such thoughtful and rigorous speeches.

And Federal systems, and bicameral Parliaments, are just harder to manage –  but not necessarily worse for it – than the New Zealand system.

My benchmark remains the numbers.  It is no secret that GDP per capita (and all variants on it) is much higher in Australia than in New Zealand.   That has been so for at least 40 years.  It is the reason why lots of New Zealanders move to Australia, and only a small number of Australians come to New Zealand.

But I guess that in thinking about the Australian Key-English admiration  the focus should really be on how the data have changed in the last few years.  Has the vaunted Key-English style and substance succeeded in changing direction, closing the gaps between New Zealand and Australia?  After all, John Key was once quite explicit that his goal was to close the income gap between New Zealand and Australia by 2025.

Here is the headline comparison, looking at real GDP per capita

gdp-pc-aus-vs-nz

On this measure, Australia was doing slightly less well than us during the previous boom.  They did much better than we did through the recession and the peak of the terms of trade boom.  And over the last few years, things have settled back again.  For the whole period –  this century to date –  New Zealand and Australian per capita GDP have grown at much the same rate.

New Zealand and Australian governments have almost no control over the respective terms of trade for their countries, and those series are quite volatile.  But if you dig into real per capita income measures (which take account of terms of trade fluctuations), New Zealand has done slightly better than Australia over the century to date.

But that seems to me to be about the absolute limit to the favourable story.

What about productivity growth, the foundation for sustained long-term prosperity?  Here is labour productivity

gdp-phw-nz-vs-aus

You can discount the very last New Zealand observation (on account of a break in the hours worked series, when SNZ updated the HLFS methodology).  But it isn’t exactly a picture which reflects well on New Zealand over the last few years (and especially the years when both countries have had centre-right governments).  In fact, the New Zealand numbers are so bad one half suspects SNZ might eventually revise some of the weakness away.  But in the meantime, no obvious advantage to New Zealand.

We’ve managed not to lose any more ground relative to Australia on GDP per capita. but only by working even more hours.    Here are Australia’s hours worked and population data

aus-popn-and-hours

And here is New Zealand, on exactly the same scale (and again, discount the very last hours observation).

nz-hours-and-popn

Of course, there is nothing wrong with working longer hours if that is what individuals choose, but for whole economies it isn’t usually a sustainable path to greater prosperity.  And while productivity gains are pure benefit, longer working hours –  especially with little or no productivity growth –  is mostly just a cost.

In some areas, New Zealand does typically do better than New Zealand.  Our labour market is less heavily regulated than Australia’s –  and much less subject to union corruption –  and, as a result, our unemployment rate is typically a bit lower than Australia’s.  Here are the two unemployment rates over the last few decades.

u-aus-and-nz

Right now, the gap between the two unemployment rates –  0.6 percentage points –  looks about normal.  But for much of the current government’s term what was striking was how high our unemployment rate lingered (and above Australia’s for several years).  It isn’t obvious that any special credit is due to the current New Zealand government.

But what about government finances?

It is certainly true that our central government has a modest surplus, while the Australian federal government is still in deficit.  But recall that Australia has a federal system, and the state budgets make  up quite a large proportion of overall government spending and revenue.  International agencies tend to focus on “general government” data –   central, state (where relevant) and local government.  Cyclical adjustment also matters.

Here is OECD’s latest estimates of the cyclically-adjusted general government estimates for the two countries.

net-lending-aus-and-nz
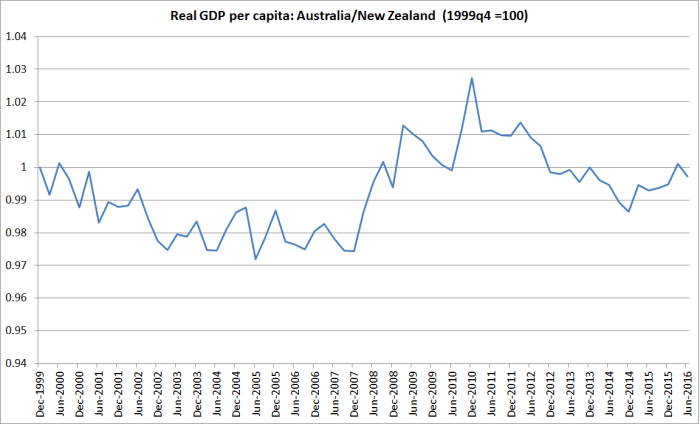
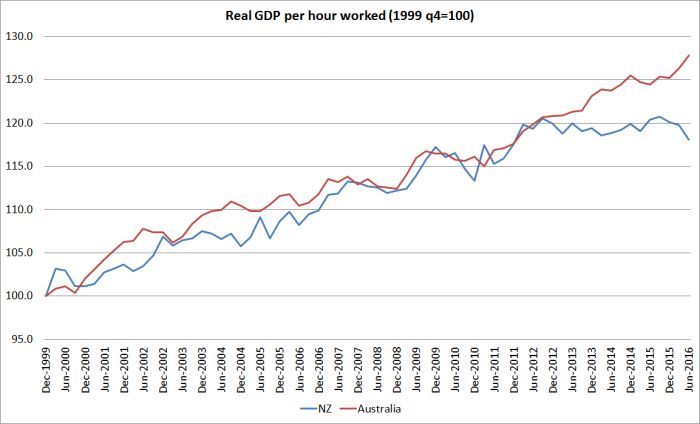
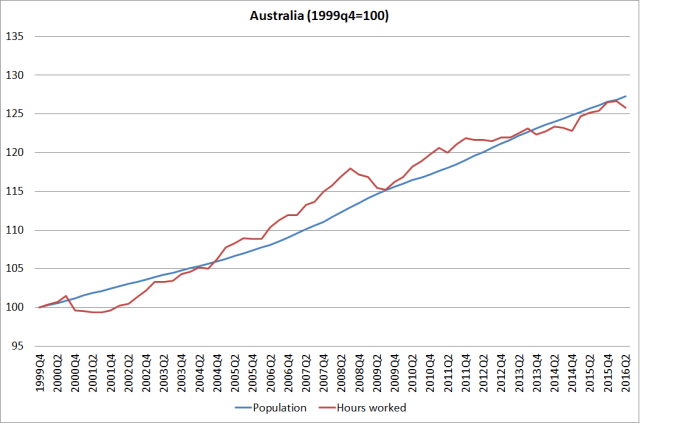
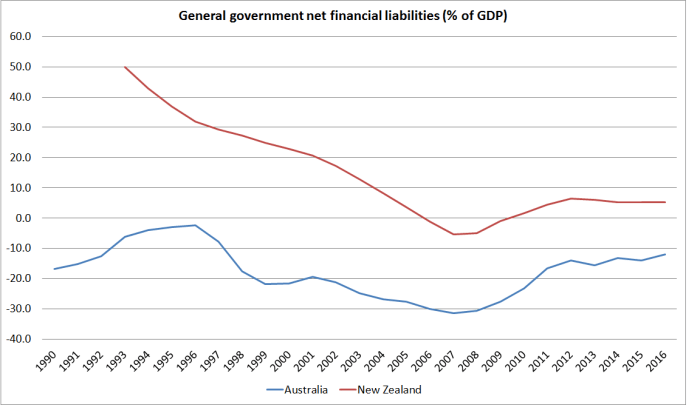
Almost indistinguishable not just now, but over most of the last 20 years.  I’m not sure I’m totally convinced, but that is the OECD’s read.  Again, nothing that particularly stands out to the credit of English/Key relative to Australia.

And here is the OECD data on government debt (net liabilities, across all three tiers of government) as a share of GDP.

gen govt net debt.png

New Zealand governments did a great job getting net debt down in the 90s and 00s, but  New Zealand’s net debt is still higher than Australia’s.  Since the last pre-recession year, 2007, Australia’s debt has increased more than New Zealand’s (share of GDP).  That probably is to the credit of Key/English, especially given some of the earthquake fiscal pressures, but on this measure, Australian governments’ net debt is still a bit less than ours was in 2007.

Business leaders also tend to believe –  as I do –  that, within limits, smaller government and lower taxes are conducive to better long-run productivity growth.  Stability in the share of GDP spent by government is also generally thought to matter (reducing uncertainty about future tax rates).

Here is general government spending as a share of GDP.

gen-govt-disbursements-aus-and-nz

Not only is Australian government expenditure lower as a share of GDP, but it is more stable.  And the gap between those two lines has not narrowed over the Key/English years; if anything it has widened.

And here is the picture of revenue

gen-govt-receipts-aus-nz

There isn’t much of a story about variability –  really big terms of trade fluctuations generate a lot of revenue volatility – but again Australian government revenue (mostly taxes) is consistently materially lower than that in New Zealand.

So I’m still a bit puzzled why the Australian business people and commentators seem so taken with the New Zealand story. There is (almost) nothing there. No serious reforms and (to the extent any disagrees with that assessment) no significant productivity growth. No sign of the gaps closing.   The size of government is bigger here, but then it has been for a long time.  And, more positively, the unemployment is a lot lower here, but again current numbers aren’t out of line with past patterns.

I presume much of it just comes down to two things:

  • whenever elites in any country are discontented with their own governments, it is easy to contrast them with some other group of politicians (whose own record is rarely examined closely) over the water,
  • the National-led government has been able to count (law changes it proposes mostly happen, and the details of the languishing RMA reforms are no doubt lost on opinion formers in Australia).  But then it is great deal easier to “count” here, where typically National needs one or two votes from parties it has longstanding confidence and supply agreements with.  It is just harder in Australia, between the role of the states, a governing bloc that is itself a coalition of the Liberal and National parties (National MPs having no say in who is Liberal leader and PM), and the Senate where it is rare for any party to be able to command a stable majority.

John Key and Bill English might be more successful politicians than Rudd, Gillard, Abbott, and Turnbull: the New Zealanders have won three elections, and the Australians have won only one each, and the first three have then been ousted by their own parties.

Perhaps that sort of political stability/political success has its own appeal in certain circles, but if we are judging political leaders by their fruit, there is still nothing much about the New Zealand economic story that should prompt any envy in the eyes of our trans-Tasman neighbours.  Sadly……still……after decades and decades.

Rugby might be another matter, but then I’m a cricket fan.


Getting back to monetary policy

Sometimes ill health does strange things. I’ve been quite unwell for the last couple of months (slowly getting back to normal now) and in that time my interest in current monetary policy and the monetary policy words/actions of the Reserve Bank dropped right away (displaced, according to my book list,  by copious Trollope novels and books of early 20th century history). I didn’t write a post about the last OCR review, and it is more than eight weeks since I last wrote a post about current monetary policy issues at all.

In the grand scheme of things, monetary policy just isn’t that important.  Bad monetary policy won’t impoverish us, and the best monetary policy possible won’t make any material difference in reversing our decades of economic underperformance.  But the same is true of lots of things, and monetary policy is one of the things I know.  And over shorter-term horizons it makes more difference to the fortunes of individuals (and firms) than many other things government agencies do.

The Reserve Bank is charged with keeping annual CPI inflation “near” 2 per cent on average.  Monetary policy takes time to work, and there are all sorts of “one-offs” that muddy the water, so no one would ever expect out-turns averaging bang on 2 per cent, except by chance.  The Policy Targets Agreement talks about “near”, and outlines various reasons why actual inflation might appropriate deviate from the target.  One of the salient ones is the direct impact of government taxes and charges: when the government raises tobacco taxes or cuts ACC levies, those aren’t things you hold monetary policy to account for, or expect monetary policy to try to offset.  Any other approach would deliver daft results.

So how do things stand on inflation now, four years into the Governor’s term?

Here is headline CPI inflation, the focus of the Policy Targets Agreement.

inflation-target-and-outcomes

The 2 per cent focal point has only featured in the Policy Targets Agreement since the end of September 2012  (although prior to that 2 per cent was also the (unstated and unfocused on) midpoint of the target range).

The Governor has often rightly called our attention to the role falling global oil prices have played in dampening headline inflation.  The CPI ex petrol series somewhat overstates the contribution of falling oil prices, because exchange rate pass-through into domestic prices is pretty full and immediate for oil/petrol, and the Governor’s monetary policy choices are one of the things that has held up the exchange rate.  But setting that caveat to one side for the moment, here is the CPI ex petrol series.

cpi-ex-petrol

Inflation on that measure is not only well away from the 2 per cent focus, but it is below the bottom of the 1 to 3 per cent target range.  And doesn’t really look to be picking up much, unless perhaps you put a great deal of weight on the one particularly low annual number at the end of last year.

What of the various other core measures?  At times, the Governor has put a very heavy weight on the Bank’s sectoral core factor model measure of inflation.  It has shown some signs of having turned a corner, and started picking up.  Unfortunately, the way that measure is calculated leaves it prone to quite significant revisions as new data are added (if I recall rightly, back in 2011, the real-time estimates suggested core inflation was above 2 per cent).

sectoral-core-revisions

In this chart, I’ve just shown the estimates for the sectoral core measure a year ago, and those now.  In that time, new data have led to past estimates of the sectoral core inflation rate being revised further down (ie the trough was worse than the Bank realized).  And the current estimate of 1.5 per cent is slightly lower than the 1.6 per cent being reported only a few months ago.

There is no perfect measure of core inflation –  empirically, or perhaps even conceptually.   And the measures the Bank and SNZ report show quite a range of numbers.

Annual inflation year to September 2016
Weighted median 1.7
Sectoral factor model 1.5
Factor model 1.3
CPI ex food and energy 1.1
CPI ex petrol 0.8
Trimmed mean 0.7

The median of those estimates is 1.2 per cent.

We are approaching the next Reserve Bank Monetary Policy Statement.  As everyone is aware the Reserve Bank has cut the OCR quite a long way over the last 16 months, and has indicated that its projections suggest further cuts will be needed to ensure that inflation settles back near 2 per cent.

Only two years ago, in its December 2014 Monetary Policy Statement, the Governor indicated that he expected further increases in the OCR, from the then level of 3.5 per cent.  They soon realized that was a mistake.  But here are those core measures for the year to September 2014 (the latest CPI data in December 2014) and for the most recent year.

Annual inflation year to September
2014 2016
Weighted median 1.7 1.7
Sectoral factor model 1.3 1.5
Factor model 1.4 1.3
CPI ex food and energy 1.4 1.1
CPI ex petrol 1.2 0.8
Trimmed mean 1 0.7

On only one of those six measures is core inflation any higher now than it was then, although in all cases there were lower numbers at some point between then and now.   The cuts in the OCR –  reversing the unwarranted 2014 increases – may have helped stem the decline in core inflation, but haven’t yet done much to get it back to near 2 per cent.

Perhaps there are still further increases in core inflation in the pipeline?  But recall that the largest cuts in the OCR were concentrated in 2015 –  100 basis points of cuts between the June and December 2015 MPSs.  Not all the effects of those cuts will yet have been felt, but the effects are likely to start waning fairly soon.   This year so far we’ve had 50 basis points of OCR cuts, some of which simply offset the impact of falling inflation expectations.  And the exchange rate has been rising this year.

As I noted earlier, when governments raise indirect taxes (eg on tobacco) or cut government levies (eg the ACC component of vehicle registration fees) one really wants to look through such effects.  Unfortunately, SNZ does not publish a series for the CPI excluding taxes and government charges –  and I would urge them to consider doing so – but they do publish a series of non-tradable inflation excluding government charges and the cigarette and tobacco subgroup.  At present, those two exclusions capture the tobacco tax and ACC effects.  Non-tradables inflation typically averages well above tradables inflation (for various reasons) and so can’t meaningfully be compared with the CPI inflation target midpoint, although some people –  including some who should know better –  do so.  Here is the chart of that inflation series.

nt-ex-govt-charges-and-tobacco-oct-2016

To be consistent with overall CPI inflation of around 2 per cent, this series would have to be inflating at somewhere nearer 3 per cent per annum.  But this inflation rate has picked up quite a bit, and quite steadily over the last year or so.  That should be a slight cautionary note when considering what should be done with the OCR from here, but it is worth noting that this series also picked up quite a bit in 2013 and that proved to be a false signal.

Like the Reserve Bank, I do think the OCR should be cut further, and I expect it will be cut.  But I might be a little more cautious now than perhaps I would have been at the start of the year about just how large future cuts might desirably be.

Of course, in part that depends on one’s sense of the strength of the economy.   The global picture looks no rosier, and although dairy prices have picked up somewhat, other impulses must be waning.  Growth in tourist arrivals seems to be slowing, as does the sharp growth in foreign student numbers (and the residence approvals programme numbers have been cut a bit).  The Christchurch rebuild impulse is well past its peak, and I don’t see much reason for optimism about a renewed surge in other private domestic construction.  Then again, interest rates work with a lag, and although real interest rates are still higher than they were say three years ago, they are lower than they were 12 to 18 months ago.  And between new prisons (another non-tradables shock tending to boost the real exchange rate) and other government capital expenditure to catch up with the unexpectedly rapid growth in the population, there probably isn’t much reason to expect the modest per capita growth over the last couple of years to slow that much in the next year.

As I’ve said before, however, forecasting is a bit of a mug’s game.  For me, two considerations still tilt me to favouring at least another 50 basis points of cuts:

  1. The unemployment rate is still lingering well above official estimates of the NAIRU, and that is something monetary policy can do something about, and
  2. Because we will go into the next recession (whenever it is, although history would suggest some time in the next five years) with much less ability to cut the OCR than we have had in past recessions, in the current climate if monetary policy errs at all it should be erring towards delivering inflation outcomes perhaps a little above target (even if still “near 2 per cent”) rather than quite a way below target as in recent years.  Inflation expectations for the next few years quite a bit higher than we have now would be a positively desirable outcome.    The Bank doesn’t really have a mandate to target expectations much above 2 per cent, but if it is going to err –  as it has, quite materially, in recent years – better now to err on the high side.

And for all the rhetoric from the government and their cheerleaders, it is not as if the economy has been doing that well.  Non-existent productivity growth and no better than middling per capita GDP growth aren’t signs suggesting we should just ignore low inflation and bask in our “economic success”.


Rethinking immigration policy: the Greens

The Green Party has been rethinking its approach to immigration.

Not that long ago, the Green Party seemed to be pretty stridently in favour of New Zealand’s large scale, fairly liberal, immigration policy.  It was never entirely clear to me why.  They were the party that emphasized the potential environmental damage from more intensive dairy farming, and were usually reluctant to support new infrastructure projects, partly on environmental grounds.  And yet ever more people pretty inevitably means a need for more exports (in a country that has shown little ability to develop large scale exports much beyond the fixed natural resource base) and more infrastructure.  And globally, radical Green supporters are sometimes heard to call for population policies, potentially penalizing people having the number of children they might prefer, all in the “interests of the planet”.  So I was never sure quite why the New Zealand Green Party was so keen on large scale inward migration, when the combination of (shrinking) natural increase and the typical outflow of New Zealanders would have delivered us a fairly flat population if only we’d had a more modest, and internationally conventional, target level of non-citizen immigration.  The only arguments one ever heard were along the lines of “diversity is good”, but then New Zealand is already one of the most ethnically diverse countries in the world, and without a great deal of economic success to show for that very rapid diversification over the last few decades.  Perhaps they just wanted to share the bounty of New Zealand with as many people from other countries as they could?  Perhaps they really didn’t like New Zealand, and New Zealand culture as it was, and had an agenda for breaking that down?

But now the Green Party has had a rethink.   Trying to understand the change, and its implications, I listened to James Shaw on The Nation, and read a couple of substantive articles (here and here) with quotes from Shaw.

If I read the policy correctly, it is to set a target for New Zealand’s population growth of 1 per cent per annum, and to adjust immigration policy settings (each year, or even more frequently?) in light of changes in the rate of natural increase and in the net outflow of New Zealand citizens.  On the Greens’ own calculations that would have meant a targeted net inflow of around 17000 to 20000 this year.    That is not an order of magnitude different from the medium-term target rate of residence approvals I have argued for, of around 10000 to 15000 per annum.

Perhaps it is good short-term politics, but as policy it doesn’t look as though it has been particularly well thought through.

Rates of natural increase don’t change that much from year to year, and although there can be big movements in that series over time there is quite a lot of persistence in the changes (eg the post-war increase in the birth rate last for almost two decades).  But the net flows (usually outflows) of New Zealanders are very volatile, and very difficult to forecast.  Here is the chart of actual net flows of New Zealand citizens.

plt-nzers

Fluctuations of 30000 per annum in just a couple of years aren’t uncommon, and if one had access to (say) all the Reserve Bank and Treasury forecasts the near-impossibility of accurately forecasting those fluctuations would be quite apparent.

Perhaps the response would be “oh, we wouldn’t rely on forecasts, but on actual data”.  But then there would be a serious risk of actually exacerbating overall cycles in net migration.  If the net outflow of New Zealanders had been large in the last six months, perhaps the target for immigration approvals for non-New Zealanders would be increased.  But people (especially able and skilled people) don’t just shift to the other side of the world on a whim, or with no notice.  There are some quite material lags in the system, and by the time the increased number of non-New Zealanders starting actually arriving, it is quite plausible that the net outflow of New Zealanders might have shrunk again.  I don’t agree with MBIE about much, but on this point I agree with them totally: it simply isn’t possible to target successfully the overall net PLT flow (or, hence, population growth) on an annual basis.

Defenders of Shaw might argue that these points don’t matter much and what really matters is the average population increase over time.  But that wasn’t his argument: he explicitly cited concerns  around the extreme peaks in the net PLT series, over the sort we have seen in the last couple of years.

The whole idea here is to try and smooth out the peaks and troughs,” Shaw said

And if one is going to have an official population growth target –  as the Greens appear to be proposing –  why would one set it at 1 per cent per annum?   This chart shows population growth rates for high income countries (UN definitions and data) and New Zealand since 1950.

population-growth-world-and-nz

It has been 50 years since the high income group of countries (including immigrant receiving countries such as the United States, Canada, Australia, and New Zealand) had a population growth rate as high as 1 per cent.  At present, that growth rate is less than 0.5 per cent per annum.   And whether or not one welcomes the population growth New Zealand has experienced over the decades, there is no sign –  no evidence –  that it has produced any economic benefits for us at all.  If people choose to have lots of children that is one thing, but why would Shaw want our government to actively target above-normal (for high income countries) population growth?

But more generally, what is the case for a population growth target?  I can think of a few cases where perhaps one might make the argument: Israel, surrounded by hostile neighbours, probably wants as large as Jewish population as possible for external defence reasons.  They used to mount similar arguments in France a hundred years ago, as they contemplated how few young Frenchman there were relative to the number of young Germans.  But those sorts of arguments are just not relevant for New Zealand (or most other advanced countries).

Apart from anything else, it sets up all sorts of odd incentives and undesirable behavioural responses (although not necessarily much dafter than how New Zealand has actually run policy over the decades).  When economic circumstances change, people tend to leave underperforming regions.  That is rational and sensible for them and –  on the whole –  it even helps those who don’t leave. Patea and Taihape were once quite a lot larger than they are today.  Circumstances and opportunities changed and people over time moved away.  It would simply be daft policy for, say, local authorities in those areas to subsidise people to move in from elsewhere, even though the economic opportunities had moved away.

Under the Greens policy, if there is a significant upsurge in the number of New Zealanders leaving –  as, say, happened in the second half of the 1970s –  policy will, semi-automatically set out to replace them. The New Zealanders will have gone because, presumably, knowing New Zealand conditions well, they conclude that the opportunities abroad are better for them and their kids.  And in response the Greens want us to dig even further towards the bottom of the international barrel and find even more non-citizens to come and live here.  How likely is it that that would be a sensible policy?  Not very.  First, actual economic conditions and prospects in New Zealand have deteriorated, suggesting that New Zealand is less able than it was to offer real good incomes to able people.  And, second, to get a whole lot more immigrants, we would presumably have to lower the (economic) quality of those we take –  and perhaps quite a bit if the foreigners themselves do enough research to realise that relative opportunities here are also deteriorating.  It is not as if, on the government’s own evidence, we’ve been that successful in getting many very able people under current policy.

Of course, one could turn the story around, and be more optimistic.  If New Zealand’s prospects improved and suddenly many fewer New Zealanders were leaving, we would have to markedly reduce the non-citizen immigration inflow.  One could argue this as a good thing, in that we could raise the average economic quality of those we approve, but if one really believes in the economic benefits of immigration, why would you want to materially cut back the flow in circumstances in which New Zealand’s relative economic prospects appeared to have improved?

The arguments can also be applied to fertility rates and, thus, rates of natural increase.  If birth rates in New Zealand fell away sharply (to the sorts of rates –  around one child per woman – seen in many parts of developed Asia and some parts of Europe), what would the economic logic be of central government setting out to raise the target migrant intake (lowering the average migrant quality) just because New Zealand families decided to have fewer children?   After all, fertility choices might be partly a response to perceived economic prospects.   What sensible role for central planners is there in face of such fertility rate changes?

Turning back to the Greens, it isn’t clear that they have yet given much thought to how their proposal would work.

He did not give specifics on exactly which parts of the migration mix would be tweaked to achieve the 1% population growth, given the Government now has a planning range for permanent residency of 85,000 to 95,000 for the next two years, but does not have targets or caps for temporary work visas or student visas. Last week it temporarily suspended parental visa applications and lowered the planning range by 5,000. It is also reviewing work testing for work visas and student visa numbers.

A variable migration target implies constant tweaking of targets for permanent residency visas, both for skilled migrants and their families, along with targets for temporary work visas and student visas. Some elements cannot be controlled, including net migration of New Zealand citizens and working holidaymaker visas, given New Zealand has bilateral agreements with many countries that allow unfettered movements of such visas.

Shaw suggested student visas as one area that could be changed.

“We think that the government is actually barking up the wrong tree by putting the pressure on the family category,” he said.

“There’s huge numbers of students that are coming into New Zealand on temporary work visas and that’s actually where a lot of the pressure is coming from, especially on housing and on transport infrastructure.”

I think there is a lot wrong with our student visa policy, and with the liberality with which work visas are granted for fairly lowly-skilled positions, but……you can’t sensibly go making major changes to the parameters of the schemes every few months just because the forecast net outflow of New Zealanders has changed again.  It would put educational institutions in an impossible position, put firms considering hiring migrant workers in a very difficult position, and make the rules of the game so uncertain for potential migrants that you would risk undermining whatever merit the immigration programme has.  Even more than happens now, good people would seek out other countries with more stable and predictable regimes, and we’d be left with the fruit of an adverse selection process –  those sufficiently desperate to get in here that they’d apply despite the variability of New Zealand policy.   And while it is fine to talk about “smoothing out peaks and troughs” many of those pressure arise in specific regions, and it is even harder to practically manage those.  After all, New Zealanders tend to leave for Australia from across the whole country, while non-citizen arrivals (be it permanent or students) tend to disproportionately flock to Auckland.   So even if policy could be run to stabilize the overall rate of population growth from year to year –  and it can’t –  it might well markedly increase the variability of population cycles in Auckland specifically.  That doesn’t seem like an outcome the Greens would be wanting.

My own view remains that we should aim for a stable level of non-citizen (net) immigration, and set the stable target around a low level (consistent with the absence of any real evidence of benefits to New Zealanders as a whole).  But even a stable fairly high level of non-citizen immigration might be less bad in some respects than what the Greens are proposing, which assumes a degree of knowledge, and forecastability, that simply doesn’t exist.

I would keep the focus on the residence programme, and in turn keep that focused on the medium term.  If we are offering long-term residence in New Zealand, it shouldn’t be about meeting today’s immediate labour market needs, but about attracting a small group of young able energetic innovative people, who might make a useful contribution over their entire working lives.  I think we should welcome foreign students –  education should be just another export industry –  but without providing them with work rights here, and with only high level qualifications giving them a leg up on the path to residency.   And, as I noted the other day, for short-term work visas, I’d probably favour a salary test.  In all but very exceptional circumstances, simply don’t issue work visas for positions paying less than, say, $100000 per annum, and above that threshold take a fairly liberal approach.  Any employer could hire someone for up to, say, three years, but on a non-renewable visa.  If there are real temporary skills shortages arising from unexpected shifts in demand, such a policy will meet those needs, while over the longer term allowing the domestic labour market to work, as relative wage rates shift and people move from one occupation to another.  The scheme would be used, but there wouldn’t be 200000 approvals per annum.

In a sense the fatal conceit in the Greens new policy is the idea that New Zealand’s population growth rate can be held stable from year to year.  While New Zealanders are fairly free to move –  or not –  to the much larger Australian economy in response to changes in relative economic opportunities –  and while New Zealand incomes are so much lower than those in Australia –  we will almost inevitably have the sorts of swings in the net outflow of citizens I showed in the first chart above.  Trying to manage the inflow of non-New Zealanders year by year to offset those fluctuations would be (a) impossible, and (b) something of a fool’s errand even to try.   Whatever immigration policy we adopt, we really need to focus on the medium-term, in all dimensions.