Sometimes ill health does strange things. I’ve been quite unwell for the last couple of months (slowly getting back to normal now) and in that time my interest in current monetary policy and the monetary policy words/actions of the Reserve Bank dropped right away (displaced, according to my book list, by copious Trollope novels and books of early 20th century history). I didn’t write a post about the last OCR review, and it is more than eight weeks since I last wrote a post about current monetary policy issues at all.
In the grand scheme of things, monetary policy just isn’t that important. Bad monetary policy won’t impoverish us, and the best monetary policy possible won’t make any material difference in reversing our decades of economic underperformance. But the same is true of lots of things, and monetary policy is one of the things I know. And over shorter-term horizons it makes more difference to the fortunes of individuals (and firms) than many other things government agencies do.
The Reserve Bank is charged with keeping annual CPI inflation “near” 2 per cent on average. Monetary policy takes time to work, and there are all sorts of “one-offs” that muddy the water, so no one would ever expect out-turns averaging bang on 2 per cent, except by chance. The Policy Targets Agreement talks about “near”, and outlines various reasons why actual inflation might appropriate deviate from the target. One of the salient ones is the direct impact of government taxes and charges: when the government raises tobacco taxes or cuts ACC levies, those aren’t things you hold monetary policy to account for, or expect monetary policy to try to offset. Any other approach would deliver daft results.
So how do things stand on inflation now, four years into the Governor’s term?
Here is headline CPI inflation, the focus of the Policy Targets Agreement.

The 2 per cent focal point has only featured in the Policy Targets Agreement since the end of September 2012 (although prior to that 2 per cent was also the (unstated and unfocused on) midpoint of the target range).
The Governor has often rightly called our attention to the role falling global oil prices have played in dampening headline inflation. The CPI ex petrol series somewhat overstates the contribution of falling oil prices, because exchange rate pass-through into domestic prices is pretty full and immediate for oil/petrol, and the Governor’s monetary policy choices are one of the things that has held up the exchange rate. But setting that caveat to one side for the moment, here is the CPI ex petrol series.

Inflation on that measure is not only well away from the 2 per cent focus, but it is below the bottom of the 1 to 3 per cent target range. And doesn’t really look to be picking up much, unless perhaps you put a great deal of weight on the one particularly low annual number at the end of last year.
What of the various other core measures? At times, the Governor has put a very heavy weight on the Bank’s sectoral core factor model measure of inflation. It has shown some signs of having turned a corner, and started picking up. Unfortunately, the way that measure is calculated leaves it prone to quite significant revisions as new data are added (if I recall rightly, back in 2011, the real-time estimates suggested core inflation was above 2 per cent).

In this chart, I’ve just shown the estimates for the sectoral core measure a year ago, and those now. In that time, new data have led to past estimates of the sectoral core inflation rate being revised further down (ie the trough was worse than the Bank realized). And the current estimate of 1.5 per cent is slightly lower than the 1.6 per cent being reported only a few months ago.
There is no perfect measure of core inflation – empirically, or perhaps even conceptually. And the measures the Bank and SNZ report show quite a range of numbers.
| Annual inflation year to September 2016 | |
| Weighted median | 1.7 |
| Sectoral factor model | 1.5 |
| Factor model | 1.3 |
| CPI ex food and energy | 1.1 |
| CPI ex petrol | 0.8 |
| Trimmed mean | 0.7 |
The median of those estimates is 1.2 per cent.
We are approaching the next Reserve Bank Monetary Policy Statement. As everyone is aware the Reserve Bank has cut the OCR quite a long way over the last 16 months, and has indicated that its projections suggest further cuts will be needed to ensure that inflation settles back near 2 per cent.
Only two years ago, in its December 2014 Monetary Policy Statement, the Governor indicated that he expected further increases in the OCR, from the then level of 3.5 per cent. They soon realized that was a mistake. But here are those core measures for the year to September 2014 (the latest CPI data in December 2014) and for the most recent year.
| Annual inflation year to September | ||
| 2014 | 2016 | |
| Weighted median | 1.7 | 1.7 |
| Sectoral factor model | 1.3 | 1.5 |
| Factor model | 1.4 | 1.3 |
| CPI ex food and energy | 1.4 | 1.1 |
| CPI ex petrol | 1.2 | 0.8 |
| Trimmed mean | 1 | 0.7 |
On only one of those six measures is core inflation any higher now than it was then, although in all cases there were lower numbers at some point between then and now. The cuts in the OCR – reversing the unwarranted 2014 increases – may have helped stem the decline in core inflation, but haven’t yet done much to get it back to near 2 per cent.
Perhaps there are still further increases in core inflation in the pipeline? But recall that the largest cuts in the OCR were concentrated in 2015 – 100 basis points of cuts between the June and December 2015 MPSs. Not all the effects of those cuts will yet have been felt, but the effects are likely to start waning fairly soon. This year so far we’ve had 50 basis points of OCR cuts, some of which simply offset the impact of falling inflation expectations. And the exchange rate has been rising this year.
As I noted earlier, when governments raise indirect taxes (eg on tobacco) or cut government levies (eg the ACC component of vehicle registration fees) one really wants to look through such effects. Unfortunately, SNZ does not publish a series for the CPI excluding taxes and government charges – and I would urge them to consider doing so – but they do publish a series of non-tradable inflation excluding government charges and the cigarette and tobacco subgroup. At present, those two exclusions capture the tobacco tax and ACC effects. Non-tradables inflation typically averages well above tradables inflation (for various reasons) and so can’t meaningfully be compared with the CPI inflation target midpoint, although some people – including some who should know better – do so. Here is the chart of that inflation series.
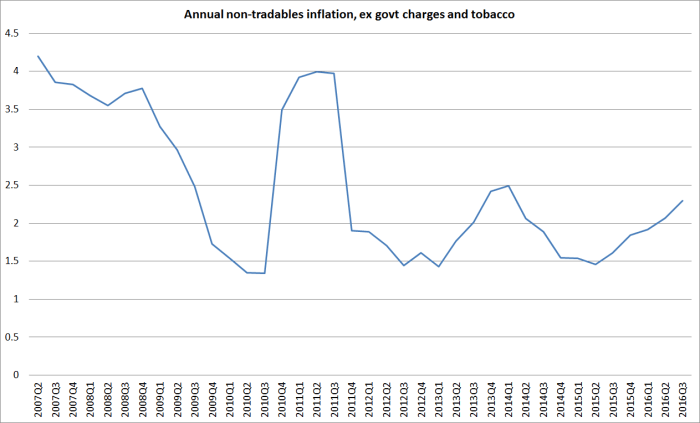
To be consistent with overall CPI inflation of around 2 per cent, this series would have to be inflating at somewhere nearer 3 per cent per annum. But this inflation rate has picked up quite a bit, and quite steadily over the last year or so. That should be a slight cautionary note when considering what should be done with the OCR from here, but it is worth noting that this series also picked up quite a bit in 2013 and that proved to be a false signal.
Like the Reserve Bank, I do think the OCR should be cut further, and I expect it will be cut. But I might be a little more cautious now than perhaps I would have been at the start of the year about just how large future cuts might desirably be.
Of course, in part that depends on one’s sense of the strength of the economy. The global picture looks no rosier, and although dairy prices have picked up somewhat, other impulses must be waning. Growth in tourist arrivals seems to be slowing, as does the sharp growth in foreign student numbers (and the residence approvals programme numbers have been cut a bit). The Christchurch rebuild impulse is well past its peak, and I don’t see much reason for optimism about a renewed surge in other private domestic construction. Then again, interest rates work with a lag, and although real interest rates are still higher than they were say three years ago, they are lower than they were 12 to 18 months ago. And between new prisons (another non-tradables shock tending to boost the real exchange rate) and other government capital expenditure to catch up with the unexpectedly rapid growth in the population, there probably isn’t much reason to expect the modest per capita growth over the last couple of years to slow that much in the next year.
As I’ve said before, however, forecasting is a bit of a mug’s game. For me, two considerations still tilt me to favouring at least another 50 basis points of cuts:
- The unemployment rate is still lingering well above official estimates of the NAIRU, and that is something monetary policy can do something about, and
- Because we will go into the next recession (whenever it is, although history would suggest some time in the next five years) with much less ability to cut the OCR than we have had in past recessions, in the current climate if monetary policy errs at all it should be erring towards delivering inflation outcomes perhaps a little above target (even if still “near 2 per cent”) rather than quite a way below target as in recent years. Inflation expectations for the next few years quite a bit higher than we have now would be a positively desirable outcome. The Bank doesn’t really have a mandate to target expectations much above 2 per cent, but if it is going to err – as it has, quite materially, in recent years – better now to err on the high side.
And for all the rhetoric from the government and their cheerleaders, it is not as if the economy has been doing that well. Non-existent productivity growth and no better than middling per capita GDP growth aren’t signs suggesting we should just ignore low inflation and bask in our “economic success”.
