Monetary policy and the exchange rate

The Herald‘s Claire Trevett was perhaps being just a trifle unfair yesterday in commenting on the Reserve Bank’s “consultative” document on the latest iteration of the increasingly unpredictable LVR restrictions

The Reserve Bank’s definition of “consulting” appears to be akin to North Korean President Kim Jong Un’s

The Governor on the exchange rate tends to bring to mind parallels with the (misremembered) story of King Canute.   Canute was trying to deliberately demonstrate to his courtiers how little command he actually had –  none over the tide and the seas.  But the Governor loftily –  or perhaps plaintively – decrees that “a decline in the exchange rate is needed”, and the market really doesn’t pay that much attention.  The exchange rate did fall a bit yesterday, and has pulled back some way over the last 10 days or so, but the exchange rate today is perhaps only a couple of per cent lower than the average over his whole term to date.  For almost his entire term, he has been lamenting the strength of the exchange rate.

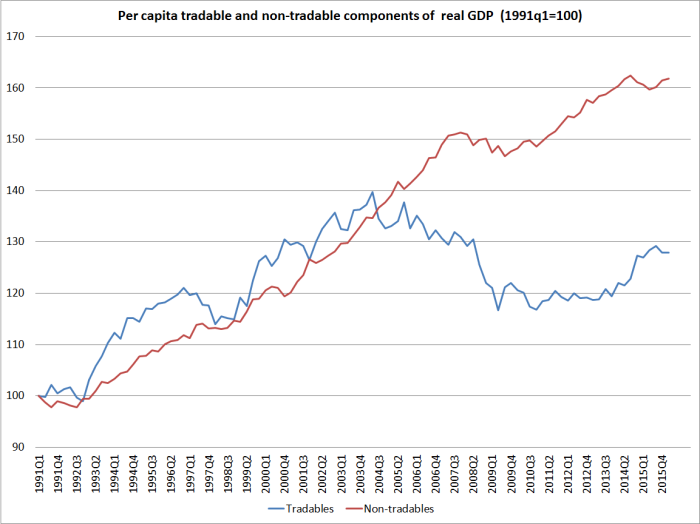
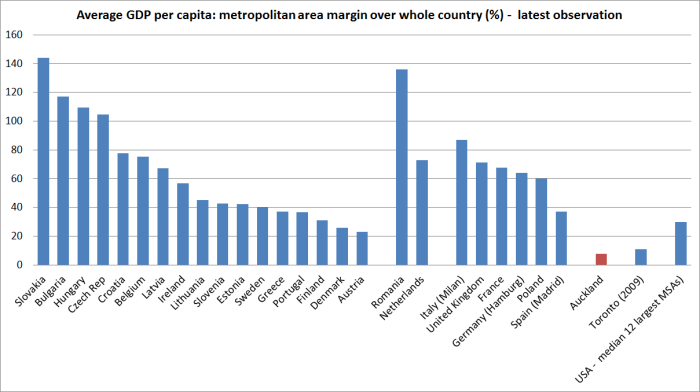
I’ve noted previously that I entirely agree with the Governor that a successful transformation of the New Zealand economy’s growth prospects is likely to require a sustained and substantial fall in New Zealand’s real exchange rate –  a substantial fall in the prices of non-tradables relative to the prices of tradables.  But nothing the Reserve Bank does, or could do, has anything much to do with bringing about that sort of change.  It isn’t some fault or failing of financial markets either.  Rather, responsibility for the persistent pressures on domestic resources that have given us a real exchange rate persistently out of line with our deteriorating relative productivity performance rests squarely in the Beehive.  The choices successive governments make –  and both major parties still defend – explain the bulk of our underperformance.   Here is a chart I ran a few weeks ago.  If anything, I suspect – but of course can’t prove formally –  that we need the exchange rate to fluctuate below that 1984 to 2003 average for a decade or two, not the 20 per cent above that average we’ve had for the last decade and more.

real exch rate

But in the shorter-term (perhaps even periods of several years) monetary policy choices make a difference.  Sometimes quite a large difference indeed.  Notice the big fall in the exchange rate following the 1990s boom.  The TWI briefly fell almost as low, in real terms, as it reached following the 1984 devaluation –  and for the economic elite in 1984/85, one of the big challenges then was felt to be “cementing in” that lower level of the real exchange rate.

During this period around the turn of the century, the NZD/USD exchange rate was below .5000 for almost three years.  At the trough in late 2000 it was around .3900.   What else was going on?

In New Zealand, it was the first year of the new Labour-Alliance government, and the business community did not like the policies, or attitudes, of that government one little bit.  I was head of the Reserve Bank’s Financial Markets Department at the time, and used to go along to Board meetings each month.  One particularly prominent and vocal member constantly wanted to get me to say that the weak exchange rate was all a market judgement on the new government.  I usually pushed back quite strongly.

And here is why.

int rates us and nz

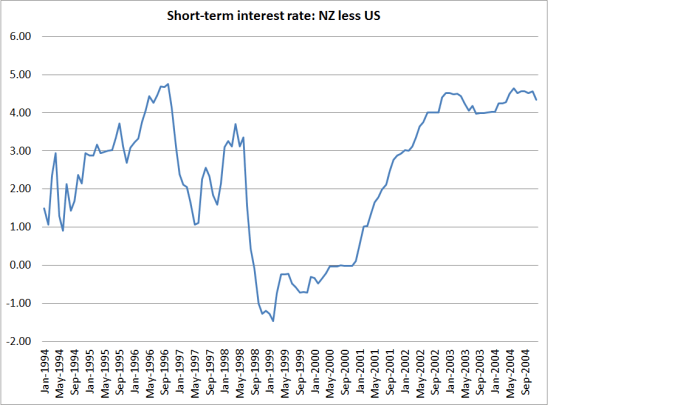
This chart uses OECD short-term interest rate data for 1994 to 2004.  During that period from mid-late 1998 to the start of 2001, New Zealand short-term interest rates were at or below the level in the United States.  It is the only time in the whole post-liberalization period when that has been so.  The respective central banks judged that that was where their own interest rates needed to be to keep inflation at or near target (a formal target in the New Zealand case, and an informal target back then in the US).

It isn’t a mechanical relationship by any means.  Apart from anything else, expected interest rates tend to matter at least as much as actual short-term rates –  ie the expected future path of policy.  And other expected returns mattered too.  Even after the NASDAQ had peaked in early 2000, there was still an important theme around markets of “new economies” (with the tech boom) and old economies.  The NZD and AUD –  not seen as currecies of high tech “new economies” – were very weak in response.

The Governor can’t change the structural fundamentals that influence savings and investment preferences in New Zealand.  But he has our OCR in his personal control.  If he were to cut the OCR to 1.5 per cent, there would still be quite a large margin over US interest rates –  unlike the situation in 1999 and 2000 –  but that gap would be quite materially narrower than it is now.  Perhaps the OCR might even be able to go below 1.5 per cent –  after all, it is not as if the resulting margins to world interest rates would be unprecedented –  but we’d have to see how the data unfolded.

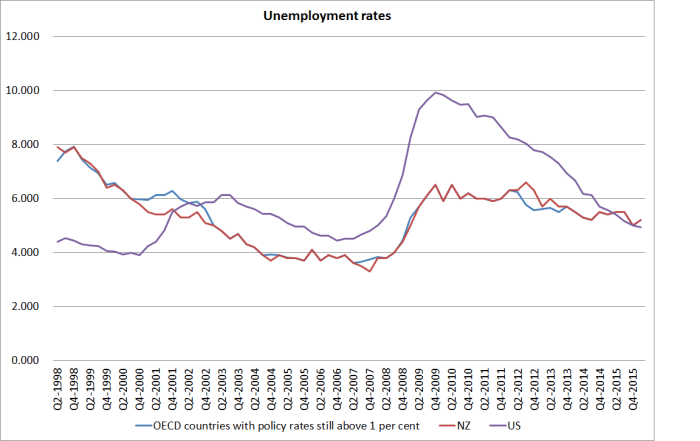
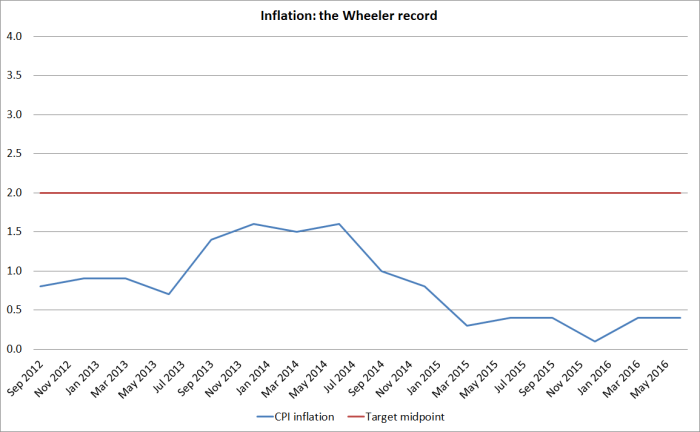
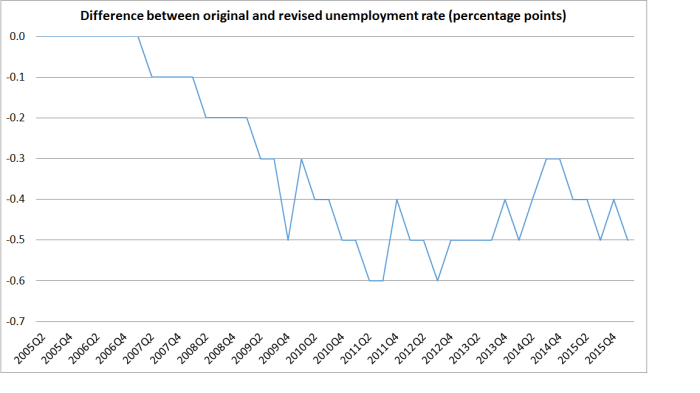
The Governor can’t just set the OCR on a whim.  Instead he is required to deliver on an inflation target.  But we know that New Zealand’s inflation rate has been persistently very low relative to the target the government set for the Bank.   Among the OECD countries where the central bank still has some material monetary policy discretion –  say, a policy interest rate still above 1 per cent –  our inflation rate has also been falling away relative to the median in those other advanced economies (a sample which includes Australia).  Inflation just isn’t a constraint at present –  if anything, it is the absence of enough inflation that is the problem.  And is the economy under mounting pressure?  Well, by contrast with the United States where the unemployment rate is almost right back  to where it was prior to the recession, in New Zealand –  even on the latest SNZ revisions –  (and in the median of those other higher interest rate OECD countries) the unemployment rate is almost 2 percentage points higher than it was prior to the recession.

U rates us and nz

There is simply no sign that the real economy could not cope with materially lower policy interest rates – if anything, the evidence is pretty clear that it could do with the boost (or rather with the inappropriately restraining hand of the Reserve Bank being eased up).

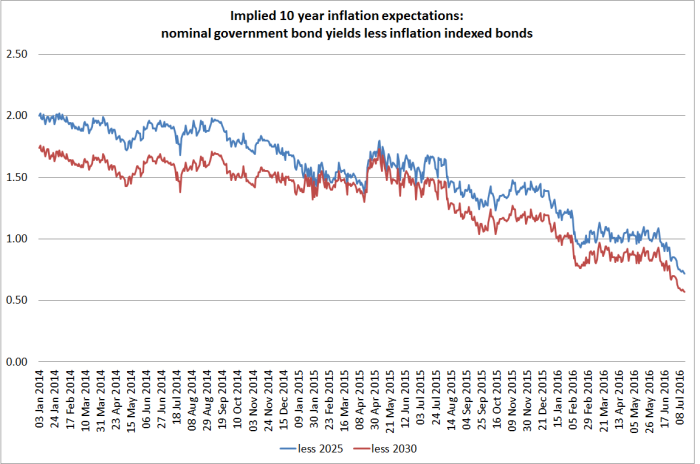
The gap between New Zealand and US long-term interest rates has “collapsed” in recent months –  the gap between 10 year nominal bond rates is now only around 65 basis points.  That suggests that markets actually think quite a bit of policy rate convergence is coming. But they can’t be sure when, as the Governor remains so reluctant to cut the OCR and has been prone to inconsistent communications.  The economic case for a 50 basis point OCR cut next month, foreshadowing further cuts to come, is reasonably strong. I don’t expect the Governor to adopt that policy, but if he is serious about getting monetary policy out of the way of the exchange rate  adjustment he seeks, it is exactly the policy he should adopt.

No doubt, some at the Reserve Bank will continue to cite their estimates of neutral interest rates being around 4 per cent –  as the Assistant Governor apparently recently told FEC.  If you asked me where I though global real interest rates would converge back to over the next 20 years, I too might talk in terms of a 2 per cent real interest rate (so with inflation targets centred on 2 per cent, perhaps something around 4 per cent).  But that is simply not a meaningful basis for making monetary policy today.  We don’t know where “neutral” interest rates are now, but most of the external evidence suggests monetary policy isn’t particularly accommodative at all – rather it has sluggishly adjusted towards whatever has changed in the real economy.  In New Zealand’s case, that failure to adopt a practically accommodative policy is holding the exchange rate higher than it needs to be –  higher than the Governor himself would like.  To that extent, the solution is in his hands.


The Reserve Bank’s update

I don’t have a great deal to say about the Reserve Bank’s statement this morning, which seemed to conform to my interpretation of the Governor’s “reaction function” over the last 12-18 months.  He really doesn’t want to cut interest rates at all –  after all, he keeps stressing just how “accommodative” monetary policy already is –  but he cares enough about the inflation target that if there is a heightened risk that inflation might stay below 1 per cent for too long then he will, reluctantly, act.

On process, I think the fact of today’s statement helps illustrate why the recent change in the Bank’s OCR announcements timetable is not particularly helpful.  On the old timetable, there would have been an OCR announcement itself this week or next.  Even though it is only now three weeks until the next MPS the Governor clearly felt things were important enough that he needed to make a signal now, rather than waiting until they had gone through the full forecasting process.

There has been a two month gap between the June and August MPSs.  But look ahead to the release calendar, and there is a three month gap between the November MPS and the February 2017 MPS, with no OCR reviews scheduled over that period.  Yes, we all know that New Zealand shuts down for a few weeks from late December to mid January, but a great deal can happen in three months at any time of the year.  Data keep on being published locally, commodity prices and exchange rate change daily, and the economies of the rest of the world keep on as normal.  Two months is often going to be too long between OCR reviews, but three months will usually be too long –  whether the Bank is in a tightening or an easing cycle.  It risks jerky OCR adjustments and miscommunications and misunderstandings (of which there have been more than enough recently anyway).

It was also a shame that the Bank chose to release its update this particular morning.  The Bank’s survey of expectations is an important input into the monetary policy process,  and especially the measures of medium-term inflation expectations.  But that survey was being taken yesterday and today, meaning that some respondents will have answered before the Governor’s statement and some after it.  That will, to some extent at least, muddy the waters when the expectations survey data are released on 2 August.

In terms of substance, I guess we should be thankful for small mercies.  The Bank is explicitly recognizing that it is getting harder to meet its inflation objective –  a target it has failed to achieve for years now.  But I remain rather uneasy about the heavy focus on the  exchange rate, and on tradables inflation.  Perhaps there is a little more reason than usual to focus on headline inflation –  and the impact of short-term fluctuations in tradables prices –  given that inflation has been so far below target for so long.  There is a real danger that people are coming to think of something around 1 per cent as a normal rate of inflation, not the 2 per cent the Bank has been mandated to focus on.  But in general, central banks are better advised to focus on core pressures on domestic non-tradables inflation –  something the Bank itself has often highlighted in the past.  Nothing of those sorts of ideas is apparent in today’s statement at all.  If anything, the Bank continues to assert that capacity pressures are ‘rising’ –  on what measures, or supported by what indicators, they don’t say.  And for all their apparently growing unease about the rest of the world they seem reasonably upbeat on domestic economic activity – even though there has been very little per capita GDP growth at all in the last year.

With trends in the underlying measures of inflation so low, I think OCR cuts are clearly warranted –  and have argued since mid last year that something nearer 1.5 per cent was warranted –  but the Bank’s continued reliance on headline inflation arguments suggests that they still “don’t really get it”.    The core trend in inflation remains too low to be consistent with the Bank’s target (and, not incidentally, the unemployment rate suggests ongoing excess capacity).  There has been some sign of stabilization in core inflation measures, and perhaps even a very slight increase, since the Bank finally realised it needed to be cutting rates not raising them, but there is a long way still to go.  And that would be so even if the TWI was at 72.     As a reminder, despite the persistently weak inflation rate –  surprising the Bank more than anyone –  the real level of the OCR is still no lower (and most likely actually higher) than it was two or three years ago before the Bank started its ill-judged and unnecessary tightening cycle.  New Zealand interest rates are typically well above those in the United States, but there is nothing in the relative cyclical performance of the two economies suggesting we need an OCR even 175 points above the US policy rate.

Of course, there is an alternative perspective.  In the Dominion-Post this morning, Pattrick Smellie asserts that “it’s not the Reserve Bank’s fault that monetary policy as we knew it is broken”.  He argues “how realistic is it to think that cutting rates further will revive domestic inflation when we’re importing the absence of inflation from the rest of the world?”  There are certainly some common global factors at work, but we need to recall that (a) most advanced countries have exhausted conventional monetary policy capacity, while we haven’t, and (b) New Zealand has had an inflation rate that has been undershooting the target by more than in the case in many –  not all –  other advanced economies (eg Australia, the US, or Norway).  It isn’t a case that the monetary policy model is broken in New Zealand, so much as that the Reserve Bank Governor has been reluctant to give it a try –  reluctant, that is, to do his job.  Put the OCR quickly to, say, 1.5 per cent and –  absent a big new adverse global shock –  I think we can be reasonably confident that future inflation would be tracking much closer to 2 per cent than seems likely (even to the Reserve Bank) on current policy.

As a reminder, here is the New Zealand (headline) inflation outcomes over the current Governor’s term.

wheeler inflation

On current reckonings there is little chance of headline inflation even getting briefly to the target midpoint at any time in the Governor’s five year term.  Not a record to be proud of, especially as the Governor himself championed the case for a focus on the midpoint.


It is good to know there is diversity of views at ANZ

The Australian head of ANZ’s New Zealand business, David Hisco, was out last night with an article in the Herald headed Housing and New Zealand dollar overcooked.

Hisco is gung-ho on LVR limits.  Here are two of his list of “things that should be done”.

Heavily increase LVR limits for property investors. The Reserve Bank wants most property investors around the country to have 40 percent deposits in future. We think they should go harder and ask for 60 percent. Almost half of house sales in Auckland are to property investors. Taking them out of the market will be unpopular amongst investors but it may end up doing them a favour. Of course this would mean less business for us banks but right now the solution calls for everyone to adjust.

Voluntary tightening of lending criteria by banks. Since the GFC banks have been more conservative than ever on lending. But the current situation will see ANZ implement even tougher criteria for investment loans as house price inflation spreads from Auckland to other regions.

I have no problem at all if the management and Board of ANZ Bank want to adopt tighter lending standards.  They run a private business, in a competitive market, and must make their own choices about what risks are worth it, for their shareholders, to run.  Bureaucrats and politicians are fond of second-guessing those choices, and we all know that banks have made mistakes in the past –  as businesses in all sectors do –  but there is rarely much basis offered by the bureaucrats and politicians for thinking their assessments of what risks private lenders should run are better than those of the bankers.  Actually, Australasian bankers have had a pretty good record over many decades –  and when things did go wrong in the late 1980s, it had as much to do with bureaucrats and politicians as with bankers: repress an industry for decades by regulatory fiat, and inevitably it will take everyone a while to learn how to lend (and borrow) well in a much different environment.

It is the first of those paragraphs above that I have a problem with.  If Mr Hisco really thinks it would be imprudent –  they couldn’t make a positive expected risk-adjusted return from doing so –  to lend to anyone wanting to buy a potential rental property with an LVR over 40 per cent, he probably has the delegated authority to make that change himself.   Today.  He is paid a great deal of money by ANZ, and his board –  and superiors in Australia –  presumably think highly of his ability to manage the bank, including its credit risks   It simply doesn’t need a bunch of bureaucrats telling him to do his job.

But his paragraph seems stronger on the rhetorical flourishes than on the analysis.  After all, where have nationwide nominal house prices ever fallen by 60 per cent?  And even if they did fall 60 per cent –  or even more –  in Auckland to perhaps bring price to income ratios down to a more sensible 3 (rather than the current 10), such falls seem exceptionally unlikely in much of the rest of the country, where real house prices have barely changed in almost a decade.  Can bankers really not make money lending to landlords in Oamaru or Invercargill at LVRs of even 50 per cent?  If so, they must be a lot less good at their jobs than they would typically have us believe?  If so, one might reasonably hope for the emergence of new entrants to the new mortgage lending market – preferably non-bank lenders beyond the reach of the Reserve Bank’s controls.   One can always worry about extreme hypotheticals, but if one did no bank would ever lend money to anyone for anything –  which would rather defeat the point of setting up in business as a bank.

But I don’t suppose we will actually see ANZ move to ban all mortgages for residential investors with LVRs in excess of 40 per cent.  Instead, Hisco wants the Reserve Bank to do it for him.    That would enable him to tell his Board that he simply had no choice, and provide cover when profits fell below shareholder expectations.  That should be no way to run a business in a market economy –  although sadly too often it is.  It is good illustration of the distinction between pro-business and pro-market policies: the former too often involve politicians, bureaucrats and big business people in each other’s pockets, providing cover for actions that work against the interests of citizens.  We already see this  happening to some extent with the Reserve Bank and the banks: the Reserve Bank adamantly refuses to release submissions made by banks on its regulatory proposals.

If Hisco followed his own analysis and banned all investor mortages with LVRs above 40 per cent, no doubt ANZ would lose a lot of market share.  If Hisco was fundamentally right, and in another year or two house prices nationwide did fall 60 per cent, he’d be vindicated as presumably ANZ’s loan losses would be much lower than those of other banks who didn’t follow his lead (unless of course he’d taken the capital that would have funded investor mortgages and used it on something that proved even riskier, if currently less visible).  It is all very well to invoke the old Chuck Prince (ex Citi CEO) line about “while the music goes on one has to stay on the dance floor”.  But top executives are paid to be a bit ahead of the game in how they position their own businesses.  Of course, they aren’t always rewarded –  as often in life –  for being too far ahead, but nothing stops Hisco making his case to the Board and shareholders for pulling lending standards in even more than the Reserve Bank requires them to. If the shareholders decline, and in good conscience he cannot bring himself to undertake such lending, he could consider other career options.

As it happens, his own economics team doesn’t seem to agree with him.  Of course, they aren’t the people setting credit standards for the ANZ, but it was interesting to see their note on Tuesday shortly after the Reserve Bank had released its new proposals. It concluded.

To us, the case for requiring investors to have a 40% deposit is not overly
strong. This is particularly considering the RBNZ’s own stress tests and the fact that most investor lending was already done at sub-70 LVRs anyway.

There must be some interesting conversations going on at the ANZ.  It would be very interesting to see the ANZ submission on the Reserve Bank’s proposals, and if the Reserve Bank won’t release it, there is nothing to stop ANZ itself doing so.  I’ll be surprised if they do, and even more surprised if the submission recommends limiting all investors throughout the country to LVRs not in excess of 40 per cent.

Hisco seems to have some form as regards bold calls.  Digging around, I stumbled on this piece from October 2014, less than two years ago.  It was full of all sorts of calls for interventionist active government, but not a mention of LVR limits or bank lending standards.   Back then –  21 months ago, and not that much has changed since then –  it was all about supply.

The housing affordability issue is a housing supply issue, pure and simple. In 1974 there were 34,400 new homes built. Last year there were 15,000 – less than half. It’s no wonder houses doubled in price in under a decade in Auckland.

The solution is simple – urgently build more houses. To do that in places like Auckland we need to build more suburbs and allow intensification in existing areas.

In his latest piece, he hasn’t totally abandoned the supply arguments, but has rather markedly backtracked.  It doesn’t appear in his five point list of things we should do now, and there is just this

The Leader of the Opposition says we need to build more homes faster. That makes sense, too, if we have the resources and approvals to do it.

And yes I did notice his comments about immigration.   This is what he says about that item in his five point plan

Review immigration policies. Immigration has been great for New Zealand. We are a harmonious, diverse and inclusive society. But Auckland’s housing, roads, public transport and schools are struggling to cope. Let’s have an honest and sensible debate about immigration using facts rather than prejudice to see if we should push the pause button.

Debating using “facts rather than prejudice” seems a good idea in most areas of life, but his approach doesn’t really seem to offer much.    There is little evidence (“facts”) to suggest that immigration has been “great for New Zealand”, but on-off immigration policies seem about as undesirable as unpredictable regulation in any other area of life.


This is what good policy formulation looks like now?

I’ve now read the Reserve Bank’s consultation document on the latest iteration of their ever-extending, but highly unpredictable, LVR restrictions, and also the issue of the Bulletin they released yesterday Financial stability risks from housing market cycles.  Neither document seemed remotely convincing: just a series of the same old material, now twice-over lightly, that mostly doesn’t stand up to much scrutiny.  It was particularly striking that in the Governor’s mad rush to put yet more controls on banks and yet more potential borrowers, he never stops to reflect on any lessons from the fact that this is the third iteration (the Third Coming, as Gareth Vaughan puts it) of these controls in less than three years.  Does this not raise any questions in the Governor’s mind –  or those holding him to account –  about the Bank’s ability to set these sorts of controls effectively and provide a stable climate for private businesses and households?

But I’ve been tied up with other stuff today, and even on the Governor’s rushed timetable there are still a few days left to think harder about the Bank’s analysis.  (It is noteworthy that, despite the Bank’s commitment only a few months ago to longer consultative period, there is no attempt in the consultative documents to make a case for why action is so urgent that the new –  welcome –  standard is just tossed out the window.  Various critics suggest the Governor has bowed to political pressure, but I don’t believe that is the explanation).

So today I wanted to focus mostly, and quite briefly, on this table from the Bank’s consultative document.  As the Bank itself puts it, this table summarises the discussion “through the lens of a cost-benefit analysis”.

It looks like no cost-benefit analysis I’ve ever seen. I could commend to the Governor and his staff The Treasury’s guide to undertaking cost-benefit analysis.   Agencies simply cannot get away with calling a short list of possible costs and benefits, painted with the broadest possible brush and with not a number in sight, a cost-benefit “analysis”.  How could anyone look at a table like this and conclude with any confidence that what the Governor is proposing is in the national interest?  Perhaps he is right, but this table simply doesn’t show it.

Everyone knows there is a great deal of uncertainty about many of the possible costs and benefits, but one of the key arguments for disciplined  numerical cost-benefit analysis is that it forces agencies to write down numbers, make the case for those numbers, and illustrate the sensitivity of the resulting bottom line to a reasonable range of alternative assumptions.  Everyone knows bureaucrats and ministers game the system to help produce the outcomes they want, but the discipline of writing down the numbers is part of enabling others to scrutinize what is being proposed.  As a reminder, this is a consultative document –  a proposal for scrutiny and external comment –  and the Governor is legally required to have regard to submissions that are made. The law isn’t supposed to allow the Governor to simply rule by decree.

It is also striking that nowhere in the document, or anywhere in the cost-benefit so-called “analysis” is there any sense of the distributional implications of the proposed policy.  Who gains and who loses is often as important as the aggregate assessment of national costs and benefits? It isn’t clear that the Bank has given that any thought whatever.  That shouldn’t be good enough: Treasury, the Board, and  relevant parliamentary select committees should be questioning the Bank about the inadequacy of what it has rushed out yesterday.

What should be doubly disconcerting is that the Bank also shows no sign of having thought, in a disciplined way, about the distinction between private and social costs and benefits.  For example, take the very first “benefit”.    Loan losses are not a loss for the country as a whole, they are simply a redistribution of wealth among people within the economy.  Banks might be glad to have lower loan losses at some future date, but then banks –  private businesses accountable to their shareholders –  are able to adjust their lending practices themselves. Indeed recent evidence –  banks reining in, or cutting altogether, lending to offshore borrowers –  illustrates that they do just that.  What is that gives the Governor confidence that he is better able to make those judgements than the private businesses he is regulating?  We simply aren’t told –  even though this is his third attempt to get it right.

And why is a temporary reduction in house price inflation –  the second “benefit” –  a national gain.  Again, it redistributes gains/losses among players in the economy –  providing slightly cheaper entry levels in the near-term for those not directly affected by the controls, at the expense of those who are directly affected.   How do we value this alleged “gain”, especially if the fundamental distortions in the housing market –  yet more regulations –  aren’t changed.

I could go on.  There is, for example, no attempt to justify the proposition that it matters less if potential landlords are squeezed out of the market than if potential owner-occupiers are squeezed out.  And from a financial system efficiency perspective one could reasonably argue that an upsurge of non-bank lenders would  actually be a net gain, given that the controls are being put on at all.  But in any case, there is not a single number in sight.

These are highly intrusive controls, being imposed in a sweeping manner, and there simply isn’t much to underpin them.  Perhaps it won’t matter much to the Bank.  After all, the Prime Minister, the Labour Party Finance spokesperson, and even the former leader of the ACT Party seem to be in favour.   But citizens deserve much better quality policy formulation than what we have here.

I noted yesterday that it wasn’t clear quite why, even if one granted the need for some controls, we needed to effectively prohibit purchases of rental properties in places like Wanganui and Gisborne with LVRs above 60 per cent.  I half-hoped the consultative document might shed some light, but no.  Simply nothing.

As a reminder, real house prices in New Zealand as a whole are almost unchanged from the levels in 1987 –  and since those in Auckland are so much higher, those in the rest of the country  as a whole must be lower.

qv house prices since 2007 peak

We didn’t have a domestic financial crisis after 2007.  And I’m quite sure that anyone borrowing in those cities to the right of the chart, and anyone lending to them, is very conscious that house prices can go down as well as up.  The case for this regulatory imposition just isn’t made.

As ever, if the Bank is determined to rush ahead and do something more (perhaps on the  maxim that “something must be done by someone, and the Bank is ‘someone'”), the much less distortionary, and less knowledge-intensive, approach would be to increase capital requirements, either more generally or specifically on housing lending.  Doing so would provide bigger buffers, at minimal cost to banks and borrowers (since the financing structure shouldn’t materially affect the overall cost of capital).  The Governor talks complacently about longer-term reviews of capital requirements, but higher capital requirements could be imposed now.  I doubt there is a good economic case for doing so, but it is much less bad case than what we’ve been presented with in this latest consultative document.


Reserve Bank on housing – still all over the place

As I was writing this, the Reserve Bank’s latest set of regulatory interventions and controls were announced.  I haven’t yet read that document but from the press release I would make just three observations:

  1. The flip-flops continue.  After easing the LVR restrictions for non-investors outside Auckland last year, they now plan to totally reverse that change.  As a reminder, when these controls were first introduced three years ago, they were all supposed to be “temporary”.  So, I suppose, were the exchange controls, introduced in 1938 and lifted in 1984,
  2. The consultation process is a joke.  Not long ago, as part of their regulatory stocktake, the Bank indicated that it intended to put in place materially longer consultative periods for its proposed regulatory initiatives (typically six to ten weeks).  But in today’s announcement they are allowing only three weeks for submissions on the new “proposals” to be made, and then plan to implement the changes three weeks after that.  Only 10 days ago they were talking languidly of “a measure that could potentially be introduced by the end of the year”.   There is no real consultation going on, simply jumping through what they must regard as the bare minimum of legal hoops they must be seen to comply with.  And they will, no doubt, continue to refuse to publish most of the submissions.  It is, frankly, a travesty of democracy –  and the nature of what is going on is well-illustrated by the Governor’s statement that “We expect banks to observe the spirit of the new restrictions in the lead-up to the new policy taking effect.”  Citizens –  even banks –  are required to obey the law, not the wishes and whims of officials, elected or otherwise.   None will do so of course –  they are all too scared to challenge the Reserve Bank in public – but it would be interesting if a bank were to seek a judicial review of what is going on here.
  3. The policy remains as incoherent as ever, in that the LVR restrictions will not apply to loans for new house building, even though the risks of losses are materially higher on new buildings  –  often on the peripheries of towns/cities – than on existing ones.

I was away when Grant Spencer’s 7 July speech on housing was released, and although I glanced through it then on my phone, last night was the first time I had sat down and read it carefully.  It was really quite disappointing.

I say that not primarily because I disagree with Spencer on many points –  although I do.  But reasonable people can interpret the same data and experiences in different ways.  What concerns me is that the Reserve Bank still doesn’t seem to have a disciplined framework for thinking about housing markets here or abroad, or about its role in respect of the efficiency of the financial system,  and simply doesn’t back up its claims with much analysis or research at all.

Grant Spencer gave a speech on housing in April 2015, shortly after I started this blog.  At the time I was quite critical of that speech (here and here), and rereading those comments this morning I could easily simply repeat most of them now.  They apply as much to the latest speech as to the one given 15 months ago.  Back then I concluded:

Without more detailed and extensive analysis, it is still difficult to escape the conclusion that the Reserve Bank’s approach to housing is being shaped more by impressions of the US last decade than by robust in-depth analysis of the sorts of specific risks the New Zealand economy and, in particular, New Zealand banks and the New Zealand financial system face.

That still seems to be the case.

Of course, not everything can be covered in a single speech.  But good speeches by authoritative senior central bankers  typically draw on analysis and research undertaken in their own institution and elsewhere.  But Spencer’s speech has no references to any other Reserve Bank research and analysis (other than his own April 2015 speech) and in fact no significant references to anyone else’s research or analysis either –  whether to support his case, or respond to alternative perspectives.

And even though Spencer is the Deputy Governor with explicit responsibility for the Bank’s financial stability functions, nowhere does he even mention the Bank’s stress tests.  Perhaps he disagrees with the assumptions that were used in doing the stress tests –  but if so, he should have had them changed –  or perhaps the results are simply uncomfortable given that he knew his boss was champing at the bit to impose yet more controls.  But it should be seen as simply unacceptable for a major speech on housing from the central bank’s financial stability Deputy Governor to not even engage with the stress test results.

There is also nothing in the speech on how the Bank thinks about the implications of its ever-growing web of controls for the efficiency of the financial system –  an explicit (and equal) part of the Bank’s financial regulatory responsibilities.  In his latest letter of expectation to the Bank, released a few days ago, the Minister of Finance indicated to the Governor that he expected the Bank to produce analysis on how the stability and efficiency goals were being balanced.  Four months on from when that letter was written, there is nothing at all in Spencer’s speech.

The Reserve Bank has explicit statutory responsibility for monetary policy, and for financial regulation to promote the soundness and efficiency of the financial system.  It has no statutory responsibility for the housing market, or house prices per se.  And it certainly has no responsibility for tax policy, immigration policy, land use regulatory policy, fiscal policy, policy around Urban Development Authorities, and so on.  And yet in the speech, Spencer weighs in on all of them.

That is not good practice generally, and particularly not in this case where the Bank’s comments seem to be based on no supporting analysis at all.  Central banks are given quite considerable power in specific and limited areas, but continued support for central bank independence (whether in monetary policy or financial regulatory policy) depends in part on a sense that (a) the central bank is a technocratic, limited, institution that doesn’t involve itself in other partisan or politically contentious issues, and (b) that when on very rare occasions the central bank might weigh in on matters outside its direct ambit, it does so backed by very sound research and analysis.  Since central banks often have considerable research capacity, at times such research might be able to shed useful light on some of these wider issues.  But neither of those criteria are met with the material in this speech.

I happen to agree with the Deputy Governor that the government should be reviewing immigration policy –  which is itself quite a change of stance from the Governor’s view on immigration only a few months ago –  but I don’t think it is a matter on which the Reserve Bank should be expressing a view.  And in particular, it should not be expressing such views without the supporting research and analysis.  There appears to be none behind these comments.

Much the same might be said for the government’s recent announcement of a Housing Infrastructure Fund –  the $1000m fund under which the government on behalf of the rest of us will lend interest-free to councils in high population growth areas.  The Deputy Governor opines that this will “help to relieve an important constraint”, except that (a) he references no analysis in support of this claim, which is perhaps not surprising as (b) no one has yet  seen the details of the fund, which appeared to many to be more about getting a weekend’s headlines rather than making a very material difference to the housing situation (recall that it is a $25m per annum interest subsidy, which doesn’t seem likely to make very difference to anything that matters to a macro-focused agency).

Similar comments could be made about the Deputy Governor’s views on taxes or Urban Development Authorities (compulsory acquisition wasn’t explicitly mentioned, but I assume he is probably sympathetic).  It is tempting to lodge an OIA request asking for copies of the analysis the Bank used in support of each of these policy preferences, but it is easy enough to guess how little there would be.  After all, Spencer has form.  In his speech last year, he advocated introducing a capital gains tax.  When I asked for the analysis etc in support of that proposal –  and was pretty sure there was none, as I’d left the Bank only a couple of weeks earlier and had previously written any material the Bank had on CGTs – it boiled down to a single brief email.   It really isn’t good enough.

I could go on.  The Bank has still produced no analysis that looks  carefully at the international experience of the last decade, including considering the countries where house prices did fall sharply and, as importantly, those where they did not.  Instead, they cherry-pick a couple of countries with bad experiences, and don’t ever stop to analyse the similarities and differences between those countries and their policy interventions and the New Zealand situation.  They have still produced nothing explaining why they think the risks are now so much greater than in 2007, even though the banks’ buffers are bigger, and any mood of exuberant optimism is much more attenuated.  While I was still at the Bank I used to pose that latter question to Grant, and never got a serious attempt at a response.

The Bank also continues to anguish about the low level of global interest rates –  the same attitude that has continued to leave them (and the Governor specifically) too reluctant to simply do their main job and keep inflation near-target.  But even there, what they have to offer is unconvincing.  We are told that low real interest rates are “a worldwide phenomenon linked to post-GFC caution”, with no mention of the weak underlying productivity growth and demographics pressures that are at play.  In other words, they treat low interest rates as some exogenous event, rather than something that is an endogenous response to the apparently poor fundamentals, here and abroad.  Partly as a result we get anguishing about low interest rates driving up house prices, rather than a considered reflection on what it is that means interest rates in New Zealand need to be as low –  or lower –  than they are.  For example, real per capita income growth is much less than it was.

Related to this, they simply ignore how not-very-widespread any serious housing market stresses really are.  If low real interest rates were a major factor in the overall house price story we might reasonably have expected to see real house prices well above where they were at the end of the last boom.  After all, at the end of that boom the OCR was 8.25 per cent, and today it is 2.25 per cent.  Inflation expectations have fallen of course, but real interest rates are a lot lower than they were.

House prices not so much.  I downloaded the QV house price index data.   On the QV numbers, house prices nationwide have risen 18.5 per cent since the peak in 2007.   But the CPI has risen 18.1 per cent over that period. In other words, in real terms nationwide house prices are barely changed from where they were in 2007, despite the sharp fall in real interest rates –  and the boom that peaked in 2007 was much bigger credit event than what we have seen so far, and didn’t end in banking system stresses.

In fact, plenty of places in New Zealand have real house prices today materially lower in real terms (and sometimes in nominal terms) than they were in 2007.  Here is an illustrative chart from the QV data

qv house prices since 2007 peak

Of course, the overall level of house (and urban land) prices in New Zealand remains far too high –  far higher, relative to incomes, than in the vast swathes of the US with well-functioning housing supply markets –  but in terms of the last decade or so, what we have had in mostly an Auckland boom.  It is a very big boom in Auckland – as one might expect when unexpectedly rapid population growth collides with land use restrictions – and Auckland is a big place in a New Zealand context, but it is hardly a nationwide phenomenon.    There is some spillover from Auckland to places like Hamilton, and the earthquake related pressures put, probably temporary, pressures on prices in Christchurch and surrounds. But vast swathes of the country –  including our now second largest city –  have seen no real house price inflation over almost a decade, or in some cases really quite substantial falls.  There are plenty of smaller TLAs that I haven’t shown individually –  and almost all of them have had falling real prices –  but they are included in the overall New Zealand number.

One would know nothing of this from reading the Spencer speech.  And quite why the Bank considers it appropriate to have tight controls on access to housing finance in Gisborne, Wanganui and Invercargill remains a mystery –  perhaps the new consultative document will shed some light, but I rather doubt it.

The citizens of New Zealand deserve (a lot) better from the Reserve Bank –  and frankly, from those charged with holding it to account.  Of course –  since the housing problems are primarily a responsibility of the government –  we also deserve a lot better from the government.  Sadly, the Reserve Bank continues to take responsibility on itself for something it is not charged with, and then does not back up its claims with the standard of analysis and research that we have a right to expect.  Far-reaching reforms are needed –  different governance structures, reformed legislation, and different people across the top ranks of the Bank.


Even Treasury has lost hope?

Pottering around the web, and working my way through my emails, on my return from holiday, I found a couple of things from The Treasury that caught my eye.

The first was the release of new risk-free rates and CPI inflation assumptions –  inputs that are required to be used in preparing the government financial statements.  Treasury releases these every few months.  They don’t get much attention –  presumably outside government agency accounting departments –  but out of curiosity I opened the latest one.  And as I dug into the history of these assumptions what I found was really quite startling.

When I was at the Reserve Bank we often used to bemoan the fact that Treasury’s published inflation forecasts never seemed to settle anywhere near the midpoint of the target range.  In fact, for a long time the Treasury approach seemed quite reasonable –  after all, in the first 15 years or so of inflation targeting, the average annual inflation outcomes had been around 0.5 percentage points higher than the (successively revised) target midpoints.  Reasonable people can debate why that happened, but it did.  It was unusual –  in most inflation-targeting countries, out-turns had averaged nearer the midpoint of the respective targets  – but as the midpoint wasn’t mentioned in the PTA it wasn’t a major accountability issue.  Don Brash took the midpoint quite seriously, while Alan Bollard wasn’t too bothered by it, but under both Governors inflation had averaged higher than the midpoint.

The Treasury’s continued assumption/forecast that inflation would settle back to around 2.5 per cent had become more frustrating, and questionable, in the years since the 2008/09 recession.  Actual inflation outcomes had begun to persistently undershoot the midpoint of the target, and the midpoint of the target range had been explicitly added to the Policy Targets Agreement in 2012.  The Bank, the Treasury, and the Minister of Finance all agreed that the focus of monetary policy should be the midpoint.

These are the assumptions Treasury published two year ago.

tsy inflation 1

At the time, it seemed like the ultimate in very slowly adapting, backward-looking, expectations.  By this time last year, they had markedly revised down their assumptions for the next few years (it wasn’t until 2030 that they assumed that inflation got back above even 1.75 per cent), but still assumed that in the very long-term inflation would eventually revert to 2.5 per cent.    If the Reserve Bank was, as it said, concerned to see long-term expectations centre on 2 per cent, there was still some (rather limited) cover in the Treasury assumptions for a moderately “hawkish” stance.  “Not even Treasury yet takes the 2 per cent midpoint that seriously” they might have argued.

But not any more.  Here are latest CPI inflation assumptions from The Treasury.

tsy inflation 2

They have had to dramatically extend the horizon they provide numbers for to encompass the eventual return to their long-run assumptions.  But it is 30 years from now before they assume inflation gets back even to 1.75 per cent, and almost 40 years to get back to 2 per cent.

I’m not sure quite what is going on here.  On the one hand, Treasury is the chief adviser to the Minister of Finance, who has signed a Policy Targets Agreement with the Governor of the Reserve Bank requiring him to focus on a 2 per cent midpoint.  And on the other hand, it is pretty much common ground that monetary policy works with a lag of perhaps a couple of years.  Anything beyond, say, 2018 is definitely an outcome monetary policy can control.  The PTA needs to be renegotiated next year, but not long ago the Secretary to the Treasury was quoted saying that he didn’t think Treasury would be suggesting major PTA changes. And yet Treasury thinks the best guess for inflation for the next 25 to 30 years is something well below the target they and the Minister are asking the Reserve Bank to achieve.

Of course, with yet another surprisingly weak CPI outcome just released, building on years of undershooting the target, Treasury might yet be right (between Reserve Bank policy (mis)judgements and the global deflationary environment).  But whether they are or not, what should disconcert the Governor –  and the Board, and those monitoring the Bank, such as Parliament’s Finance and Expenditure Committee –  is that not even Treasury believes him any longer.  They might say otherwise in their official advice – which we haven’t seen –  but these are the numbers they consciously chose to publish.

And, of course, it is not as if Treasury is alone in its doubts.  For all that the Reserve Bank likes to quote surveys of a handful of local bank economists, the market has its own approximate “price” for implied future inflation.  This chart takes the 10 year nominal government bond yield, and subtracts the yields on inflation-indexed bonds.  It isn’t a precise measure for various reasons, including the changing maturity dates on the various bonds, but the picture is pretty clear and persistent.

iibs july 16

As late as two years ago, the implied inflation expectations for the next 10 years were very close to 2 per cent.  Now they are around 0.65 per cent.

A persistently easier stance of monetary policy is much overdue.  Not even Treasury seems to take the 2 per cent midpoint very seriously now.

(UPDATE: Someone at Treasury pointed me to their relatively recent –  and useful – methodology note, which explains the relatively mechanical approach they currently take to updating the CPI inflation asumptions.  I don’t think it really changes my story, since the considered judgement has gone into the decision as to how best to represent a reasonable future path for inflation.  The Treasury has consciously chosen to put a considerable weight on indexed bond pricing, while the Reserve Bank excludes that information completely from the inflation expectations curve it regularly cites in its updates.)

On another matter, I have lauded the Treasury’s approach to the Official Information Act issues. They seem to take seriously their obligation under the Act, and although they receive a lot of requests (about 350 in the last year) have not sought to charge anyone.  They withhold material from time to time, but I’ve had enough confidence that they were playing by the rules that I have never sought to challenge those decisions, asking the Ombudsman for a review.  That changed this morning.

A while ago I asked for

Copies of any material prepared by The Treasury this year on regional economic performance, particularly in New Zealand. I am particularly interested in any analysis or advice –  whether supplied to the Minister or his office, or for use internally – on the economic performance of Auckland relative to the rest of the country (whether cyclically or structurally).

I wasn’t expecting much; perhaps some anodyne comments on some or other aspect of recent data, including perhaps the regional GDP data released in March.  But while I was away, I got this reply

oia akld 2

It is all very well and good for Treasury to be updating its analysis and advice.  But I asked for what they have already provided, not what they might (or might not) include in future “strategic documents”, such as the next Long-Term Fiscal Statement, which does not have to be published until July next year.

Given that they are not even willing to publish the titles or dates of any documents (whether internal or provided to the Minister) it does raise the question as to what Treasury has to hide.  Given the woeful underperformance of Auckland –  considered in per capita GDP terms – perhaps Treasury is finally awakening to the fact that something is wrong with the Think Big Auckland strategy?  That might be awkward for the government, but isn’t a good basis –  under the OIA –  for withholding material, especially in such a blanket way.

As a reminder, here is how badly Auckland has done

Over time

akld rel to nz gdp pc

And in comparison to the largest cities in other advanced countries

gdp pc cross EU city margins

I’m not sure what Treasury is hiding, or why. Perhaps the Secretary is reacting defensively to my criticisms of his recent speech?  But it was that speech that prompted my original request, to see what analysis lay behind his upbeat claims about Auckland.

As an organization Treasury is better than the standard being displayed here: we see the good side of Treasury again in the recent pro-active release of Budget background papers. It is time for them to reconsider, and to release any analysis or advice they have prepared on the Auckland’s economic performance.  I’ve asked the Ombudsman to review the decision.

Revising the unemployment rate

Last week, Statistics New Zealand published the backdated results from their revamp of the HLFS.  It didn’t get very much coverage, apart perhaps from the headline result, in which the estimate for the unemployment rate for the March 2016 quarter is now 5.2 per cent, down from 5.7 per cent previously.

The change arises mostly because Statistics New Zealand has reclassified those searching for a job by checking websites as not unemployed –  to be “unemployed” for these statistical purposes one has to be out of work, available to start work, and actively seeking work.  Previously, those using just newspaper adverts were classified as  passively seeking work, while people using other search mechanisms were treated as actively seeking work, and thus included with the officially unemployed.  20 years ago web-based advertising  was either non-existent or almost relevant, and now to a large extent it dominates the market.  Fortunately, SNZ had enough data to produce backdated estimates on the new definition back to 2007 (any differences prior to that appear to be very small).

The change brings the New Zealand definition of unemployment into line with the recommendations of the ILO, and seems sensible on its own merits –  there isn’t any good reason to treat newspaper and web searches differently for these purposes.

The headline difference in the unemployment rate is quite large.  But all the gap opened up some years ago.

hlfs revisions

And here is the difference in the two series.

hlfs revisions 2

So, in essence, the data for the last six years aren’t materially affected by the revision and the new methodology: the new series is lower than the old series throughout, but by a fairly constant margin.  The unemployment rate didn’t fall much from the recessionary peak on the old methodology and didn’t fall much on the new methodology.  For example, on the old method the unemployment rate was 6.1 per cent in December 2013, just before the ill-fated tightening cycle began.  Since then, on the old methodology the unemployment rate has fallen by 0.4 percentage points.  On the new methodology, it was 5.7 per cent in December 2o13, and has fallen by 0.5 percentage points to 5.2 per cent.

But the new series does throw up a couple of questions.  The first is about international comparability.  As I noted, the SNZ release noted that the new methodology was more consistent with ILO recommendations.  That is good on its own terms.  But I was curious as to whether other countries were following ILO recommendations (yet) in this area.  I’ve known of other cases –  household debt was an example –  where we improved New Zealand data, drawing more into line with international standards, only to find that the international comparability wasn’t really improved because most other countries we were interested in weren’t yet following international guidelines.

So I asked SNZ whether they had any sense of how other countries were doing on this particular issue.   I got a full and prompt response from the manager of their Labour and Income Statistics area.   The short answer was that some countries seem to comply in this area, and others don’t.  Perhaps fortunately for us, both Australia and the US appear to treat looking at (newspaper and online) adverts the same way we do –  passively seeking work, rather than actively seeking work.    But, on the other hand, Eurostat treats looking at adverts as actively seeking work.  It is a reminder that simple levels comparisons of unemployment rates across countries often doesn’t involve (strictly) comparing apples with apples.  Comparing changes within over time within individual countries should still be valid.

The other question is how to think about the normal/natural/non-inflationary rate of unemployment.  At 5.2 per cent, our unemployment rate is still a long way above the pre-recessionary lows  (3.3 per cent) –  by contrast in the US and the UK, the recessionary increase in the unemployment rate has been fully unwound.  But the gap between 5.2 per cent and 3.3 per cent is materially less than that between 5.7 per cent and 3.4 per cent (on the old methodology).  Since most everyone thought that the unemployment rate prior to the recession was below the natural or non-inflationary level, does this new data raise questions as to whether the current unemployment rate might be not far from the NAIRU?

I don’t think there is any easy answer to that question.  Only time will tell.  As happened in the US and the UK we –  and the Reserve Bank –  need to see what happens, to wage and price inflation, as the unemployment rate gets down to the mid to low 4s (one hopes the Reserve Bank allows us the chance to see).  But don’t rule out the possibility that the NAIRU itself has been falling –  as it was widely perceived to have done in both the US and New Zealand in the 1990s and 2000s.

One reason why it might fall is the growing importance of old people in the labour market. Of all the OECD countries, New Zealand has seen the largest increase in the participation rate of older people (65+) in the 20 years since 1995 –  rising from 6 per cent to 21 per cent. .And we now have the fifth highest participation rate for the over 65s among the OECD countries.

over 65 participation rates
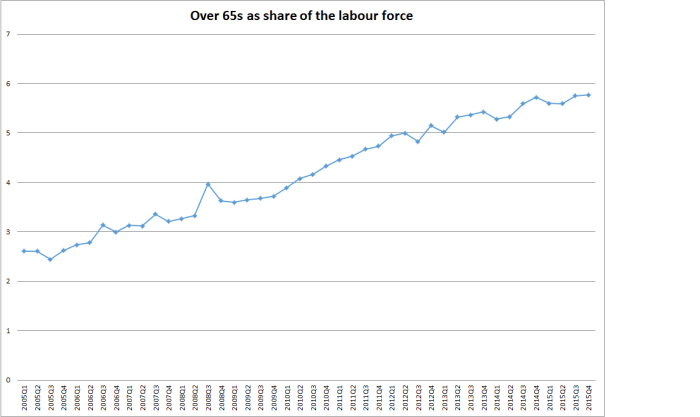
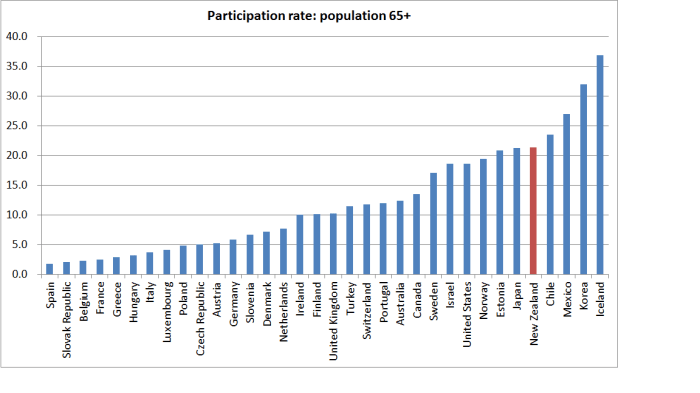
And the unemployment rate among older people is very low indeed   – before the recession and now both around 1.5 per cent.  That makes sense –  older people have New Zealand Superannuation to fall back on, with no work test, so there is typically no urgency to find another job (to be “actively seeking”).  But it is a very different –  and less cyclical –  unemployment rate than that for the rest of the workforce.

And here is the share of the over 65s in the labour force.  Even just over the last decade, the share has increased from 2.6 per cent to 5.8 per cent of the total labour force.

over 65s share

With such a low unemployment rate among this (rapidly growing) part of the workforce, the overall unemployment rate (actual and natural) should be trending lower over time, all else equal.

How material  this proves to be remains to be seen.  But a line I often used to use in debates about unemployment is that if everyone spent a year officially unemployed (available and actively seeking work) in a 45 year working life, that would produce an unemployment rate of only around 2.2 per cent.  For many people, a full year officially unemployed is a very long time –  more than a few people are probably like me, having spent over 30 years in the labour force and not a day officially unemployed.  We need to be guided constantly by the data, but we shouldn’t rule out the possibility that the NAIRU could keep falling quite a long way (and perhaps especially while the NZS age remains at 65).

This is my last post for a week or so.  The school holidays start tomorrow and we’ll be away for a while. I should be back writing here on 18 July –  I might even still find something to say about the speech on housing (and housing finance) Deputy Governor Grant Spencer is due to deliver this evening.


Beware the ignorant

Sitting in the sun, reading the Herald over lunch, I found my own name leaping out at me.

An Auckland immigration lawyer –  I’m going to treat his argument on its merits, but do note the vested interest here –  Alastair McClymont had an op-ed headed Beware ignorant debate on motivated migrants.  I am apparently one of the “ignorant”.

Just who are the migrants supposedly stealing our houses and jobs? There have been plenty of knee-jerk reactions recently about the appropriate number of migrants that New Zealand can absorb each year. There has also been evidence of much ignorance on the subject.

In the 12 months to April, New Zealand received 68,000 net migrants (long-term arrivals minus long-term departures). New Zealand First leader Winston Peters has suggested the number be reduced to a maximum of 15,000 a year and as few as 7000.

Economist Michael Reddell has stated that cutting migration to 10,000 a year would lead to a reduction in house prices.

But the debate about migrant numbers is more complicated than Mr Peters or Mr Reddell would have us believe.

I am not speaking for Winston Peters, who I have never met or talked to.  A fairly prominent person told me this morning that I had changed their way of looking at the New Zealand immigration debate over the last year or so, and noting that he had previously treated immigration as desirable partly because of a reaction against the way Winston Peters had raised the issues 20 years ago.  I can certainly understand that.

But as for me, perhaps Mr McClymont could refer me to any suggestion I’ve ever made that migrants are “stealing our jobs and houses”.  On the jobs front, I’ve been quite clear that I think the evidence is that immigration boosts demand more than supply in the short-term, and hence that increases in immigration at least temporarily lower unemployment.  The Reserve Bank’s research, which I often quote, is consistent with the decades-long experience –  implicit in all macro forecasting frameworks – in which, all else equal, interest rates typically rise here when immigration is unexpectedly strong. That is because of the considerable boost to demand –  new immigrants need houses, road, schools, shops, just as long-term residents do.  As for houses, well I don’t think anyone doubts that increased population pressure –  whether immigrants (foreign or New Zealanders) or natural increase –  increases the demand for housing, and that the new supply of housing is all too sluggish.  So, yes, population shocks tend to boost house prices, and it often takes a long time for supply to catch up.  That isn’t controversial stuff.

But apparently “the debate about migrant numbers is more complicated than [I] would have us believe”.   I’ve written various  lengthy papers and speeches on the issues over several years (for anyone interested, links are here), and have written dozens of posts here over the last 15 months on the issues.  I quite agree it is a complex issue, and especially the connection to New Zealand’s long-term economic underperformance  –  something Mr McClymont does not even mention in his article.  I’ve even taken the time to spell out what, specifically, I think should be done about changing our residency programme.

He goes on

Shamefully, Indian and Chinese migrants have too often borne the brunt of our community’s negative reactions to the high number of migrants, but total net migrants also include your German au-pair, the French or British waitress at your local cafe, the young, Aussie, seasonal worker at the ski field or your friend’s son returning home from work in London.

Well, yes.  But where is the news?  Go back and look at everything I’ve written on this topic, and you’ll find that I have been almost exclusively focused on the economics of the argument.  I’ve been clear all along that all the economic arguments apply even if all the migrants were from Yorkshire and Sussex (as mine mostly were).  In fact, in the post-war decades, the overwhelming bulk of our migrants were British –  and since the new income-earning opportunities weren’t that good here, in fact that rapid population growth seems to have compromised our per capita income prospects.  We’ve been in relative decline for 70 years.

Mr Clymont seems to want to suggest that I’m not even aware of the different classes of arrivals. So we are treated to a brief description of them –  returning New Zealanders, working holiday schemes, foreign students, temporary work visas holders. But barely a mention of the residence approvals programme, with its explicit economic focus (the “critical economic enabler” as MBIE puts it).   As McClymont will know, from having looked at what I have written, I have been focused on the residence programme, and have argued for substantially reducing the size of that programme (to something more like the US scale).  Treasury themselves have had doubts about the working holiday schemes and the use of work visas in some relatively low-skilled areas.  Others have raised concerns around the abuse of the foreign student process.  Those mostly look like reasonable concerns, but they aren’t my focus.  I’m focused on the residence approvals programme, which is what determines the long-term contribution of non-citizen immigration to our population growth.  Perhaps Mr Clymont is focused on the headline PLT immigration numbers –  I’m not, and never have been.

As I said, McClymont barely mentions the residence approvals programme, and doesn’t mention at all the 45000 to 50000 annual target –  a target which is three times, per capita, the number of residence approvals the United States grants.  Instead he falls back on debates around the short-term programmes.

The filling of low-skilled jobs by migrant workers is just a by product of the export education industry. The only low-skilled workers being imported fill jobs in the horticulture, dairy and health care industries.

But hold on, until a few years we didn’t allow foreign students generous work rights here –  and actually had as many foreign students in the previous boom of the early 2000s as we do now.  So it is a choice we make, not a necessary corollary. It isn’t really my issue –  it isn’t something that really affects long-term economic performance –  but it isn’t the choice I’d make  if I were setting policy.

And his final sentence in that quote rather gives the game away. Those are each rather large industries.   But again, my focus is on the residence approvals programme target, something McClymont doesn’t address directly at all.

By the end of the article, he is reduced to anecdote

I regularly speak with employers who are desperate to retain and recruit migrant employees. They all complain about the casual Kiwi attitude towards work and their constant “sick days”, particularly on Mondays.

By contrast, these employers find that migrants are more highly motivated to work and succeed at their jobs.

Many employers testify to the fact that 90 per cent or more job applications come from migrants, so why aren’t Kiwis applying for the jobs?

The condescending attitude to his own fellow citizens is pretty unnerving –  lets trade in our people for another lot.  But even then he seems unaware of the fact that New Zealanders work long hours per capita (longer than citizens of almost any other advanced country), and recently emerged on the OECD’s cross-country skills comparisons as having some of the best developed skills of people in any advanced countries.  Could all of us do better?  Well, quite possibly – even those of us not in the workforce.    And is it any wonder that new arrivals are dead keen to establish themselves and get a foothold in a new country.  But the point of the immigration policy is that it is supposed to boost the medium-term economic fortunes of New Zealanders as a whole –  not just some individual employers.  Somewhat surprisingly, no one has yet been able to produce serious evidence –  or even sustained argument supported by reasonable data –  that New Zealanders are materially better off as a result of the really large immigration programmes we have run for most of the last 70 years, and which we continue to run today.  MBIE hasn’t, the Minister of Immigration hasn’t, Treasury hasn’t, the Prime Minister hasn’t.  And Mr McClymont has not even really addressed the issue.

I argue that New Zealanders have probably been made worse off – our exports still rely almost entirely on natural resources, and yet the fruit of those natural resources is spread over ever more people.  It would be interesting to know why Mr McClymont thinks such a remote place, underperforming for decades, would have one of the faster population growth rates anywhere in the advanced world.  In fact, the “why” is simple: the answer is “policy”, but it doesn’t look like good policy, especially when New Zealanders themselves –  who presumably know the opportunities here pretty well –  keep leaving,

There are real and important debates to be had on the best immigration policy for New Zealand. I’ve argued that experience suggests a very distant country that has struggled to grow its export base isn’t a natural place for policymakers to try to drive up the population And I’ve repeatedly pointed to the troubling data around our:

  • lagging productivity
  • weak business investment
  • weak tradables sector and export activity
  • persistently high real exchange rates, and
  • persistently high real interest rates (relative to those in other advanced countries)

and made a case that our immigration policy is part of what has held our economy back from being able to offer really high material living standards to our people.  It isn’t a criticism of the immigrants, who are simply and rationally pursuing their best interests.  If there is criticism to be levelled, it is at our own officials and ministers.  But it is quite possible that my hypothesis is wrong.  And there are also other –  non-economic –  motivations for immigration (humanitarian, through the refugee quota, or perhaps even a general sense that migrants will be better off even if we aren’t).  Those are respectable arguments, and there are considered alternative perspectives to some of the points I’ve raised –  few issues in economics are ever totally clear-cut.  Lets have the debate –  looking at the data, and the evidence, and trying to develop a compelling narrative of New Zealand’s economic performance, and immigration policy’s role (for good, ill, or not much difference) in it.  But pretending that people raising questions about the programme are simply ignorant, and need it all explained to them once again, this time slowly and clearly, isn’t really likely to be very constructive.


A 40 per cent fall in house prices?

I noted the other day that I had disagreed with a fair amount of what was in Arthur Grimes’s recent piece on fixing the housing market (both the Spinoff piece, and the earlier Herald account of his remarks).  Arthur is quite clear in his value judgements, and mine differ: I don’t think there are good grounds for riding roughshod over the rights and interests of existing residents, in pursuit of some bureaucratic-political vision of a bigger Auckland.

But where I strongly agreed with him was that making home ownership affordable again means that house prices have to fall.  And they have to fall a long way.  If price to income ratios are around 10 in Auckland today and are around 3 in places with well-functioning housing markets, it might be desirable if house prices today were as much as 70 per cent lower than they are now.   Allow for some growth in nominal incomes over the next decade –  perhaps 3 per cent per annum (2 per cent inflation and 1 per cent productivity –  both ambitious assumptions by the standards of the last few years) and even a 50 per cent fall in nominal house prices over that time would only get Auckland house prices back to a price to income ratio a little under 4.

So when Arthur Grimes suggested that politicians should think in terms of actions that would bring about a 40 per cent fall in house price, in some ways he was being quite moderate.  Perhaps he shouldn’t have used the word “collapse” as his goal, but that sort of fall is what making home ownership affordable actually means.    Alternatively, I suppose, nominal house prices could hold at current levels and in 35 to 40 years time price to income ratios might be back to respectable levels.  And another whole generation would be doomed to barely affordable houses..

Perhaps fortunately, the Grimes remark prompted the Prime Minister to reveal what appear to be his true colours on housing.  He simply dismissed the Grimes suggestion of a 40 per cent fall in house prices as “crazy”.  He could have said “well, I don’t want to get bogged down in precise numbers, and one has to remember that some people will be adversely affected if house prices fall”.  But no, the Grimes suggestion was “crazy”.

It betrayed a fundamental lack of seriousness on the part of the Prime Minister and the government about making housing affordable, and in fixing the dysfunctional market that they –  and their Labour predecessors –  have presided over.   Since the Prime Minister is often quoted as suggesting that high Auckland prices are a sign of success, a “quality problem”, or just the sort of outcome big cities everywhere have, why would we be surprised?  Grimes notes that no politician has been willing to give a a straight answer on how much they wish house prices to fall.    Perhaps there is some role for “constructive ambiguity” in such areas but I had a lot of sympathy for Arthur’s line:

I suggest that this simple question should be asked every time a politician (of any stripe) talks on the subject. One can then see if they are really serious about making house prices in Auckland affordable for ordinary people.

And one only has to look at the “policy solutions” the government has proferred over recent years.  This time two years ago, the Prime Minister launched National’s election campaign with increased subsidies for first-home buyers –  a scheme opposed by officials who recognized, as everyone knows, that those sorts of subsidies flow straight into house prices.

Last year, the clever wheeze was altering the points scheme to encourage more of those gaining residence approvals in New Zealand to move somewhere other than Auckland –  thus perhaps very marginally easing house price pressures there, while guaranteeing a slight worsening in the average quality of the migrants who get residence approval.

And this year it was the infrastructure fund –  the $1 billion headline, with seemingly no details behind it, and involving interest-free loans from the rest of us to councils in places with fast population growth (and rapid future income growth).  Wasn’t this the party that, not that long ago, (rightly) thought that interest-free loans to students with good income prospects was simply bad policy.

We also now have talk of the government seizing private property.  David Seymour was quoted suggesting it sounded like a Venezuelan solution –  although, in actual fact, the idea came from the (admittedly rather statist) Productivity Commission, one of ACT’s earlier policy wins.   Whatever the source of the idea, it is another example of the vision, the dream, of the “big Auckland” potentially trumping the rights of private citizens.  Or perhaps just wanting to sound as if something might be done.  Populist bashing of “land bankers” keeps ignoring the fact that land scarcity, of the sort that makes “land banking” expected to be profitable, is the result of regulatory restrictions presided over by central and local government.  From what I’ve read of the draft National Policy Statement, there is nothing in the works that will fundamentally change that.

Would 40 per cent lower house prices be a problem for some people?  Well, yes, of course.  Big relative price changes often are.    But it becomes a bigger, and more constraining, problem the longer any correction is deferred.    Most people in Auckland didn’t enter the property market for the first time in the last five years or so.   Those existing home owners are no better off as a result of the extraordinary increase in house prices, and would be no worse off if structural reforms (whether increased supply or reduced population growth) reversed the increases of the last five years.  Those who have bought in the last year or two could be in some difficulty, but even then everyone’s situation is different.  For someone who bought three years ago with an 85 per cent LVR loan, a 40 per cent in house prices now might leave them with little or no equity.    But they didn’t have that much equity to start with.  There isn’t much risk of them losing their home –  the ability to service the debt is what counts and that depends more on unemployment than house prices.

We are often reminded that a large proportion of purchases in the last few years have been made by the much-maligned “investors” (no doubt the Deputy Governor will indulge in that populist game again tomorrow night).    That isn’t really surprising, given how high prices have got, making it very difficult for young people to get on the home ownership ladder.  But for those “investors” (residential rental business owners) what is the worst that can happen?  Perhaps their highly-leveraged business operation fails, and their lenders take some losses.  That is what happens in a market-economy.  Many businesses fail.  People take risks, and sometimes they get things wrong, or circumstances change.  Their businesses fail and in most cases they pick themselves up and start again. Is it tough for them?  I’m sure.  In the same way, it is tough for ordinary workers who lose their jobs and incomes in a recession and often take quite some time to get established again.

And if some people will suffer in house prices fall, that is only the quid pro quo for relieving the pressures (“suffering”) on whole classes of people who find it desperately difficult to afford a house at all, especially in Auckland –  the younger, the less well-established, the newer arrivals, those without wealthy parents to fall back on.    If one puts together all the Prime Minister’s comments, it seems that he would be content if only the rate of increase in house prices  from here slows down –  even just for a few months at a time – and he has little or no fundamental interest in getting real or nominal prices back down again. He  seems to have no real interest in doing what might be necessary to make housing affordable again.

How else to interpret him playing distraction yesterday by urging the Reserve Bank to impose yet more controls.  Perhaps there is a case –  in the soundness and efficiency of the financial system, the only statutory grounds the Reserve Bank has to work with –  for more controls. The cases made for the successive waves of controls to date haven’t been very convincing, but perhaps Spencer and Wheeler have some persuasive new analysis up their sleeves.   But everyone recognizes –  the Reserve Bank foremost among them –  that such controls aren’t the answer to the housing problem.  Perhaps such controls can reduce banking system risk a little – the evidence isn’t clear even on that point –  at the cost of undermining the efficiency of the financial system, but to the extent such measures have an impact on house prices and house price inflation it is for a matter of months only.

After that initial relief –  which simply provides cheaper entry levels for people not directly affected  by the controls –  the underlying forces shaping supply and demand for housing reassert themselves: a “rigged” land supply market running head-on into the effects of policy-fuelled rapid population growth.  Without fixing one or both of those factors, there is little prospect of houses being much more affordable for long.  Tax changes are not the issue –  we know that from cross-country experiences.  But, implicit in his dismissal of Arthur Grimes’s proposition, the Prime Minister and his government don’t really seem to care.  They seem happy to cement in something like the current woefully awful market outcomes –  where fewer people than ever can buy a home, at ever older ages –  just so long as the headlines about high rates of increase abate for a few months.  It is pretty disheartening.  Frankly, I think it is worse that that; it is pretty disgraceful.

Of course, the other reason people might be uneasy about large falls in house prices is if such falls resulted in serious banking system problems.  But we  –  and the PM – know the results of successive waves of Reserve Bank stress tests: faced with a savage fall in Auckland house prices, and an increase in the unemployment rate unprecedented in modern times in countries with floating exchange rates, the banking system comes through pretty much unscathed.  A reader recently reminded me of a good 2009 speech on stress tests etc by a senior Bank of England official.   In that speech, Andrew Haldane identified a five point plan that would enable us –  following the 2008/09 financial crisis –  to be more comfortable with stress test results in future.  On my reading of that list, the Reserve Bank’s tests score well on all counts.  Perhaps as importantly is a point Haldane didn’t include in his list:  at times it suits supervisors to not be too demanding in their stress tests, so that they don’t face pressure to force banks to act.  In the Wheeler years, the Reserve Bank has been dead keen to act, imposing ever more controls.  It would clearly be in the Reserve Bank’s interests –  in making the case for controls –  if the stress test results were worse than they actually are.

Perhaps as importantly, the stress tests are premised on a scenario in which the unemployment rate rises hugely –  a very severe recession, worse even than New Zealand experienced in the early 1990s.  But if house prices fall because there is the potential for much more supply on the market, that isn’t a recessionary force, but if anything an expansionary one.  The banking system would cope just fine with a liberalization of the land and housing supply market.

I’ve always refused to call the Auckland (or wider New Zealand) housing market a bubble. The disastrous results seem to be a predictable outcome given the combination of land use restrictions and extraordinarily rapid population growth –  structural features of the policy regime, not signs of irrational exuberance (perhaps especially not in an economy generating such weak per capita income growth).    Sometimes circumstances can take care of these problems –  perhaps we’ll have an unexpected annual outflow of 40000 people for a few years –  but the structural imbalances that have skewed the housing market so strongly against ordinary people starting out is largely a policy problem. and one that needs p0licymakers to fix.  Based on his comments in the last few days –  and his actions in the last few years – the Prime Minister doesn’t seem to care, if only the headlines would abate.


Exporting: the failure of one small OECD country

The current government has a published target for increasing the share of exports in GDP.  I’ve argued previously that that was unwise, for a bunch of reasons, including the risk that it can encourage measures that might boost exports (to meet the target) but which don’t pass standard tests of good economic policies. I’d probably put enhanced film subsidies in that category –  the export incentives of the current generation.  But, equally, setting targets without any supporting economic strategy to deliver sensible results that meet the target has its own problems.

Despite all that, I suspect no one who cares about improving New Zealand’s medium to long-term economic performance is indifferent to the export performance of New Zealand firms, and the  New Zealand economy as a whole.  After all, the wider world is where most of the potential markets are –  especially for firms from smaller countries.  Perhaps there are examples, but I’m not aware of cases of countries that have markedly improved their economic performance on a sustainable long-term without a robust export sector (and tradables sector more generally) being part of that success.

I showed a chart the other day with a snapshot comparison of export shares in Australia and New Zealand in 1980 and 2014.  New Zealand hadn’t done well.  But how have we done over the decades not just by comparison with Australia, but compared with the wider group of advanced countries?

The OECD has data on exports as a share of GDP going back to 1970 for 27 countries, including New Zealand.  Here is the chart, comparing New Zealand with the median of those OECD countries.

exports as a share of GDP

For an individual country, in particular, there is quite some variability.  Thus, the combination of the sharp fall in our exchange rate in 2000 with high dairy prices temporarily boosted New Zealand’s exports to around 35 per cent of GDP.  But if one focuses on the trends, one could say that broadly speaking we had kept pace with the growth of exports in other OECD countries until around 2002/03.  But over the last 15 years, even though world trade growth slowed sharply late in the 2000s and has never really recovered, New Zealand has fallen well behind.

Only rarely is all the information in a single chart.   This isn’t one of those times.  Part of what has gone on, especially in Europe, is the growth of “global value chains”: whereas previously a car might have been designed and built entirely in Germany, and then exported, now often enough there is a lot of gross cross-border trade in the design and manufacturing phase, before the finished product is sold.  That inflates gross exports (and imports) and overstates the growth in economic value-added associated with exporting.  We don’t have up-to-date value-added data, nor a good long time series.  On the other hand, this didn’t suddenly start becoming an issue in 2003.

We also know that:

  • small countries tend to export and import larger shares of their GDP
  • far-away countries tend to export and import smaller shares of their GDP

Both these points need to be kept in mind. The first doesn’t have any very obvious implications: were Belgium to split in two, exports and imports as a share of the respective  GDPs of Flanders and Wallonia would rise even if no transactions were done differently after the split than before it.    But the distance point does have implications.  For whatever reason, distance is an obstacle to foreign trade, even that in services (it is probably not typically the dollar transport costs, but something about time taken to ship goods, and the physical proximity of people –  customers, potential staff, even competitors), and makes it harder –  all else equal –  for distant places to prosper.  Not surprisingly then, one doesn’t find too many people in very distant places.

But reverting to size, here is how the chart above looks if we focus only on the small countries the OECD has data for.  In 1970 only two OECD countries –  Iceland and Luxembourg –  had smaller populations than New Zealand.  We had just under 3 million people, and at the time Norway, Ireland, Denmark, Finland and Israel had fewer than 5 million people.

exports small countries

The recent divergence is, if anything, even more stark.  Our export share of GDP in 1970 was already low by small advanced country standards –  and had shrunk, as one would expect, during the years of heavy protectionism.  But the gap has materially widened only in the last 15 years.  Some of that will be the (profitable) growth in Europe in cross-border trade as part of the production process. But it certainly isn’t the whole story.

What makes me fairly confident of that claim?  Two things really.  The first is this chart (which I’ve run before), the indicative breakdown of New Zealand’s per capita GDP into tradables and non-tradables sectors.  Something here changed, quite materially, in the early 2000s.

pc gdp components

And the second is our exchange rate.  Here is the real TWI, using Reserve Bank data updated to capture the last few months.

real exch rate

Our real exchange rate has always been quite variable.  But if anything over the last decade or so there has been a bit less variability than in the preceding decades.  And probably more importantly, the average real exchange rate since the start of 2004 has been 20 per cent higher than the average over the previous 20 years (the period for which the Reserve Bank has the data).

That would be great if it had reflected a marked improvement in our relative productivity performance. But, of course, it hasn’t.  And perhaps unsurprisingly our tradables and export sectors have really struggled.

Of course, the real exchange rate isn’t simply a policy lever governments pull.  It is an outcome of other factors –  some policy, some market.  And quite what those factors were is a topic for other days.  For today, I simply encourage to reflect on how poorly New Zealand continues to do, and especially in building and expanding sales to the rest of the world, drawing on the high level of skills of our people, and the talents of our firms.