An article in yesterday’s Herald caught my eye. In a double-page feature on Brexit, it was headed “Options beyond the EU” and featured some comments from the former New Zealand Minister of Finance, Ruth Richardson. I was a bit puzzled by the article, which didn’t really seen like a New Zealand article, but wasn’t attributed to any foreign newspaper or wire service. When I checked it out, it turned out that it was a backgrounder that had run as part of a series in the Telegraph three months ago looking “at four non-EU economies to see if they could provide a model for Britain’s post-Brexit future”. One was New Zealand. (The Telegraph had gone so far as to described Richardson as a”great economic reformer”, although the Herald quietly deleted the “great”.)
Several passages interested me:
Ruth Richardson, a former New Zealand finance minister and a great economic reformer, believes there is a clear parallel between the two nations, and the choice that each will face. “When Britain decided to become very closely connected [with the EU], Britain was regarded as the sick man of Europe,” she says, with the UK “almost on the brink of the International Monetary Fund dictating policy” to it. Similarly, “when New Zealand decided to explore closer economic relations with Australia, we were clearly the sick man of Australasia”.
However, Richardson says, “nations ought not to be trapped by historical perspective”. She believes that the arguments behind a once sensible decision may have shifted. As in business, decisions over a country’s political future should be made on the basis of what will work best in the here and now, Richardson says.
Both the UK and New Zealand have risen to become the strongest performer in each of their respective blocs, and the reasons to pivot towards emerging markets have become clear.
And
A pair of radical politicians helped New Zealand through this difficult period. Richardson was the finance minister in a Right-of-centre National party government from 1990 to 1993, and her efforts, combined with those of her predecessor, the Labour party’s Roger Douglas, transformed the economy from one at the bottom of the pile to something far more dynamic.
Shaun Goldfinch, a New Zealand-based academic, says that the country moved from being “one of the most hidebound economies outside the former communist bloc, to among the most liberal in the OECD”.
I wasn’t entirely sure that I recognize the pictures being drawn here.
In both cases, it is a picture of economies transformed – the UK and New Zealand having ‘risen to become the strongest performer in each of their respective blocs’ (the EU and the CER respectively).
The UK entered the (then) EEC on 1 January 1973. The initial six members of the EEC had been France, (West) Germany, Italy, Belgium, Netherlands, and Luxembourg. I’m going to ignore Luxembourg in subsequent comparisons, and focus on the five reasonably large initial EEC economies.
For the UK the path to the EEC was pretty slow. The first de Gaulle veto had occurred in 1963, and the second in 1967. Over the 1960s, annual UK inflation was around 1 percentage point above the median of the five EEC countries. In 1972, just prior to joining the EEC, that gap was 1.4 percentage points. Things got a lot worse in the following few years, but even then there was only one year – 1975 – when the UK had the highest inflation rate of these six economies. Italy was typically worse.
And in the 1960s, real GDP per hour worked in the UK is estimated – using the Conference Board data – to have been almost exactly equal to that of the median country of the EEC-5. Britain’s unemployment rate had been slightly below the median of the unemployment rates of those other European economies.
Of course, Britain had its challenges – economic, and the psychological/political hurdles of the end of empire – but it was hardly a basket case.
And nor has it, very obviously, gravitated to top of class since then
Here is real GDP per hour worked.
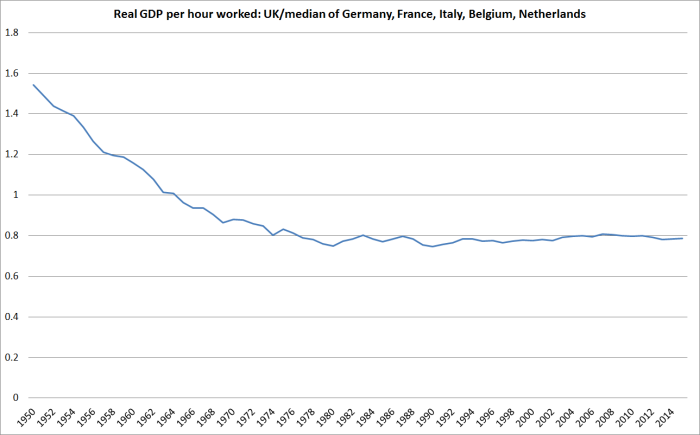
The decline in Britain’s GDP per hour worked, relative to those of the EEC-5, ended in around 1980. And it has gone almost exactly sideways ever since. Of these five European countries, Britain now only matches the real GDP per hour worked of Italy. In the other four countries, labour productivity is around a quarter to a third higher than that in the UK. Perhaps entering the EU staunched the decline, but there were probably a variety of other factors including financial liberalization (financial services being a huge chunk of British exports), the Thatcher reforms, and the end of the post-war catch-up phase. But……Britain now has a lower level of labour productivity than all but one of these five European peers: it does no better than 80 per cent of the median of these other countries. Not exactly a “top of class” performance.
One area where they have done better is unemployment. The following chart shows the UK unemployment rate and the median rate for the same five European countries. It combines official current OECD data (on harmonized definitions) since 1983, and several years of earlier OECD data from their Historical Statistics: 1960-1988 publication.
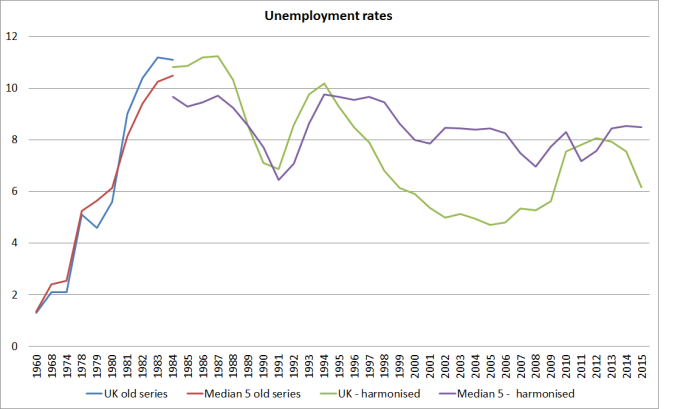
Over the last 20 years or so, the UK has clearly done materially better than these five European countries. Each of the other five is in the euro, but that shouldn’t explain any difference given that these five countries include four of the larger euro-area economies. But even among those other five countries, the Netherlands has typically had a lower unemployment rate than the UK’s – although that isn’t so right now.
And what about the New Zealand/Australia comparisons. Negotiations on the CER agreement began in 1979, and the agreement was signed in early 1983. Given that there are only two countries in Australasia, I won’t dispute the description of New Zealand by then as the “sick man of Australasia”. Our economy had been very severely hit by the post-1973 fall in the terms of trade. The large outflow of New Zealanders to Australia really gathered pace in the 1970s. Neither country was running macro policy – or micro policy – that well, but New Zealand was generally accepted to be lagging somewhat behind Australia. We compounded the problems with the Think Big energy projects programme in the early 1980s, which temporarily boosted demand, but simply threw away some of the nation’s wealth.
But the story wasn’t totally bleak. Our unemployment rate, while rising, had been consistently below that of Australia. And over the years when CER was being negotiated, New Zealand’s real GDP per hour worked was about 79 per cent of that of Australia – alert readers might notice that that is about the same ratio as that between UK GDP per hour worked today and that of the EEC-5 (see chart above).
I’m not about to dispute that lots of worthwhile reforms were done here during the subsequent years. And I think it is likely – although hardly certain – that CER was helpful to both countries (although trade diversion effects were probably material in some sectors). And there are whole sectors of the economy where I think policy in New Zealand could reasonably be judged better, at least in terms of encouraging resource utilization, than that of Australia. The labour market is one of them – we don’t need elections called on the ostensible grounds of breaking the power of corrupt trade unions. I know some readers disagree, but I think our approach to retirement income policy is superior to Australia’s. And I often like to mention that taxi industry, where deregulation has given us a much better outcome than Australia has.
But has it made us the strongest performer in our little two country bloc? Not really.
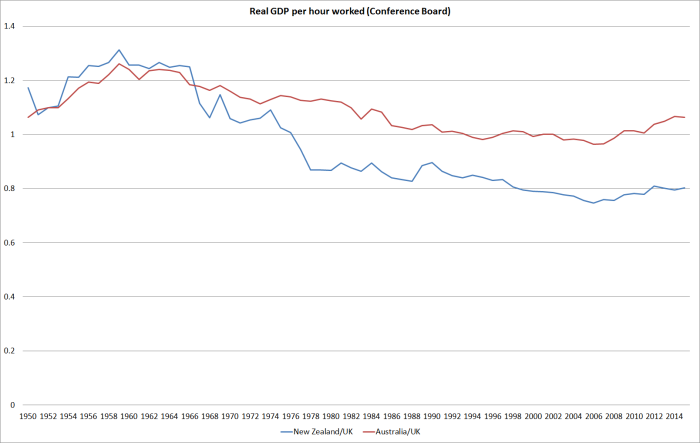
Take the real GDP per hour worked comparison, again from the Conference Board.
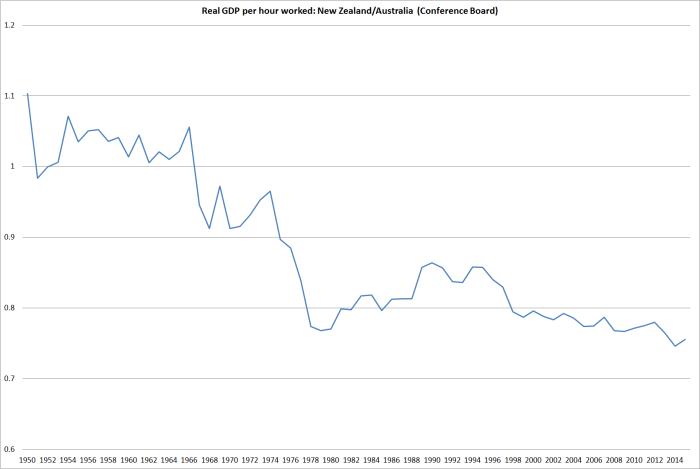
The late 1970s were a very bad period, as reflected in these data. But on this measure things improved a bit of the 1980s – partly no doubt the unsustainable boom that bust after 1987 – before tailing off again. Today, New Zealand’s GDP per hour worked is a little worse, relative to Australia’s, than it was when the CER negotiations got underway. Perhaps the exam paper was upside down when that “best in class” grade was being awarded? Of course, both countries are richer, and more open, than they were back then, but Australia has kept on doing a bit better than us.
And a significant part of the liberalization and reform process in both countries was the opening to external trade (not just bilaterally). Here is the data for exports as a share of GDP.
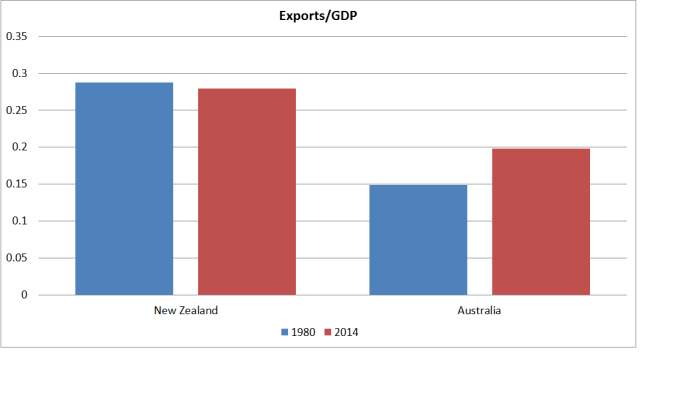 New Zealand’s export share of GDP hasn’t changed in 35 years.
Of course, there are some area in which we do better – and we have the distinct attractions (to New Zealanders at least) of no snakes or crocodiles. As I noted earlier, the labour market tends to be one such area. Here are the unemployment rates for the two countries back to the 1960s (prior to 1986 the New Zealand data are estimates, but good enough to be used by the OECD). I have taken account of the revised data Statistics New Zealand published earlier this week.
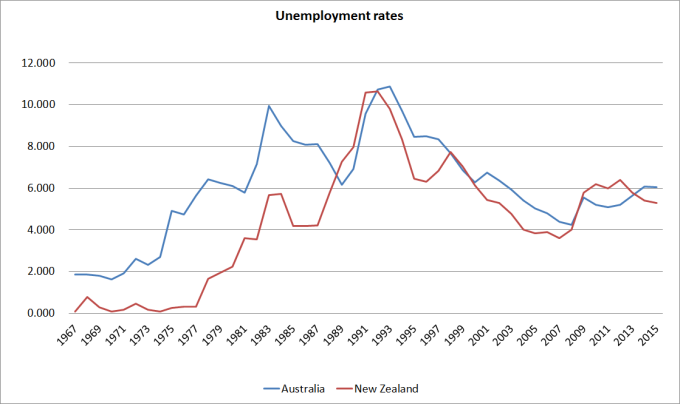
Our unemployment rate has been below that of Australia most years since 1967. Only on two occasions was our unemployment rate higher – the first episode was in the wake of the post-1976 share and commercial property crash, and the second was in the couple of years after 2009 when Australian commodity prices – and the associated business investment boom – were at their peak. We should, of course, welcome the fact that our labour market typically generates less unemployment than Australia’s does, but it is worth mentioning that the gap in our favour is smaller than it was pre-liberalization.
No doubt our economy is rather more “dynamic” than it was – although it is fair to wonder quite what that words mean specifically – but it isn’t obviously much more successful., not even relative to Australia. Compared with the late 70s, both countries now have low and stable inflation – but their inflation rate is nearer target than ours. Both countries have low levels of public debt, but in flow terms at present our government accounts are roughly balanced while theirs are still in deficit. We have a slightly larger reliance on foreign capital (larger net IIP position as a share of GDP) than Australia does, but perhaps they have a slightly more compelling story about the new business investment (tradables sector) that capital has financed. Both countries have seriously dysfunctional housing markets – it is hard to tell which of two bad performers is worse. Oh, and New Zealanders are still (net) moving to Australia, not coming home again.
It is election day in Australia. I was amused when Malcolm Turnbull became Prime Minister and talked about wanting to emulate New Zealand’s approach to economic reform. In the intervening period, there hasn’t been much sign of reform in Australia – any more than there had been in New Zealand – but for all Australia’s challenges, it has still managed more productivity growth in recent years than New Zealand has.
As I noted earlier, the United Kingdom has hardly been a top-of-class performer in Europe in recent decades. The sobering thing is that over the last few decades, Australia – with all its newly developed mineral wealth – has managed to do no better on the productivity front than just about keep pace with the UK. New Zealand, of course, couldn’t even manage that.
If Britain is searching for lessons and models in a post-referendum world, New Zealand might offer a model of good intentions. As for outcomes, not so much.
.
