Last week, Statistics New Zealand published the backdated results from their revamp of the HLFS. It didn’t get very much coverage, apart perhaps from the headline result, in which the estimate for the unemployment rate for the March 2016 quarter is now 5.2 per cent, down from 5.7 per cent previously.
The change arises mostly because Statistics New Zealand has reclassified those searching for a job by checking websites as not unemployed – to be “unemployed” for these statistical purposes one has to be out of work, available to start work, and actively seeking work. Previously, those using just newspaper adverts were classified as passively seeking work, while people using other search mechanisms were treated as actively seeking work, and thus included with the officially unemployed. 20 years ago web-based advertising was either non-existent or almost relevant, and now to a large extent it dominates the market. Fortunately, SNZ had enough data to produce backdated estimates on the new definition back to 2007 (any differences prior to that appear to be very small).
The change brings the New Zealand definition of unemployment into line with the recommendations of the ILO, and seems sensible on its own merits – there isn’t any good reason to treat newspaper and web searches differently for these purposes.
The headline difference in the unemployment rate is quite large. But all the gap opened up some years ago.

And here is the difference in the two series.
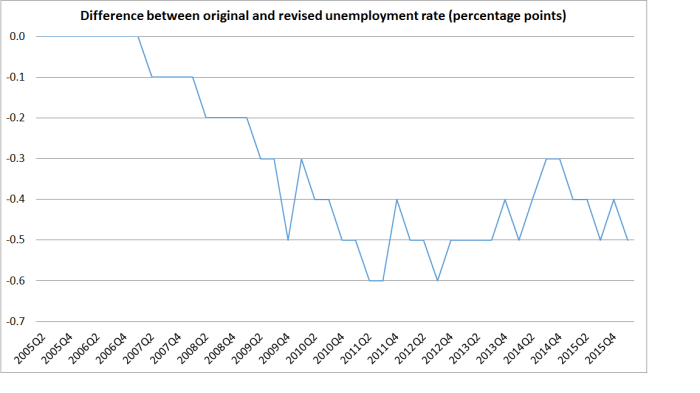
So, in essence, the data for the last six years aren’t materially affected by the revision and the new methodology: the new series is lower than the old series throughout, but by a fairly constant margin. The unemployment rate didn’t fall much from the recessionary peak on the old methodology and didn’t fall much on the new methodology. For example, on the old method the unemployment rate was 6.1 per cent in December 2013, just before the ill-fated tightening cycle began. Since then, on the old methodology the unemployment rate has fallen by 0.4 percentage points. On the new methodology, it was 5.7 per cent in December 2o13, and has fallen by 0.5 percentage points to 5.2 per cent.
But the new series does throw up a couple of questions. The first is about international comparability. As I noted, the SNZ release noted that the new methodology was more consistent with ILO recommendations. That is good on its own terms. But I was curious as to whether other countries were following ILO recommendations (yet) in this area. I’ve known of other cases – household debt was an example – where we improved New Zealand data, drawing more into line with international standards, only to find that the international comparability wasn’t really improved because most other countries we were interested in weren’t yet following international guidelines.
So I asked SNZ whether they had any sense of how other countries were doing on this particular issue. I got a full and prompt response from the manager of their Labour and Income Statistics area. The short answer was that some countries seem to comply in this area, and others don’t. Perhaps fortunately for us, both Australia and the US appear to treat looking at (newspaper and online) adverts the same way we do – passively seeking work, rather than actively seeking work. But, on the other hand, Eurostat treats looking at adverts as actively seeking work. It is a reminder that simple levels comparisons of unemployment rates across countries often doesn’t involve (strictly) comparing apples with apples. Comparing changes within over time within individual countries should still be valid.
The other question is how to think about the normal/natural/non-inflationary rate of unemployment. At 5.2 per cent, our unemployment rate is still a long way above the pre-recessionary lows (3.3 per cent) – by contrast in the US and the UK, the recessionary increase in the unemployment rate has been fully unwound. But the gap between 5.2 per cent and 3.3 per cent is materially less than that between 5.7 per cent and 3.4 per cent (on the old methodology). Since most everyone thought that the unemployment rate prior to the recession was below the natural or non-inflationary level, does this new data raise questions as to whether the current unemployment rate might be not far from the NAIRU?
I don’t think there is any easy answer to that question. Only time will tell. As happened in the US and the UK we – and the Reserve Bank – need to see what happens, to wage and price inflation, as the unemployment rate gets down to the mid to low 4s (one hopes the Reserve Bank allows us the chance to see). But don’t rule out the possibility that the NAIRU itself has been falling – as it was widely perceived to have done in both the US and New Zealand in the 1990s and 2000s.
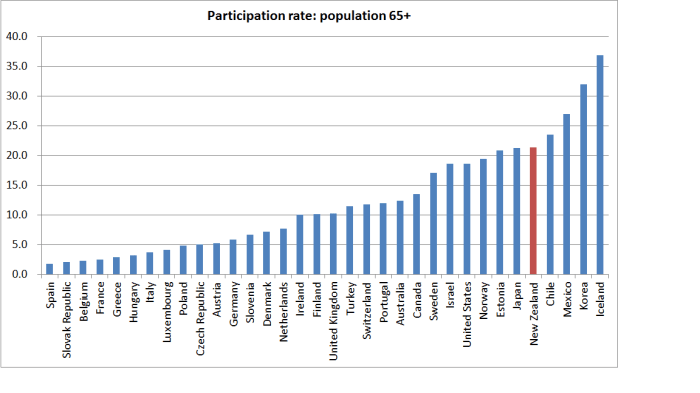
One reason why it might fall is the growing importance of old people in the labour market. Of all the OECD countries, New Zealand has seen the largest increase in the participation rate of older people (65+) in the 20 years since 1995 – rising from 6 per cent to 21 per cent. .And we now have the fifth highest participation rate for the over 65s among the OECD countries.
 And the unemployment rate among older people is very low indeed – before the recession and now both around 1.5 per cent. That makes sense – older people have New Zealand Superannuation to fall back on, with no work test, so there is typically no urgency to find another job (to be “actively seeking”). But it is a very different – and less cyclical – unemployment rate than that for the rest of the workforce.
And here is the share of the over 65s in the labour force. Even just over the last decade, the share has increased from 2.6 per cent to 5.8 per cent of the total labour force.
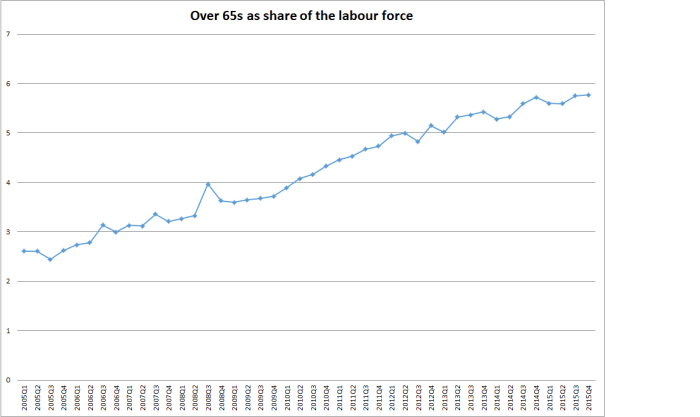
With such a low unemployment rate among this (rapidly growing) part of the workforce, the overall unemployment rate (actual and natural) should be trending lower over time, all else equal.
How material this proves to be remains to be seen. But a line I often used to use in debates about unemployment is that if everyone spent a year officially unemployed (available and actively seeking work) in a 45 year working life, that would produce an unemployment rate of only around 2.2 per cent. For many people, a full year officially unemployed is a very long time – more than a few people are probably like me, having spent over 30 years in the labour force and not a day officially unemployed. We need to be guided constantly by the data, but we shouldn’t rule out the possibility that the NAIRU could keep falling quite a long way (and perhaps especially while the NZS age remains at 65).
This is my last post for a week or so. The school holidays start tomorrow and we’ll be away for a while. I should be back writing here on 18 July – I might even still find something to say about the speech on housing (and housing finance) Deputy Governor Grant Spencer is due to deliver this evening.
