Recovering

It is very difficult to get a good sense right now of how much excess capacity there is, here or other countries  In New Zealand’s case, part of that is about the gross inadequacies of our official statistics.  We are one of only two OECD countries without official monthly employment/unemployment data (the other is Switzerland) –  and if this has been a long-running deficiency, it seems more striking than ever from a government that amended the central bank act to highlight the focus it wanted on avoiding as much as possible excess labour market capacity.

Of course, there is a variety of less formal, or less fit-for-purpose, partial indicators.  We know how many people get the unemployment benefit but many people looking for work are not (rightly in my view) eligible for the unemployment benefit.  There is a new SNZ indicator using IRD data and providing a monthly employment indicator which should be quite useful in normal times, but isn’t when the government is paying firms to keep people notionally on the payroll, even if doing little or no work.   And although SNZ collects HLFS survey data steadily through the quarter, they seem uninterested in making even that partial monthly data available (larger margins of error as it would inevitably have).    We’ll only finally get the June quarter HLFS data in August.

There are other hints of excess capacity.  The wage subsidy scheme paid out in respect of some staggering share (around half) of New Zealand workers and the self-employed, but that is now very backward-looking since the bulk of the eligibility related to the severe regulatory restrictions on many/most business during the government’s so-called “Level 4” period, from late March to late April.     Most of the employees covered would not have been made unemployed even if no wage subsidy had then been on offer.

The new wage subsidy scheme comes into effect this week.  The rules were tweaked again last week, and although this scheme only covers eight weeks (rather than twelve in the original scheme), the expected cost (close to $3.5 billion) suggests a lot of excess capacity still exists, or is expected to exist.  Not, of course, that we have any official data on that.

Of course, other countries have also had the mix of regulatory restrictions (“lockdowns”), self-chosen reductions in social and commercial activity, and the impact of the sharp disruption to world economic activity.   Labour is generally not being particularly fully-employed at present.  But in most advanced countries, even those with monthly labour force survey data, this excess capacity does not really show up in the official unemployment rate at present –  after all, most other countries have deployed some form or other of fiscal support designed to keep workers attached to firms, even if for now they are doing little or nothing.   In most countries, the monthly official unemployment rate has risen this year, but mostly not by much (and there are vagaries in the statistics such that in Italy the official unemployment rate has fallen).

Only three OECD countries are reporting really large increases in their official unemployment rates.  These are percentage points changes this year to date.

Canada                                                  +8.1

Colombia (new to the OECD)           +9.5

United States                                       +9.8

The US numbers came out on Friday night.  There is some controversy about the monthly change, but all the caveats (including those from the BLS themselves) suggest that the “true” or “underlying” number is even higher than the reported number.

I’m not putting much weight on Colombia (knowing almost nothing about it), but we have every reason to suppose that the dislocation of the economy in New Zealand over recent months in New Zealand was at least as large as those in the US and Canada (whether one looks at a regulatory restrictions index, mobility data, or stylised indicators like the degree of dependence on the labour-intensive foreign tourism sector).  Forecasts of the drop in June quarter GDP are higher for New Zealand than for most other advanced countries.

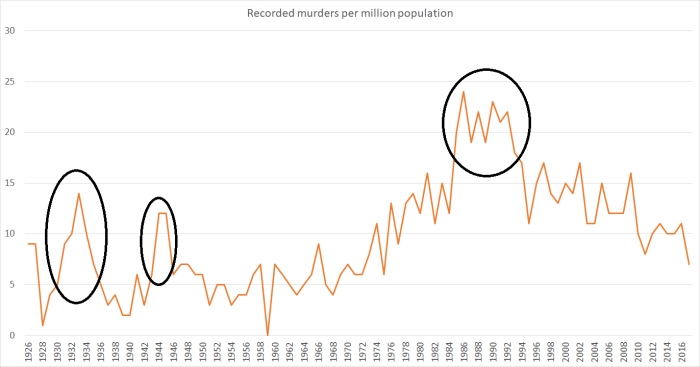
The “true” increase in excess capacity to last month (the US and Canadian data are for May) in New Zealand is almost certain to have been at least as large as those in the US and Canada.    One might think in terms of an unemployment rate equivalent of at least 13 per cent, which would be (by some margin) the worst New Zealand had experienced since the 1930s.

One can debate the merits of the wage subsidy scheme –  and even more so the extended version, which seems focused on tying workers to firms that are least likely to recover any time soon, if ever – but without it we would have a much clearer sense of just how severe the labout market excess capacity actually is.  (Even if, as I have favoured, one took a more generous approach to individuals facing serious income loss this year.)    Perhaps even when all the wage subsidy schemes have passed the official unemployment rate will be “only” in the high single figure range –  although if the schemes expire in September I’m still sceptical of that –  but for now it is all but certain that the excess capacity in the labour market, that needs reabsorbing one way or the other, is well into double-digit percentages.  And political debate about what needs to be done should operate with those sorts of numbers in mind.

On which note, I’ve been reflecting over the last few days on what it takes to see full employment restored.   It isn’t like, for example, everyone simply coming back to work after the summer holidays.   Everyone –  individuals and firms –  planned on summer holidays and planned on returning.  By contrast, even in New Zealand with (for now) almost no Covid, that isn’t the parallel at all.  The income lost over the last couple of months – probably well in excess of $20 billion, relative to normal expectations – isn’t coming back.  The border is still largely closed. The virus still stalks the earth, with associated heightened uncertainty.  The world economy is in a severe recession and (rightly or wrongly) almost all forecasters think it will take several years for activity levels to get back to normal.  So if wealth has taken a hit already, and some significant sources of external demand are either restricted (by regulation) or impaired, where is the demand going to come from to quickly reabsorb workers who are either already displaced, or who are hanging in some temporary wage-subsidy limbo.

You see occasional talk of people “doing their bit” for New Zealand businesses by going out and spending more than usual, but it is a bit hard to envisage it happening on any significant or sustained scale.  I tried some introspection.  My household hasn’t been materially adversely economically affected by Covid shocks, and there doesn’t seem to be any material employment risk.  And yet we aren’t spending any more than usual, possibly a bit less.  Why would it be otherwise?   We’ll have a break in the school holidays, but then we always do (and when we booked the other day it was a bit shorter than it might have been, Auckland Museum having had to cancel/postpone the exhibition we hoped to see). Many shops are still a pain to go in to.   And I find myself still slightly shell-shocked after the last few months and a bit more cautious and abstemious than otherwise.  And if I thought about “doing my bit” on any serious scale – there are always jobs around the house than could be done –  then I’d contemplate the dramatic change in the fiscal position.  I’m not suggesting some full-blown Ricardian effect here, but (whether I approved of the scheme or not) it seems rather less likely than it was a few months ago that my kids will get fees-free tertiary education, and even if a centre-right government were to be elected  tax cuts seem less likely than they did.  And even prospects for the kids to get part-time jobs don’t seem what they were (and there are probably people needing the jobs more anyway).  Oh, and I’m conscious that another round of Covid restrictions, and economic dislocation, isn’t impossible or even unlikely.

Perhaps you are different.  Perhaps you are energetically contemplating spending more aggressively.  But I suspect most people won’t be, even those (notably in the public sector) fairly confident of keeping their jobs).

In a typical serious recession, changes in incentives (relative prices) do quite a lot of the work.   Lower real interest rates ease pressure on the most-indebted but (more importantly) they draw spending forward.  Often those changes in real interest rates have been rather large.  Sometimes, tax rates (income or consumption) are cut.  And, particularly in countries with a fair bit of foreign debt and not typically treated as international safe-havens (or home bases for pools of savings), the exchange rate falls a lot, drawing demand (from locals and foreigners) towards New Zealand.  Oh, and of course sometimes the government itself does a lot more direct spending on goods and services.

(Oh, and of course there is always pro-productivity and pro-investment micro reforms but…….this is modern New Zealand.)

The key point is that if, at some like current real wages, we are to get back fairly quickly to full employment (which, in my view, should be a high policy priority, given the dreadful scarring effects sustained periods of unemployment can have on some individuals) it needs quite a lot of people to spend quite a bit more than they otherwise would, to replace the demand that has (for now at least) disappeared or been somewhat impaired).

Of those mechanisms:

  • real interest rates have barely changed.    The Reserve Bank can huff and puff all it likes about possible portfolio balance effects etc from its LSAP programme, but if they don’t change prices in ways that encourage more spending than was happening at the start of the year (and they haven’t) it is really little more than sound and fury (and, just possibly, having stopped things getting worse),
  • the exchange rate is now about the same level it averaged last year,
  • consumption tax rates haven’t changed, and although there have been some business tax changes (a) most of the effects will be intra-marginal (flowing to people who woin’t change their behaviour, and (b) uncertainty is very bad for business investment (ie even if the effects are in the right direction, they are likely to be very weak for now)

The government is, of course, spending a lot.  Most of that isn’t direct spending on goods and services  (consumption and investment) but income transfers in one guise or another.  Even there however, the largest and most concentrated spend has already happened over the last three months (with some more in the next couple of months).

From the “fiscal hawk” side of the debate, one hears quite a bit of worry about fiscal excess and heavy future burdens.  I come and go on how sympathetic I am to those complaints and warning, but mostly I end up not being that sympathetic (and I noticed over the weekend a centre-right UK think-tank, Policy Exchange, taking what appeared to be a similar stance, of for different reasons).  And why?  Because if we are concerned at all about getting people back into work faster than simply allowing nature to take its course –  recessions will heal themselves eventually, but it could take quite a few years (perhaps tourism will be back to normal levels in 2025?) –  someone (many actually) have to be willing to spend more now than they were otherwise planning to.  I’d much prefer that monetary policy were doing its job –  not just here, but in Australia and most other developed countries –  because I think much lower interest rates and a much lower exchange rate would do a lot (as they did after 1933, 1967, 1991, 1998, and 2008/09), by changing relative prices/incentives, but it isn’t.   And with a hole this deep –  and borrowing costs this low (which don’t make fiscal policy a “free lunch”) and on-market borrowing this easy – it would imprudent for fiscal policy to be doing no more than just letting the automatic stabilisers work.  And, in truth, at least on the domestic interest rate leg, letting monetary policy do its job also involves people taking on more debt now than they’d otherwise planned to (voluntarily chosen and all that, but debt nonetheless).

If we are starting from (effectively) perhaps double-digits effective rates of unemployment, it is far from clear that anything like enough macro policy stimulus is being done.  If fiscal policy hasn’t reached its political limits –  it is nowhere near the market limits, but neither should we test those –  it must be much closer than it was and, on the other hand, monetary policy is doing almost nothing.  That is really inexcusable, If Orr and the rest of the MPC want to take on themselves some sort of mantle of Hayek or Mellon (as caricatured) as do-nothing liquidationists, Robertson, Ardern Peters, Shaw (and, it seems, Muller and Goldsmith) shouldn’t be standing idly by, by default offering their imprimatur.

(The post was headed “Recovering”: unfortunately, I am doing so only slowly from some bug I’ve picked up, so posts this week may continue to be patchier than I’d like.)

Where in the world is inflation?

According to the IMF these are the countries that will have an inflation rate in excess of 20 per cent this year.

Turkey 20.3
Liberia 27.2
Yemen 30.0
South Sudan 40.1
Zimbabwe 42.1
Argentina 47.6
Islamic Republic of Iran 51.1
Sudan 72.9
Venezuela 1555146.0

I’m guessing there is some margin of error around that curiously specific estimate for Venezuela.

In most of these countries, inflation is forecast to be higher this year than it was last year.  Here is one stark example.

arg infl

It can be done –  although one might well wish to avoid the Argentine experience.

On the other hand, the IMF also forecasts that there will be 13 countries with 2019 inflation rates of 0.5 per cent or less.    (The median inflation rate across all countries this year is expected to be 2.4 per cent.)

In the advanced economies there isn’t much sign of any rebound in (core) inflation

core inflation 19

What about expectations?    Bond yields are falling again, and not all of it seems to be falling real rates.  Here is a chart I saw yesterday showing implied five year forward expectations for average inflation in the euro-area.

euro infl swaps

That is a long way below 2 per cent.

Things aren’t as bad in the US.  Here is the latest chart for 10 year inflation breakevens.

US breakevens may 19

And in both Australia and New Zealand the gap between indexed and conventional government bond yields is not much more than 1 per cent.  That is a long way from the 2.5 per cent and 2.0 per cent targets respectively.

This was a bit of context for the last IGM survey of economics academics that I saw the other day.

IGM Fed

I guess the question was asked in the specific context of the aborted nominations of Stephen Moore and Herman Cain, but it is posed more generally.

I’d probably have answered the same way, especially bearing in mind the way the question is phrased (note that “primarily”).  Apart from anything else, choosing anyone for anything primarily based on their political views is a recipe for trouble (even in Cabinet or the organisational side of a political party one usually wants competence as well).

And yet, and yet.  It is hardly as if the actual monetary policymakers in much of the advanced world have done such a great job in the last decade that things couldn’t have been improved on.  Arguably, the US Federal Reserve has done better than most central banks, but even then it was hardly a record to write home about (slow to recognise the recession in the midst of it, constantly champing at the bit to tighten afterwards, nothing done to prepare for the next serious recession etc).

When I was young the predominant narrative around central banks was that one needed to keep politics and politicians clear, because otherwise high inflation would be a recurring –  perhaps permanent –  problem.  I’ve long been fairly sceptical of that view, even as an explanation for history during the Great Inflation, but look at where we’ve been for the last decade, with inflation sitting below target in most advanced countries even as unemployment was (for a long time) slow to fall.    It isn’t impossible that in those specific circumstances (even if not generally) monetary policy decisionmakers with a stronger political focus might have done less badly than the actual decisionmakers did.   That, at least, should have been the out-of-sample forecast of the more vocal champions of technocratic rule if this argument had been run a decade ago.   (Of course, political bias can cut both ways: there have been both technocrats and politically-attuned people on the right in the last decade championing the case for higher interest rates, arguing that if anything raising interest rates pre-emptively might assist in rebalancing the economy.)

I’m not arguing to junk professional expertise when it comes to monetary policy, any more than one should in any other area of policy, but in and around monetary policy the limits of technical expertise are pretty real and substantial (or we’d have easy compelling and generally accepted answers to the issues of the last decade) and it isn’t obvious that professional experts are necessarily the best final decisionmakers.  In the face of great uncertainty, I’m increasingly inclined to think that the decisions should rest more squarely with those who are electorally accountable –  drawing on professional expertise to the extent it can help, but recognising the need for contest, scrutiny, and considerable scepticism about the best insights of institutional “experts”.  In that world, central bankers provide analytical inputs, and operational implementation of policy choices, but have less weight in the policymaking itself.

In a New Zealand context, it was sobering to read the other day that the UK statistics office had just announced that the British unemployment rate had fallen to the lowest rate since 1975 (and the US unemployment rate is the lowest since 1969), without inflation having become an obvious problem.    In New Zealand, the unemployment rate in 1975 was about 2 per cent.  Just to get back to the lowest unemployment rate this century in New Zealand we’d need to see a drop of another 0.9 percentage points.   In view of our central bank’s statutory mandate around “maximum sustainable employment” it would be interesting to see their analysis of why we can’t manage something like that.  Perhaps there are regulatory or welfare obstacles (eg high minimum wages relative to median wages) –  and if so, central banks can’t do much about those – but with inflation still persistently a bit below target, it sure looks as though New Zealand’s unemployment rate could be a bit below 4.3 per cent without creating inflationary trouble.


Human costs of big dislocations?

Puzzling the other day about the Prime Minister’s extraordinary performance –  tears at her official scheduled press conference, purporting to apologise on behalf of all New Zealanders for a single (awful) crime committed by a single private individual (and could we have imagined such a performance from Margaret Thatcher, Helen Clark, Golda Meir, Indira Gandhi, Angela Merkel or any serious male leader?) I was wondering whether she was about to cry in public about the many other murders that happen each year in New Zealand –  45 to 50 in a typical year.

But when checking out that number, I found a nice time series prepared by the Police reporting the number of New Zealand murders annually since 1926, drawn from a search of their records.   As they note

Note that counting rules for murder statistics have changed over time (i.e. cases vs offences vs victimisations). Therefore, trend for homicide statistics over a long period (especially before 2007) should be interpreted with caution.

In other words if you want to compare the 2016 murder rate with that in 1926 you have been warned: the numbers may not be calculated in quite the same way.  But shorter-term movements should still be meaningful, even allowing for a bit of year-to-year fluctuation.   Fortunately, mass killings (eg Aramona) don’t happen every year.

This was the resulting graph (I hope they are right about zero murders in 1958, but it seems unlikely).

murders

I’ve circled a few surges that caught me by surprise:

  • the first was the apparently significant increase in the murder rate during the Great Depression –  by far the worst economic downturn and social dislocation in New Zealand in the last century,
  • the second was late in World War Two (those years don’t include the Stanley Graham shootings in 1941),
  • and the third was the period of rapid economic change and, latterly, very high unemployment over the late 1980s and early 1990s.

Are these surges just coincidental-  something largely random that masquerades as a pattern?  I don’t know, and I don’t know the literature at all in this area.  There were certainly global forces at work in the rise of violent crime in the 1970s and 80s, and in the subsequent decline, but it does look uncomfortably like a story in which –  at least in New Zealand –  big economic dislocations and high unemployment were associated with higher murder rates. I once wrote a speech for Don Brash –  as Governor –  in which we associated higher suicide rates with such dislocations (and hence why we needed good stable macro policy).  I’ve always been a bit embarrassed about it –  without evidence it probably over-egged the pudding –  but perhaps we were closer to the mark than I’d thought?

In terms of international experience, on a quick look I found this chart

murder us

The US data are easiest to read, and they don’t show the spikes we see in the New Zealand data  (it is a much bigger population, and so perhaps the New Zealand picture is just a small sample problem).    In Canada there is some suggestion of a spike in murder rates during the Great Depression, but not in Australia (where the depression was severe) or England and Wales (where it was not so bad).

I’m convinced good monetary policy has an important role to play in helping to avoid –  and limit – really bad economic dislocations.  High unemployment is quite scarring enough –  costly to individuals and to society as a whole –  but if it was associated with higher murder rates then doubly so.

Anyway, on such weak evidence I”m not trying to make strong arguments.  But I thought it was an interesting, somewhat surprising, chart, and perhaps experts have dug more deeply into these patterns.

Meantime, there many other gross failures of policy –  ones that are the direct responsibility of government –  that we see and hear no emotion from the Prime Minister about.  Prime Ministerial tears should, of course, be reserved to the privacy of the Prime Minister’s own home, but some genuine passion and energy about reversing the house price scandal or the decades of productivity underperformance –  both of which are likely to have cost lives, and certainly represented huge lost opportunities – would be welcome.  Or, rather nearer the justice system –  but this time the even more hands-on direct responsibility of central government –  there was the gross abuse one young New Zealander suffered (and still suffers) from the Crown in this episode, highlighted in this post.

Estimating NAIRU

The Reserve Bank of New Zealand has long been averse to references to a “natural rate of unemployment” or its cognate a “non-accelerating inflation rate of unemployment” (NAIRU).  It started decades ago, when the unemployment rate was still very high, emerging from the structural reforms and disinflation efforts of the late 80s.  We didn’t want to lay ourselves open to charges, eg from Jim Anderton, that we regarded unemployment as natural or inevitable, or were indifferent to it, let alone that we were in some sense targeting a high rate of unemployment.   Such a criticism would have had little or no analytical foundation –  we and most mainstream economists held that a NAIRU or “natural” rate of unemployment was influenced largely by labour market regulation, welfare provisions, demographics, and other structural aspects (eg rate of turnover in the labour market) that were quite independent of monetary policy.  But the risk was about politics not economics, and every election there were parties looking to change the Reserve Bank Act.  And so we never referrred to NAIRUs if we could avoid it –  which we almost always could –  preferring to focus discussions of excess capacity etc on (equally unobservable) concepts such as the output gap.  In our formal models of the economy, a NAIRU or a long-run natural rate could be found lurking, but it made little difference to anything (inflation forecasts ran off output gap estimates and forecasts, not unemployment gaps).

Other central banks do things a bit differently, perhaps partly because in some cases (notably Australia and the US) there is explicit reference to employment/unemployment in monetary policy mandates those central banks are working to.   In a recent article, the Reserve Bank of Australia observed that

“When updating the economic forecasts each quarter, Bank staff use the latest estimate of the NAIRU as an input into the forecasts for inflation and wage growth”

It may not make their monetary policy decisions consistently any better than those here, but it is a difference in forecasting approach, and in how the RBA is prepared to talk about the contribution of unemployment gaps (as one indicator of excess capacity) to changes in the inflation rate.

I’ve been arguing for some years –  first inside the Bank, and more recently outside –  that our Reserve Bank put too little emphasis (basically none) on unemployment gaps (between the actual unemployment rates and the best estimate of a NAIRU).  It has been the only central bank in the advanced world to start two tightening cycles since 2009, only to have to reverse both, and I had noted that this outcome (the reversals) wasn’t that surprising when for years the unemployment rate had been above any plausible estimate of the NAIRU.   The Bank sought to fob off criticisms like this with a new higher-tech indicator of labour market capacity (LUCI) –  touted by the Deputy Governor in a speech, used in MPSs etc – only for that indicator to end badly and quietly disappear.

But since the change of government  –  a government promising to add an explicit employment dimension to the Bank’s monetary policy objective (now only 12 days to go til the new Governor and we still haven’t seen the new PTA version) –  there has been some pressure for the Bank to be a bit more explicit about how it sees, and thinks about, excess capacity in the labour market, including through a NAIRU lens.  In last month’s Monetary Policy Statement, they told us their point estimate of the NAIRU (4.7 per cent) and in the subsequent press conference, the Governors told us about the confidence bands around those estimates.  All this was referenced to an as-yet-unpublished staff research paper (which still seems an odd inversion – senior management touting the results before the research has had any external scrutiny).

Last week, the research paper was published.  Like all RB research paper it carries a disclaimer that the views are not necessarily those of the Reserve Bank, but given the sensitivity of the issue, and the reliance on the paper at the MPS press conference, it seems safe to assume that the paper contains nothing that current management is unhappy with.  What the new Governor will make of it only time will tell.

There was interesting material on the very first page, where the authors talk about the role of monetary policy.

The focus of monetary policy is to minimise fluctuations in cyclical unemployment, as indicated by the gap between the unemployment rate and the NAIRU, while also maintaining its objective of price stability.

I would very much agree.  In fact, that way of stating the goal of monetary policy isn’t far from the sort of wording I suggested be used in the amended Reserve Bank Act. Active discretionary monetary policy exists for economic stabilisation purposes, subject to a price stability constraint.  But the words are very different from what one has typically seen from the Reserve Bank over the years (including, for example, in their Briefing to the Incoming Minister late last year).

But the focus of the research paper isn’t on policy, but on estimation.  The authors use a couple of different techniques to estimate time-varying NAIRUs.   Since the NAIRU isn’t directly observable, it needs to be backed-out of the other observable data (on, eg, inflation, wages, unemployment, inflation expectations) and there are various ways to do that.   The authors draw a distinction between a “natural rate of unemployment” and the NAIRU: the former, conceptually is slower moving (in response to changes in structural fundamentals –  regulation, demographics etc), while the NAIRU can be more cyclical but tends back over time to the longer-term natural rate.  I’m not myself convinced the distinction is that important –  and may actually be harmful rhetorically –  but here I’m mostly just reporting what the Bank has done.

The first set of estimates of the NAIRU are done using a Phillips curve, in which wage or price inflation is a function of inflation expectations, the gap between the NAIRU and the unemployment rate, and some near-term supply shocks (eg oil price shocks).  Here is their chart showing the three variants the estimate, and the average of those variants.

nairu estimates.png

Perhaps it might trouble you (as it does me) but the authors never mention that their current estimates of the New Zealand NAIRU, using this (pretty common) approach, are that it has been increasing for the last few years.    Frankly, it doesn’t seem very likely that the “true” NAIRU has been increasing –  there hadn’t been an increase in labour market regulation, the welfare system hadn’t been becoming more generous, and demographic factors (a rising share of older workers) have been tending to lower the NAIRU.

As it happens, the authors have some other estimates, this time derived from a small structural model of the economy.

NAIRU NK

Even on this, rather more variable, measure, the current central estimate of the NAIRU is a bit higher than the authors estimate it was in 2014.    But the rather bigger concern is probably the extent to which over 2008 to 2015, the estimated NAIRU on this model seems to jump around so much with the actual unemployment rate.   Again, the authors offer no thoughts on why this is, or why the pattern looks different than what we observed in the first half of their sample.  Is there a suggestion that the model has trouble explaining inflation with the variables it uses, and thus all the work is being done by implicitly assuming that what can’t otherwise be explained must be down to the (unobserved) NAIRU changing?   Without more supporting analysis I just don’t find it persuasive that the NAIRU suddenly shot up so much in 2008/09.   For what it is worth, however, do note that the actual unemployment rate was well above the NAIRU (beyond those grey confidence bands) for years.

Here is what the picture looks like when both sets of estimates are shown on the same chart.

nairu x2

On one measure, the NAIRU fell during the 08/09 recession, and on the other it rose sharply.  On one measure the NAIRU has been steadily rising for several years, while on the other it has been jerkily falling.  No doubt the Bank would like you to focus on the end-point, when the two sets of estimates are very close, but the chart does have a bit of a “a stopped clock is right twice a day” look to it.   When the historical estimates coincide it seems to be more by chance than anything else, with no sign of any consistent convergence.

I noted the end-point, where the two estimates are roughly the same.  But end-points are a significant problem for estimating these sorts of time-varying variables.  The authors note that in passing but, somewhat surprisingly, they give us no sense of how material those revisions can be, and have been in the past.  I went back to the authors and asked

I presume you’ve done real-time estimates for earlier periods, and then checked how  –  if at all –  the addition of the more recent data alters the estimates of the NAIRU for those earlier periods, but if so do you have any comments on how significant an issue it is?

To which their response was

An assessment of the real-time properties of the NAIRU and the implied unemployment gap was beyond the scope of our paper.

Which seems like quite a glaring omission, if these sorts of model-based estimates of a time-varying NAIRU are expected to play any role in forecasting, or in articulating the policy story (as the Governors did in February).

As it happens, the Reserve Bank of Australia published a piece on estimating NAIRUs etc last year.  As a Bulletin article it is a very accessible treatment of the issue.   The author used the (reduced form) Phillips curve models (of the sort our Reserve Bank used in the first chart above).

nairu rba

The solid black line is the current estimate of Australia’s NAIRU over the whole of history.  But the coloured lines show the “real-time” estimates at various points in the past. In 1997 for example (pink line) they thought the NAIRU was increasing much more –  and thus there was less excess labour market capacity –  than they now think (or, their model now estimates) was the case.  In 2009 there was a stark difference in the other direction.  Using this model, the RBA would have materially underestimated how tight the labour market actually was.

It would be surprising if a comparable New Zealand picture looked much different, but it would be nice if the Reserve Bank authors would show us the results.   These end-point problems don’t mean that the model estimates are useless, but rather that they are much more useful for identifying historical NAIRUs (valuable for all sorts of research) than for getting a good fix on what is going on right now (the immediate policy problem).    That is true of many estimates of output gaps, core inflation (eg the RB sectoral core measure) and so on.

Having said that, at least the Australian estimates suggest that Australia’s NAIRU has been pretty steadily falling for the last 20 years or so, with only small cyclical dislocations.  Quite why the Reserve Bank of New Zealand’s Phillips curve models suggest our NAIRU has been rising –  when demographics and welfare changes typically point the other way –  would be worth some further examination, reflection, and commentary (especially if Governors are going to cite these estimates as more or less official).

Comparing the two articles, I noticed that the RBA had used a measure of core inflation –  their favoured measure, the trimmed mean –  for their Phillips curve estimates, while the RBNZ authors had used headline CPI inflation (ex GST).  Given all the noise in the latter series – eg changes in taxes and government charges –  I wondered why the authors didn’t use, say, the sectoral factor model estimate of core inflation (the Reserve Bank’s favoured measure).  It would be interesting to know whether the NAIRU results for the last half decade (when core inflation has been very stable) would be materially different.  It might also be worth thinking about using a different wages variable. The authors use the headline LCI measure, as a proxy for unit labour costs. But we have actual measures of unit labour costs (at least for the measured sector), and the authors could also think about using, say, the LCI analytical adjusted series and then adjusting that for growth in real GDP per hour worked (a series that has itself been revised quite a bit in the last year).  No model estimate is going to be perfect, but there does seem to be some way to go in refining/reporting analysis research in this area.

I have argued previously that the Reserve Bank should be required to report its estimates of the NAIRU, and offer commentary in the MPS on the contribution monetary policy is making to closing any unemployment gaps.   I’d have no problem with the Bank publishing these sorts of model estimates, but I’d have in mind primarily something a bit more like the Federal Reserve projections, in which the members of the (new, forthcoming) statutory Monetary Policy Committee would be required to publish their own estimates of the long-run sustainable rate of unemployment that they expect the actual unemployment rate would converge to (absent new shocks or structural changes).  The individual estimates are combined and reported as a range.  No doubt those individual estimates will have been informed by various different models, but in the end they represent best policymaker judgement, not the unadorned result of a single model (end-point) problems and all.

And finally, the Reserve Bank (aided and abetted by the Board) has always refused to concede it made a mistake with its (eventually reversed) tightening cycle of 2014 –  sold, when they started out, as the beginning of 200 basis points of increases.  The absence of any emphasis on the unemployment rate, or unemployment gaps, was part of what got them into trouble.  In the latest research paper there is a chart comparing the Bank’s current estimates of the NAIRU (see above) with their current estimates of the output gap.

nairu and output gap

The tightening cycle was being foreshadowed in 2013, it was implemented in 2014, it was maintained well into 2015.  And through that entire period, their unemployment gap estimates were outside the range of the output gap estimates.

We don’t have their real-time estimates of the unemployment gap, but we do have their real-time output gap estimates.  They might now reckon that the output gap in mid 2014 (blue line) was still about -1 per cent but in the June 2014 MPS they thought it was more like +1.5 per cent.

output gap from june 2014 mps

The failure to give anything like adequate weight to the direct indicators of excess capacity from the labour market (ie the unemployment rate and estimates of the NAIRU) looks –  as it felt internally at the time – to have contributed materially to the 2014 policy mistake.

(In this post, I’m not weighing into the specific question of what exactly the level of the NAIRU is right now, and the Bank does emphasise that there are confidence bands around its specific estimates, but I’m aware that is also possible to produce estimates in which the current NAIRU would be 4 per cent or even below.)

Active monetary policy exists because unemployment matters

Monetary policy as we know it today –  discretionary choices made by central banks (or Ministers) –  is a relatively new thing.    Of course, money has been around for a very long time, and the state has often had a role in specifying the metal content of various units of money, and (not unrelatedly) what money was acceptable in settlement of tax obligations.  But there was no such thing as “monetary policy” in, say, the 16th century –  when prices rose across Europe, it was because the additional gold and silver being mined in South America, adding to purchasing power of (first) Spaniards and then more generally.     The gold rushes of the mid 19th century –  in which New Zealand had a small part –  had qualitatively similar effects.

Even in the heyday of the classical Gold Standard –  the few decades prior to World War One –  when central banks did exist in a growing number of countries (although not, for example, the US, Australia, Canada or New Zealand, there wasn’t much to monetary policy.  Convertibility into gold, at a fixed (government-set) parity, was at the heart of the regime, and variations in official interest rates –  eg by the Bank of England or the Banque de France – were largely about managing pressures on gold reserves.   If there was a net loss of reserves from the UK, the Bank of England would typically raise its interest rates.  It wasn’t a mechanical process, and central banks would at times borrow from each other to tide themselves over what were thought to be purely temporary pressures.   In places without central banks –  New Zealand was an example –  banks were obliged by law to convert their notes into gold on demand.  Banks themselves had to manage pressures on their own reserves –  whether gold, or balances held with banks in London –  by altering the interest rates they offered, and varying their credit standards (tightening credit would reduce demand for imports).

Across much of the world, World War One disrupted these arrangements.  New Zealand suspended gold convertibility on the outbreak of the war, and never restored it.  Much of the world attempted to go back onto gold in the 1920s – the UK famously restoring convertibility in 1925 –  as part of trying to restore normalcy and monetary stability.  But the restoration didn’t last.  Many authors see the attempt to return to gold, in a somewhat hybridized manner, as a key cause of the Great Depression, and by the mid 1930s the Gold Standard had been largely abandoned.  The imperatives of short to medium-term macroeconomic stabilisation displaced the belief in fixed parities.  Voters –  this was the new age of universal suffrage –  demanded that governments “do something”.  And the evidence is pretty clear that countries that went off gold earliest –  or devalued earliest –  recovered soonest from the Depression.  The imperative of doing something about really severe cyclical unemployment drove monetary actions and monetary regime choices, including the establishment in 1934 of the Reserve Bank of New Zealand.

There was an attempt after World War Two to re-establish something that looked like a system based on gold (the US offered governments –  only –  convertibility into gold, while other countries had fixed exchange rates to the US dollar), but it was a much different beast.  Most countries had quite tight controls on cross-border capital flows –  of the sort that had not previously existed in peacetime in democratic societies –  which allowed countries to use counter-cyclical domestic fiscal and monetary policy to do more to promote something akin to full employment, without too readily putting the exchange rate pegs in jeopardy.   It didn’t end the business cycle (of course), and didn’t avoid periodic exchange rate crises but for a time –  a couple of decades –  it more or less worked.  But pushed too far, under pressure of various political and demographic shocks, it broke down into the era of the Great Inflation –  loosely, from around the mid 1960s to the mid 1980s.

And thus monetary policy as we recognise it today really only dates back a few decades.  The major Western economies floated their exchange rates in the early 1970s, New Zealand and Australia did in the mid 1980s, and some advanced OECD countries (eg Sweden and Norway) only did so in the 1990s.  Tiny Iceland only floated in 2001.  Inflation targeting –  whether formally (as pioneered by New Zealand) or less formally –  makes sense only in the context of a pretty flexible (probably floating) exchange rate.  It is a regime that exist with twin goals in mind, whether or not they are written down in statute book somewhere or not.

Floating your currency allows a country to choose its own inflation rate.   That was a big consideration in the 70s and 80s: if, like Switzerland, you wanted to maintain low inflation, you couldn’t do so with a fixed exchange rate to the rest of the world that was running an inflation rate of 10 per cent.  But it also allows your country to cope better with severe adverse real economic shocks; in particular shocks specific (or more intense than typical) to your particular country.    I wrote last week about the Finnish situation in the late 80s and early 90s.    We had it pretty tough here during that period, but it was nothing like as bad as the Finnish experience – despite big structural reforms going on at the same time –  because we had our own monetary policy and could allow interest rates to fall, and the exchange rate, when times turned tough.   We didn’t give up on inflation – in fact this was the period we were getting inflation to target for the first time –  but we had an institutional arrangement that provided a better mix of low inflation and somewhat-mitigated real economic downturns.    (In fact, it wasn’t so different back in the 1960s when, faced with a big fall in the terms of trade, New Zealand chose to devalue its nominal exchange rate –  an active monetary choice –  rather than attempt to force the adjustment through lower domestic prices and wages.  Most observers –  then and now –  would have thought that alternative would have been much more costly, in unemployment and lost output.)

All of this so far is really a rather long prelude to articulating a disagreement with an eminent former colleague.

Last week, Reuters ran an article under the heading “New government in New Zealand could spell changes for pioneering central bank”, with a particular focus on what a Labour-led government might mean.   The article quoted various people (including me –  my own thoughts were elaborated here) but the comments that caught my eye were those by Arthur Grimes.  These days Arthur is a researcher at Motu –  mostly focused on issues other than macroeconomics –  a professor (of wellbeing and public policy), and generally one of the “great and the good” of New Zealand economics (president of the Association of Economists etc).  But in his younger days he spent 15 years or so at the Reserve Bank, rising to Head of Economics and then Head of Financial Markets before leaving for the private sector and academe.  In that time, he was one of those closely involved from the Bank’s side in the design of the Reserve Bank Act, and was also involved in the practical development of inflation targeting (the two developed in parallel).    Later, he ended up on the Reserve Bank’s Board, serving as chair of the Board until about four years ago.   As chair of the Board, he probably should be seen as having had prime responsibility for the appointment of Graeme Wheeler as Governor.    In many respects, were he to be interested, Grimes could have been the best of the status quo candidates to replace Wheeler permanently.

Grimes is pretty deeply committed to the status quo on monetary policy (I’m not sure what his views now would be on single decisionmaker vs a committee, although interestingly he has been a longserving Board member of the Financial Markets Authority,  where decisionmaking responsibility rests with the Board not the chief executive).

And that commitment to the status quo was on display in the Reuters article.

“It’s a huge change. We’ve had over 25 years of an extraordinarily successful monetary policy that has been copied around the world,” said Arthur Grimes, RBNZ’s chief economist in the early 1990s and Board Chair between 2003 and 2013. Any change without careful consideration and analysis would be “extraordinary”, he added.

For 28 years, New Zealand’s central bank has had the single aim of keeping inflation between a set range. But Labour wants to add employment to the bank‘s mandate, a goal shared by NZ First which also wants to broaden the Reserve Bank of New Zealand’s (RBNZ) focus to include greater management of the local dollar’s value against other currencies.

Grimes, however, argues that history proves monetary policy cannot have a sustained impact on employment.

“It would be like having someone who is running for health minister argue for a cancer drug to be used for heart issues,” said Grimes

I’m not sure what benchmarks Grimes is using to describe New Zealand’s monetary policy as “extraordinarily successful”.  There is no doubt that inflation has been much lower and more stable than it was in the 1970s and 1980s –  although not much different than it was in the 15 years prior to 1967 –  but that is true almost everywhere.  So if one is going to argue that the specifics of the way the New Zealand target/Act are specified have been “extraordinarily successful”, and need protecting, one would need to show that that particular specification has led us to have better outcomes than, say, other advanced countries that did inflation targeting differently, that specified things (formally) less tightly, than put less emphasis on formalised accountability mechanisms, or which even kept “dual mandate” types of language in their statutes and official communications/rhetoric.    The United States and Australia might be obvious cases to look at.  But it would be impossible, as far as I can see, to demonstrate such superior New Zealand performance.

Now it is no doubt true that the New Zealand (and near-parallel Canadian) early experiences with inflation targeting did influence other countries’ choices to some extent.  But it would be flattering (and fooling) ourselves to suppose that the specifics of the New Zealand model have been widely copied at all.    Indeed, in several important areas –  including governance/accountability –  what is striking is how few countries have gone the same way we did.   We remain, I think, the only inflation targeting country to have (a) twice changed its target, and (b) where monetary policy has been an election issue for some parliamentary parties or other every single election since the 1989 Act was passed.  Even on the specification of the mandate, a Reserve Bank Bulletin article a few years ago highlighted just how a wide a range of ways mandates and overarching goal for monetary policy are specified even among advanced country inflation targeters.    It is not, after all, as if what the Labour Party has proposed involves tossing out inflation targeting.  That would indeed be extraordinarily bold – not necessarily wrong, as there are plausible alternatives bruited about internationally – without a lot more work.  But simply adding a formal statutory recognition that we have active discretionary monetary policy because of concerns about shocks that can take unemployment well away from its full employment (non-inflationary) level isn’t radical or extraordinary at all.

Analogies can be powerful rhetorical devices, so it is always worth testing analogies that people propose to see if they capture a useful and valid point or not.  And it was Grimes’s analogy that really prompted this post.  He suggests that adding something –  and recall that all of us are reacting to a general point not specific proposed wording –  about unemployment to the Reserve Bank’s statutory monetary policy mandate

“It would be like having someone who is running for health minister argue for a cancer drug to be used for heart issues,” said Grimes

And that is simply an invalid analogy (assuming, as I imagine both Grimes and I do as non-medical laymen, that there is no connection between cancer drugs and heart issues).  It is generally recognised that monetary choices can have output and employment consequences and that, at times, those effects can be large, and persistent enough to be troubling for individuals and (voting) populations.     Of course, no one argues (I think) that monetary policy choices today will affect the unemployment rate 15 years hence.  If there are problems there, you need a different set of tools (labour market reforms, welfare reforms etc).  But a succession of monetary policy choices today can, if mistaken, leave the unemployment rate away from a long-term sustainable rate for some considerable time.   One could mount a plausible argument –  for example –  that the fact that the New Zealand unemployment rate has been above all official estimates of the NAIRU for some years now, while at the same time core inflation has been below target, might be one of those examples.  Choices –  risks taken, or not, under uncertainty –  have consequences.

And that sort of example (demand shocks, or surprises) is the easy case –  after all, getting inflation back to target and getting unemployment down work in the same direction.  For plenty of shocks it works the other way.  A big boost to oil prices tends to raise CPI inflation.  Attempting to prevent, or reverse, those inflation effects can only be done by monetary policy actions that would raise unemployment.   The Reserve Bank –  and those setting its specific goals –  have always considered that would (normally) be an inappropriate response.  In those circumstances, we allow a bit more inflation temporarily –  and a permanently higher price level –  to avoid unnecessary departures of the unemployment rate from its sustainable level.   We articulated that logic in public right from the very first days of inflation targeting (it is explicit in the first Monetary Policy Statements –  which I wrote and Grimes commented on).

Don’t get me wrong. There are some arguments for not including the unemployment references in the Reserve Bank Act. I was persuaded by them for a long time, even if I no longer am.    But they are fine judgements at the margin, nothing remotely like the suggestion of snake-oil peddling implicit in Arthur Grimes’ medical analogy.    Price and wage rigidities –  that exist for rational and efficient reasons –  mean that in the short to medium term, targeting inflation and targeting unemployment are inextricably linked (not mechancially, but inextricably).

Other people recognise this.   I’ve linked previously to the writings of leading academic in the field, Lars Svensson (also former monetary policy board member in Sweden, and former independent reviewer of New Zealand monetary policy), who favours explicit statutory recognition of the role that deviations of unemployment from a long-run sustainable rate play in monetary policy.    The Reuters article quotes Phil Lowe, current RBA Governor, in defence of such language in the RBA Act (although I’d argue that the RBA experience illustrates that words make less difference than people).  Janet Yellen and Ben Bernanke have similarly been comfortable in the United States, and although Alan Greenspan was a well-known hard money man (favouring, at least in principle, a “true zero” inflation average), (a) he was never that keen on inflation targeting itself, preferring to keep a considerable measure of discretion to himself, and (b) he was not averse to talking about unemployment (“we are keenly interested in what we can do to maximise sustainable employment growth and to reduce unemployment” as his biographer records him noting at a Jackson Hole conference at which Don Brash was one of the speakers).

So, of course, the specific wording a Labour-led government might seek to introduce  –  should things go their way –  should be carefully scrutinised.  But it wouldn’t be extraordinary at all to make such a change, rather it would be a pretty straightforward translation into statute of the reasons why we have a discretionary and active monetary policy in the first place.   If we didn’t care about the output and employment consequences of adjusting to shocks, we might as well just go back to the Gold Standard, or a fixed exchange rate.

Not a word of this would be particularly surprising to Arthur Grimes.  A few years ago, on leaving the Reserve Bank Board, he gave a series of lectures in the UK on central banking.   They were a pretty robust defence of the status quo, broadly defined.  In some places, I thought he claimed too much, but the underlying economics wasn’t much different than anything I’ve articulated here.   There was, for example, a nice piece on the exchange rate system headed “A floating exchange rate is the worst exchange rate regime (except for all the others that have been tried)”.  I’d agree with him entirely.  And what reasons does he give?  This is from his conclusion

Third, dynamics do matter. The evidence shows that countries that adopt a hard peg may experience greater persistence in economic cycles than those with a floating currency. If domestic prices and costs can adjust easily, a hard peg may not be problematic. But in a country with sluggish domestic price adjustment, the hard peg can result in persistent real sector imbalances as we have seen both in the upward and downward direction for several Euro-zone countries.

If we rule out a soft peg as being the worst of all worlds, how should a country decide whether to adopt a hard peg or a floating rate? The trade-offs are complex: How flexible is domestic price adjustment? How diverse are the country’s trading partners, and hence what are the effective currency impacts of pegging to a specific country or bloc? How likely is it that a government will adopt sensible economic reforms under one or other regime?

In the end, a floating rate appears to have advantages, especially in relation to persistence of real sector variables, over a hard peg. However, if the political economy is such that a country with weak policies is more likely to adopt reforms under a hard peg than under a float, then it may be better for it to retain a hard peg and be forced to reform its other policy settings.

Ultimately, in terms of long run economic performance, the choice of regime does not matter much, so we cannot expect substantive changes in long term outcomes through a change in the exchange rate regime. But while the long term destination may not change, the quality of the ride does differ depending on the chosen vehicle.

Ignoring unemployment in choosing monetary policy regimes, and conducting monetary policy, might be more like caring only about the speed at which one drove from Auckland to Wellington, not the comfort or the safety of the journey.    No one does.  In practice, no one ignores unemployment in monetary policy design either.  The question is whether explicit recognition of that fact, in statute or even in the Policy Targets Agreement, in conjuction with the appointment of a good Governor, might (a) assist communications, around what the Reserve Bank really exists for, and (b) at times, produce better outcomes, and better accountability for performance against the unemployment dimension of what we care about in monetary policy management.   Reasonable people can reach different conclusions on that point, but whichever side one lands it simply isn’t a terribly radical choice.  And, on the other hand, the status quo –  whether around the Bank itself, or short to medium term, economic outcomes, or the ongoing political debate around these issues-  isn’t so obviously superior that we should not explore alternatives.

Unemployment: ethnic differences

Having written last Friday on some of the differences in unemployment rates by age cohort, I got curious about the HLFS data broken out by ethnicity.  I’ve never paid much attention to it –  much of the data hasn’t been published for long, and my main interest has always been macroeconomics (the whole economy, rather than specific outcomes for particular subgroups).

But many of the ethnic differences are stark.   Here, I will mostly focus on those between those identifying as European and those identifying as Maori.

Take the headline unemployment rates for example (the longest run of data I could find on Infoshare).

U by eth

or the underutilisation rates

underutil by eth

The European numbers are bad enough –  10.5 per cent of the labour force underutilised –  but the Maori numbers are astonishing.  22.4 per cent of the Maori labour force underutilised is a sad reflection of (probably) a whole series of failures.    Perhaps because the numbers are so large, the gap between the Maori underutilisation rate now and that prior to the recession is visibly stark.

As I illustrated last week, labour market characteristics differ quite a lot by age cohort, and the Maori population is, on average, quite a bit younger than the the European population (both because of higher birth rates and because of lower life expectancy).

But even when one looks by age cohort, the differences between Maori and European outcomes are stark.   Overall labour force participation rate of Maori and Europeans aren’t so very different –  on average over the last three years, 67.2 per cent of working age Maori were in the labour force, and 70.2 per cent of Europeans.   But here are participation rates by age cohort for the two ethnic groups.

partic by age eth

In every cohort, except the 65 plus group, the European labour force participation rate is materially above that for Maori –  on average by almost 10 percentage points.   I’m not sure what to make of the 65 plus group, where Maori and European participation rates are almost equal.   It may be, at least in part, a reflection of greater Maori relative poverty (less success in building up wealth over earlier years).

The picture is even more stark if one looks just at employment rates (given that Maori unemployment rates are higher).

empl rates by age eth

Focusing in on young people, here is what the data show people aged 15 to 24 are doing (again averaged over the last three years).

15 to 24

Interestingly, a slightly larger proportion of the the Maori young population are in education and not simultaneously in the labour force than is the case for young Europeans.     Perhaps the most visible difference on that chart is the first set of bars –  the much larger proportion of European young people simultaneously working and studying than for Maori.      Here is a chart (over the same three years) of that one component for each of the four ethnic groups SNZ reports the results for.

15 to 24 employed

I did notice the difference in the “not in education, not in the labour force –  caregiving” proportions.  Here is that chart for each of the four ethnic groups.

15-24 caregiving

SNZ reports no (statistically significant) numbers of young men in this category.  In other words,  around 11 per cent of young Maori women are engaged in full-time caregiving (presumably mostly for young children), doing no study or even an hour’s paid work (the HLFS criterion) a week.   By contrast no (statistically significant numbers of) young Asian women are.

I’m not going to attempt to hypothesise about why the differences in these various charts (or various others in the data) exist.  But none of the gaps strike me as things simply to be relaxed about.   Says he who is –  contentedly – not in the labour force, not in education, and is caregiving children.

Unemployment: age matters

Despite the reaction of the foreign exchange market, there didn’t seem to be much new in the suite of labour market data the other day.  Sure, employment was down a touch, and the participation rate fell back.  Then again, it had been hard to take entirely seriously the reported strength of the participation rate over the last year or so.  And the unemployment rate did keep edging downwards (although at this rate it will take another two years until the unemployment rate is back to where it was when the current government took office) and hours worked, in both the HLFS and QES, grew quite strongly.   And there wasn’t much sign of any pick-up in wage inflation.  So unless you had been determined to believe the data was  just about to confirm an overheating economy, probably not too many surprises.  We’ll see next week what the Governor of the Reserve Bank makes of it.

But, largely prompted by a question in Parliament yesterday, I downloaded the age breakdowns in the HLFS.  Unemployment rates are very very different by age cohort.

Here are official unemployment rates for the latest year, by age.

U rates by age

People aged 15-24 and people aged 65 and over make up roughly the same share of the total working age population (about 18 per cent each).    But people in the young cohort make up 45 per cent of the total number of people unemployed, while over 65s make up 1.5 per cent of the unemployed.

And that difference isn’t something new.  Here are the average shares of the total number of people unemployed, by age cohort, for the entire history of the HLFS.

U by age avg

The age patterns shouldn’t be terribly surprising.    At one end of the spectrum,  young people are often in part-time work, dropping in and out of jobs (voluntarily or not), in transition between school, work, and further study, even in the course of a single year.  And, of course, they are just starting out –  finding out what they might be good at, or might enjoy, and proving themselves (or not) to employers.   High minimum wages (relative to median wages) hit younger people harder than other age groups.

Every OECD country has an unemployment rate for 15-24 year olds materially higher than the overall unemployment rate –   although as I was confirming that I was a little surprised to discover that although our overall unemployment rate has been consistently below that of the median OECD country, our unemployment rate for young people is now as high as that in the median OECD country.

U 15 to 24

At the other end of the age spectrum, by contrast, work is typically much more of a choice.  Almost everyone living here aged 65 or over is entitled to NZS, the state pension.  If old people are working, they probably aren’t changing jobs very often –  their circumstances are rarely changing as rapidly –  and if for some reason they lose their job, they may not be particularly aggressive in looking for a new job. Recall that the official definition of unemployment involves actively searching for work and being available to start right away.  With a stable income buffer, that search of active search is likely to be less imperative for most than it will be for young people just starting out.

It is relatively easy to understand why there are quite high unemployment rates for young people and quite low ones for old people.  But these differences can matter for how we think about the overall unemployment rate if the importance of different age cohorts in the labour market has been changing over time.  It has.

age shares of lab force 
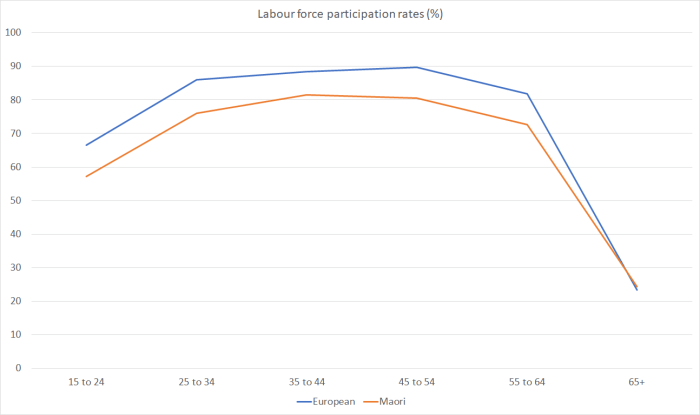
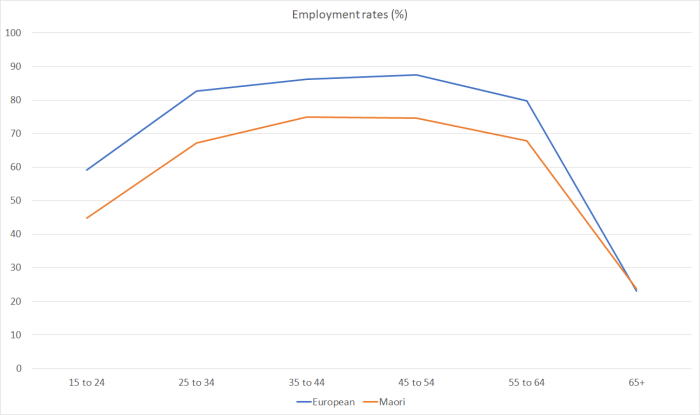
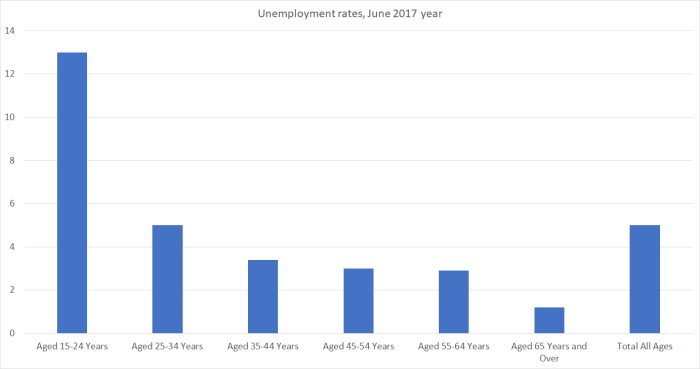
In the early 90s 5 per cent of old people were in the labour force (working or actively seeking), and now that figure is almost 25 per cent.  By contrast, the labour force participation rate for 15-24 year olds is now only around 63 per cent (it was 74 per cent when the HLFS began).    (Frankly, the drop in youth participation rates surprises me a bit given that (eg) university fees are much much higher than they used to be, and that one has to work only an hour a week to be counted as employed so, for example, after school jobs should be captured.)

The change in the age structure of the work force does then affect how we think about any particular rate of unemployment.   The natural rate of unemployment for young people –  normal frictional stuff –  is materially higher than that for old people, so that a 5 per cent aggregate unemployment rate means something different than a 5 per cent unemployment rate does today.

One way of illustrating the point is shown in this chart.  It shows the actual reported unemployment rate, and also an artificial unemployment on the assumption that each age cohort had the same unemployment rate is actually had, but that the relative size of the various age cohorts was the same as it was in 1987 (the first year for which there is data).

U rate age adj

For the last year, the actual unemployment rate was 5 per cent.  With constant age chort shares, it would have been 6.2 per cent.    It isn’t an effect that makes much difference from year to year, but over time it can materially affect how we look at any particular unemployment rate.    In effect, and all else, the change in composition of the labour force –  more old people, fewer young people, –  appears to have lowered the NAIRU.

As one final chart, here is the change in the unemployment rate (in percentage points) for each age cohort, from the year to June 2008 (the previous cyclical low point) to now (year to June 2017).

U chg by age

The overall unemployment rate is still 1.4 percentage points higher than it was then.   There has been almost no change in the unemployment rate for the over 65s –  which isn’t surprising as, for reasons outlined above, there is very little cyclicality in that series. On the other hand, it is quite sobering how large an increase in the unemployment rate for 15 to 24 year olds there has still been.   Some of that is cyclical, and some will likely reflects the effects of higher minimum wages, but whatever the cause it should be cause for disquiet, given how important it is to get a start in the labour market and to stay connected.


A radical alternative to macro policy?

Last Friday, an outfit called Strategy2040 New Zealand, together with Victoria University’s School of Government, hosted a lunchtime address by an Australian academic, Professor Bill Mitchell of the University of Newcastle.   He is a proponent of something calling itself Modern Monetary Theory, but which is perhaps better thought of as old-school fiscal practice, with rhetoric and work schemes thrown into the mix.

Mitchell attracted some interest on his trip to New Zealand.  He apparently did two substantial interviews on Radio New Zealand and attracted perhaps 150 people to the lunchtime address –  a pretty left-liberal crowd mostly, to judge from the murmurs of approval each time he inveighed against the “neo-liberals”.    In fact, the presence of former Prime Minister Jim Bolger was noted –  he who, without apparently recanting any specific reforms his government had put in place, now believes that “neo-liberalism has failed New Zealand”.     Following the open lecture, 20 or so invitees (academics, journalists and economists –  mostly of a fairly leftish persuasion) joined Mitchell for a roundtable discussion of his ideas.   Perhaps a little surprisingly, I didn’t recognise anyone from The Treasury or the Reserve Bank at either event.

Mitchell has it in for mainstream academic economics.   Quite probably there is something in what he says about that.  Between the sort of internal incentives (“groupthink”) that shape any discipline, and the inevitable simplifications that teaching and textbooks require, it seems highly likely there is room for improvement.   If textbooks are, for example, really still teaching the money multiplier as the dominant approach to money, so much the worse for them.   But as I pointed out to him, that was his problem (as an academic working among academics): I wasn’t aware of any floating exchange rate central banks that worked on any basis other than that, for the banking system as a whole, credit and deposits are created simultaneously.  He quoted the Bank of England to that effect: I matched him with the Reserve Bank of New Zealand.    And if very few people correctly diagnosed what was going on just prior to the financial crises in some countries in 2008/09, that should be a little troubling.  But it doesn’t shed much (any, I would argue) light on the best regular approach to macroeconomic management and cyclical stabilisation.  Perhaps especially so as (to us) he was talking about policy in Australia and New Zealand, and neither country had a US-style financial crisis.

He seemed to regard his key insight as being that in an economy with a fiat currency, there is no technical limit to how much governments can spend.  They can simply print (or –  since he doesn’t like that word – create) the money, by spending funded from Reserve Bank credit.     But he isn’t as crazy as that might sound. He isn’t, for example, a Social Crediter.    First, he is obviously technically correct –  it is simply the flipside of the line you hear all the time from conventional economists, that a government with a fiat currency need never default on its domestic currency debt.     And he isn’t arguing for a world of no taxes and all money-creating spending.  In fact, with his political cards on the table, I’m pretty sure he’d be arguing for higher taxes than New Zealand or Australia currently have (but quite a lot more spending).  Taxes make space for the spending priorities (claims over real resources) of politicians.  And he isn ‘t even arguing for a much higher inflation rate –  although I doubt he ever have signed up for a 2 per cent inflation target in the first place.

In listening to him, and challenging him in the course of the roundtable discussion, it seemed that what his argument boiled down to was two things:

  • monetary policy isn’t a very effective tool, and fiscal policy should be favoured as a stabilisation policy lever,
  • that involuntary unemployment (or indeed underemployment) is a societal scandal, that can quite readily be fixed through some combination of the general (increased aggregate demand), and the specific (a government job guarantee programme).

Views about monetary policy come and go.   As he notes, in much academic thinking for much of the post-war period, a big role was seen for fiscal policy in cyclical stabilisation.  It was never anywhere near that dominant in practice –  check out the use of credit restrictions or (in New Zealand) playing around with exchange controls or import licenses –  but in the literature it was once very important, and then passed almost completely out of fashion.  For the last 30+ years, monetary policy has been seen as most appropriate, and effective, cyclical stabilisation tool.  And one could, and did, note that in the Great Depression it was monetary action –  devaluing or going off gold, often rather belatedly – that was critical to various countries’ economic revivals.

In many countries, the 2008/09 recession challenged the exclusive assignment of stabilisation responsibilities to monetary policy.  It did so for a simple reason –  conventional monetary policy largely ran out of room in most countries when policy interest rates got to around zero.   Some see a big role for quantitative easing in such a world.  Like Mitchell – although for different reasons –  I doubt that.    Standard theory allows for a possible, perhaps quite large, role for stimulatory fiscal policy when interest rates can’t be cut any further.

But, of course, in neither New Zealand nor Australia did interest rates get anywhere near zero in the 2008/09 period, and they haven’t done so since.    Monetary policy could have been  –  could be –  used more aggressively, but wasn’t.

As exhibit A in his argument for a much more aggresive use of fiscal policy was the Kevin Rudd stimulus packages put in place in Australia in 2008/09.   According to Mitchell, this was why New Zealand had a nasty damaging recession and Australia didn’t.  Perhaps he just didn’t have time to elaborate, but citing the Australian Treasury as evidence of the vital importance of fiscal policy –  when they were the key advocates of the policy –  isn’t very convincing.   And I’ve illustrated previously how, by chance more than anything else, New Zealand and Australian fiscal policies were reamrkably similar during that period.   And although unemployment is one of his key concerns –  in many respects rightly I think –  he never mentioned that Australia’s unemployment rate rose quite considerably during the 2008/09 episode (in which Australian national income fell quite considerably, even if the volume of stuff produced –  GDP –  didn’t).

On the basis of what he presented on Friday, it is difficult to tell how different macro policy would look in either country if he was given charge.   He didn’t say so, but the logic of what he said would be to remove operational autonomy from the Reserve Bank, and have macroeconomic stabilisation policy conducted by the Minister of Finance, using whichever tools looked best at the time.  As a model it isn’t without precedent –  it is more or less how New Zealand, Australia, the UK (and various other countries) operated in the 1950s and 1960s.  It isn’t necessarily disastrous either.  But in many ways, it also isn’t terribly radical either.

Mitchell claimed to be committed to keeping inflation in check, and only wanting to use fiscal policy to boost demand where there are underemployed resources.    And he was quite explicit that the full employment he was talking about wasn’t necessarily a world of zero (private) unemployment  –  he said it might be 2 per cent unemployment, or even 4 per cent unemployment.     He sees a tight nexus between unemployment and inflation, at least under the current system  (at one point he argued that monetary policy had played little or no role in getting inflation down in the 1980s and 1990s, it was all down the unemployment.  I bit my tongue and forebore from asking “and who do you think it was that generated the unemployment?” –  sure some of it was about microeconomic resource reallocation and restructuring, but much it was about monetary policy).   But as I noted, in the both the 1990s growth phase and the 2000s growth phase, inflation had begun to pick up quite a bit, and by late in the 2000s boom, fiscal policy was being run in a quite expansionary way.

I came away from his presentation with a sense that he has a burning passion for people to have jobs when they want them, and a recognition that involuntary unemployment can be a searing and soul-destroying experience (as well as corroding human capital).  And, as he sees things, all too many of the political and elites don’t share  that view –  perhaps don’t even care much.

In that respect, I largely share his view.

Nonetheless, it was all a bit puzzling.  On the one hand, he stressed how important it was that people have the dignity of work, and that children grow up seeing parents getting up and going out to work.   But then, when he talked about New Zealand and Australia, he talked about labour underutilisation rates (unemployment rate plus people wanting more work, or people wanting a job but not quite meeting the narrow definition of actively seeking and available now to start work).   That rate for New Zealand at present is apparently 12.7 per cent –  Australia’s is higher again.     Those should be, constantly, sobering numbers: one in eight people.      But some of them are people who are already working –  part-time –  but would like more hours.  That isn’t a great situation, but it is very different from having no role, no job, at all.  And many of the unemployed haven’t been unemployed for very long.  As even Mitchell noted, in a market economy, some people will always be between jobs, and not too bothered by the fact.  Others will have been out of work for months, or even years.   But in New Zealand those numbers are relatively small: only around a quarter of the people captured as unemployed in the HLFS have been out of work for more than six months (that is around 1.5 per cent of the labour force).       We should never trivialise the difficulties of someone on a modest income being out of work for even a few months, but it is a very different thing from someone who has simply never had paid employment.  In our sort of country, if that was one’s worry one might look first to problems with the design of the welfare system.

Mitchell’s solution seemed to have two (related) strands:

  • more real purchases of good and services by government, increasing demand more generally.  He argues that fiscal policy offers a much more certain demand effect than monetary policy, and to the extent that is true it applies only when the government is purchasing directly (the effects of transfers or tax changes are no more certain than the effects of changing interest rates), and
  • a job guarantee.    Under the job guarantee, every working age adult would be entitled to full-time work, at a minimum wage (or sometimes, a living wage) doing “work of public benefit”.     I want to focus on this aspect of what he is talking about.

It might sound good, but the more one thinks about it the more deeply wrongheaded it seems.

One senior official present in the discussions attempted to argue that New Zealand was so close to full employment that there would be almost no takers for such an offer.   That seems simply seriously wrong.    Not only do we have 5 per cent of the labour force officially unemployed, but we have many others in the “underutilisation category”, all of whom would presumably welcome more money.     Perhaps there are a few malingerers among them, but the minimum wage –  let alone “the living wage” – is well above standard welfare benefit rates.   There would be plenty of takers.   (In fact, under some conceptions of the job guarantee, the guaranteed work would apparently replace income support from the current welfare system.)

But what was a bit puzzling was the nature of this work of public benefit.    It all risked sounding dangerously like the New Zealand approach to unemployment in the 1930s, in which support was available for people, but only if they would take up public works jobs.  Or the PEP schemes of the late 1970s.   Mitchell responded that it couldn’t just be “digging holes and filling them in again”.  But if it is to be “meaningful” work, it presumably also won’t all be able to involve picking up litter, or carving out roadways with nothing more advanced than shovels.  Modern jobs typically involve capital (machines, buildings, computers etc) –  it accompanies labour to enable us to earn reasonable incomes –  and putting in place the capital for all these workers will relatively quickly put pressure on real resources (ie boosting inflation).   If the work isn’t “meaningful”, where is the alleged “dignity of work”  –  people know artificial job creation schemes when they see them –  and if the work is meaningful, why would people want to come off these government jobs to take existing low wage jobs in the prviate market?

The motivation seems good, perhaps even noble.  I find quite deeply troubling the apparent indifference of policymakers to the inability of too many people to get work.   The idea of the dignity of work is real, and so too is the way in which people use starting jobs to establish a track record in the labour market, enabling them to move onto better jobs.

But do we really need all the infrastructure of a job guarantee scheme?  In countries where interest rates are still well above zero, give monetary policy more of a chance, and use it more aggressively.   For all his scepticism about monetary policy, it was noticeable that in Mitchell’s talks he gave very little (or no) weight to the expansionary possibilities of exchange rate.    But in a small open economy, a lower exchange rate is, over time, a significant source of boost to demand, activity, and employment.    And winding back high minimum wage rates for people starting out might also be a step in the right direction.

And curiously, when he was pushed Mitchell talked in terms of fiscal deficits averaging around 2 per cent of GDP.  I don’t see the case in New Zealand –  where monetary policy still has capacity –  but equally I couldn’t get too excited about average deficits at that level (in an economy with nominal GDP growth averaging perhaps 4 per cent).  Then again, it simply can’t be the answer either.    Most OECD countries –  including the UK, US and Australia –  have been running deficits at least that large for some time.

It is interesting to ponder why there has been such reluctance to use fiscal policy more aggressively in countries near the zero bound.   Some of it probably is the point Mitchell touches on –  a false belief that somehow countries were near to exhausting technical limits of what they could spend/borrow.      But much of it was probably also some mix of bad forecasts –  advisers who kept believing demand would rebound more strongly than it would –  and questionable assertions from central bankers about eg the potency of QE.

But I suspect it is rather more than that –  issues that Mitchell simply didn’t grapple with.  For example, even if there is a place for more government spending on goods and services in some severe recessions, how do we (citizens) rein in that enthusiasm once the tough times pass?  And perhaps I might support the government spending on my projects, but not on yours.  And perhaps confidence in Western governments has drifted so low that big fiscal programmes are just seen to open up avenues for corruption and incompetent execution, corporate welfare and more opportunities for politicians once they leave public life.  Perhaps too, publics just don’t believe the story, and would (a) vote to reverse such policies, and (b) would save themselves, in a way that might largely offset the effects of increased spending.      They are all real world considerations that reform advocates need to grapple with –  it isn’t enough to simply assert (correctly) that a government with its own currency can never run out of money.

I don’t have much doubt that in the right circumstances expansionary fiscal policy can make a real difference: see, for example, the experience of countries like ours during World War Two.    A shared enemy, a fight for survival, and a willingness to subsume differences for a time makes a great deal of difference –  even if, in many respects, it comes at longer term costs.

But unlike Mitchell, I still think monetary policy is, and should be, better placed to do the cyclical stabilisation role.    That makes it vital that policymakers finally take steps to deal with the near-zero lower bound soon, or we will be left in the next recession with (a) no real options but fiscal policy, and (b) lots of real world constraints on the use of fiscal policy.  Like Mitchell, I think involuntary unemployment (or underemployment for that matter) is something that gets too little attention –  commands too little empathy –  from those holding the commanding heights of our system.  But I suspect that some mix of a more aggressive use of monetary policy, and welfare and labour market reforms that make it easier for people to get into work in the private economy,  are the rather better way to start tackling the issue.   How we can, or why we would, be content with one in twenty of our fellow citizens being unable to get work, despite actively looking –  or why we are relaxed that so many more, not meeting those narrow definitions, can’t get the volume of work they’d like  –  is beyond me.   Work is the path to a whole bunch of better family and social outcomes –  one reason I’m so opposed to UBI schemes –  and against that backdrop the indifference to the plight of the unemployed (or underemployed), largely across the political spectrum, is pretty deeply troubling.

But, whatever the rightness of his passion, I’m pretty sure Mitchell’s prescription isn’t the answer.


A questionable indicator of the labour market (geeky)

The Reserve Bank has long been averse to too much focus on the unemployment rate.  Some of that was political.  Opposition MPs back in the 1990s would try gotcha games, trying to extract estimates of a non-accelerating -inflation rate of unemployment (NAIRU) with the aim of then being able to tar us with lines like “Reserve Bank insists full employment is x per cent unemployment” [at the time x might have been 7 per cent or more] or “Reserve Bank insists on keeping x per cent of New Zealanders unemployed”.   So there was an aversion to using the concept, and most certainly to writing it down.  If you don’t write things down, it is hard to have them OIAed.

But for decades there has been something a lot like a NAIRU embedded in successive versions of the models the Bank uses as a key input to the forecasting process.   But there was still an unease.  Some of it was those old political concerns.  Some of it was the aversion to being pressured into any sort of dual objective model –  even though discretionary monetary policy was only ever introduced to allow short-term macro stabilisation together with medium price stability.

In the last decade or so, it seemed to be some mix of things.   In 2007, the unemployment rate was down at around 3.5 per cent, but the official view at the time was that the overall economy was more or less in balance (as I noted yesterday the output gap estimates then were positive but quite small).  So, the unemployment rate tended to be discounted.   To the extent there were NAIRU estimates implicit in the thinking, they had been trending down for 15 years.  Perhaps, some felt, 3.5 per cent unemployment wasn’t much below a NAIRU at all.

In the years after the 2008/09 recession, there seemed to be two problems.  The first was a quite genuine one.  The HLFS unemployment rate numbers were quite volatile for a while, and while it was clear that the unemployment rate was still quite high, it was hard to have much confidence in each new quarterly observation.    The rise in the unemployment rate in 2012 only further undermined confidence among some of my then colleagues.  The economy seemed to be recovering.

U 2006 to 13

So there had always been a tendency to discount the unemployment rate.  Odd short term developments in the series itself reinforced that, and then as the recovery began to develop the Bank kept convincing itself that the output gap had all but closed.  If the output gap  –  which tended to be central focus for much of the analysis, even though it was something of a black-box, and prone to significant revisions –  had really closed, then surely the labour market must also be more or less in balance?  If the unemployment rate appeared to suggest otherwise, so much the worse for that particular indicator, which many at the Bank had never much liked.    When the Bank started the ill-fated tightening cycle in March 2014, they thought then that excess capacity had already been used up for a couple of years.  This is the output gap chart they ran then.

output gap mar 14 mps

At the time, the unemployment rate was still 5.6 per cent

(Contrast that output gap chart with the one from yesterday’s MPS, which I included in yesterday’s post.  At first glance, they look quite similar, but whereas in 2014 they thought excess capacity had been exhausted in 2011/12, now they think it was only exhausted in 2013/14.)

Various people had various ideas for how best to look at labour market data.  But mostly the unemployment rate was just ignored.

A year or two back, some US researchers had done an interesting exercise, trying to combine formally the information in a whole variety of labour market indicators, to distill an overall picture.  And somewhere along the line, someone got the idea of doing something similar for New Zealand.  And thus was born the Reserve Bank’s Labour Utilisation Composite Index, with the pleasing acronym of LUCI.

One day last April, Reserve Bank Deputy Governor Geoff Bascand gave a major address on monetary policy matters, Inflation pressures through the lens of the labour marketAs I noted at the time, it was little odd for him to be giving the speech –  as his day job was mostly responsibility for notes and coins, and the Bank’s corporate functions.  Then again, his ambition for higher office was pretty apparent, and earlier in his career he had led the Department of Labour’s Labour Market Policy Group.   Geoff on labour market matters should have been worth listening to.

The broad thrust of the speech was that high immigration wasn’t going to put much pressure on demand (contrary to the usual experience, and past Bank research), and that the labour market was pretty much operating at full capacity.  In support of these propositions, the Bank simultaneously released not just the speech, but three new Analytical Notes.    Since I had been harrying the Bank about its change of view of immigration, I focused then on the two immigration research papers, and identified a number of issues with them.     At the end of a long post I noted

There is a more material on other topics in Bascand’s speech, and another whole Analytical Note on other labour market issues which I haven’t read yet. I might come back to them next week.

But I never did.  Other things presumably distracted me, and thus I never got round to reading the Analytical Note introducing LUCI.   I didn’t until yesterday afternoon – I’d heard the Governor, or the Chief Economist, mention it at the press conference, and it was a wet afternoon, so I went and downloaded the paper.

The Reserve Bank has given quite a lot of attention to this brand new indicator.  In the Deputy Governor’s speech, it gets three whole paragraphs

Over the business cycle, a key driver of wage growth is the balance of supply and demand, or labour market ‘slack’. However, the unemployment rate is an inadequate indicator of labour market slack, particularly when the participation rate fluctuates. Researchers at the Bank have recently constructed a labour utilisation composite index, or LUCI, to help address this problem. Such indices combine the information in a large number of labour market variables into a single series of labour market tightness, and are used internationally to help gauge labour market pressures. The New Zealand index uses official statistics such as the HLFS and survey measures of the difficulty of finding labour, such as the QSBO.

By construction, the LUCI has an average value of zero. A LUCI value above zero indicates greater labour market tightness than usual – a value below zero indicates greater labour market slack than usual. Our research shows that, historically, a higher LUCI has been associated with stronger wage growth.

The LUCI suggests there was a large degree of slack in the labour market at the trough of the 2008-09 recession. The LUCI then gradually returned to zero, and has been around that level since early 2014 (figure 7). This movement is consistent with the range of the Bank’s suite of output gap indicators.

This wasn’t just some speculative new tool dreamed up down in the engine room by smart researchers, but still needing road-testing.  The Deputy Governor (presumably with the approval of the Governor and the Chief Economist) seemed sure it was action-ready.

Consistent with that approach, a chart of LUCI has appeared in all but one of the five MPSs since that speech.    Here was LUCI as she appeared yesterday

LUCI may 2017

On the Deputy Governor’s telling

A LUCI value above zero indicates greater labour market tightness than usual – a value below zero indicates greater labour market slack than usual.

In other words, on that particular interpretation, labour market tightness was now more severe than it had been in 2007 (just prior to the recession), and almost as severe as at the peak of the series in around 2004.

And, of course, Geoff Bascand didn’t just make up that interpretation.  It was what the researchers had said in their Analytical Note, almost word for word.   It was also what the footnotes on the LUCI charts in the MPSs said.  At least until yesterday.     In yesterday’s MPS, slipped in so quietly, the interpretation of LUCI had changed rather materially.   The chart was still there, it still looked the same as ever.  But below it, it has these words written

Note: a positive value indicates a tightening in labour market conditions

Lay readers may not immediately notice the difference, but it is substantial.  When the indicator was launched, with some fanfare (there are many clever new indicators, and not many get three paragraphs in a Deputy Governor speech), a positive value was interpreted as the labour market being tighter than usual (thus the pesky single indicator, the unemployment rate could keep on being largely ignored).   But now a positive value simply means that the labour market is a bit tighter than it was last quarter.    If there was lots of slack last quarter, it simply doesn’t matter to the indicator –  all that matters is the direction of change.

The Bank didn’t draw this to readers’ attention at all.  They didn’t change the heading on the chart either.  It was a bit naughty really.       What it means is that whereas we once had an indicator –  using 16 different variables –  that might have suggested the unemployment was completely misleading as a measure of slack, what we actually have now in LUCI saying similar things to the unemployment rate.  The unemployment has been edging down, and LUCI has been positive.   But that LUCI number is now felt to tell us nothing at all about the absolute level of labour market slack (or even the level relative to a long run of history).

I don’t quite know how the Bank fell into this –  except, perhaps, for the wish (for a labour market measure suggesting the market was at full capacity –  in line with the output gap estimates) getting the better of hard-headed challenge and scrutiny.

The approach they used to construct LUCI was very much the same used to construct the sectoral factor model of core inflation.  In essence (there), get the rates of price increases for all the CPI components, and look for a common theme (or “factor”) that runs through them all.    It seems to work quite well there.  All the variables are expressed the same way (percentage changes).      But LUCI is a bit different.     Here is the list of all the variables used.

LUCI components

They take each variable and standardise it relative to its own mean.

But it is an odd mix of variables.   There are annual percentage changes mixed in with levels.  And some of those levels measures (eg the QSBO ones) are the outcome of questions that are actually technically expressed in change terms.  It is also a mix of quantity measures and price (wage) measures.   When I looked through the list, the first real oddity that struck me was that unemployment itself is not expressed as a percentage rate.  Rather, they take the number of people unemployed and calculate the percentage change.   If, then, every single person was fully employed –  so the labour market was very tight –  this component  (used in calculating LUCI)  would be showing a zero percentage change.  They’ve done the same thing to all the quantity variables, so it should have been obvious from the start that what they were doing (at least for that half of the inputs) was looking at variables that would produce a change indicator, not a levels one.

I understand why they did it.  The unemployment rate trended down for 15 years or so.   The gap between the actual unemployment rate and the average unemployment rate wouldn’t be a very meaningful indicator.   But it meant, almost inevitably, that the new indicator couldn’t be an indicator of absolute labour market tightness, only (at best) an indicator of changes in tightness.

But there are other problems.  Think about what would happen if (to be deliberately extreme) the population doubled, and yet there was no change in “true” labour market tightness.    That isn’t far from the Reserve Bank’s story about the recent immigration shock –  they told us again yesterday that, contrary to past common experience, they think the demand and supply effects have more or less offset each other.

But if the population doubled, and there was no change in “true” labour market slack,  we would still expect to see employment, numbers unemployed, the number of short-term unemployed, numbers underemployed, the number of filled jobs, hours worked, the working age population, the number of job ads, and the number of registered job seekers all increase (that is roughly half the variables in LUCI).   The unemployment rate (%), for example, might stay the same, but both the numerator and the denominator would increase a lot.  Since LUCI uses annual percentage changes, it seems highly likely that such a shock would show up as a big increase in LUCI in the year the population shock happened  (in my extreme examples, the APCs would go to 100 per cent that year), even if there had been little or no actual change in labour market tightness.

It seems astonishing that, for a variable launched by a Deputy Governor in a speech playing down the net demand effects on a large immigration shock, this issue never seems to have occurred to them.

There are other, probably more minor and mundane, problems too.  These ones  probably weren’t foreseeable in April last year, but probably still should have been highlighted as they became apparent.  The revised HLFS was introduced in June last year.  It is pretty clear that the modifications to the questions have led to material step changes in the HLFS measure of hours worked and of employment (you can see the anomalies in the charts in this post from earlier in the week).   (For some reason, they don’t even use the QES measure of hours in LUCI).     Perhaps a distortion of this sort to only two of the component variables won’t have affected the common factor that the model is trying to identify.  But we don’t know.  I hope the Reserve Bank does.   This particular problem will wash out of the data in the next HLFS release (since a year will have passed, and LUCI uses annual percentage changes), but for now it is another reason not to have much confidence in LUCI as any sort of indicator of labour market tightness (level or changes).

I did put some of these points to the Reserve Bank yesterday, mostly just to check that my understanding of the technical points was correct. I had a helpful response this afternoon which essentially establishes that they are (obviously I’m not associating the Bank with the interpretations I’ve put on those technical points).

Overall, it isn’t a case of the Reserve Bank at its best.  I have no problem at all with them doing the research in the first place.  We should always be looking for new or better ways to understand what is going on, and how best to combine sometimes conflicting bits of data.      But it doesn’t have the feel of something that was at all well road-tested before being launched as a major indicator variable.  And then, when they did finally realise that it was much more like an indicator of changes in labour market pressure rather than the level of pressure, that recognition was sneaked through without even an explanatory note, leaving anyone who had taken the earlier use of LUCI at face value none the wiser unless they were a particularly assiduous reader (and I’m usually not, when it comes to changes in footnotes on charts).

We now have a recognition that LUCI isn’t a measure of overall pressure on the labour market.  It may be, loosely speaking, an indicator of changes in labour market pressure, but even then that reading is made more difficult when you get large population shocks (of the sort that NZ is prone to, with quite variable large immigration flows, in a way that many other countries are not), and when the Reserve Bank repeatedly assures us that its overall interpretation is that this particular population shock isn’t putting additional net pressure on demand, and may even be easing capacity pressure in the labour market.

We really should expect better from our central bank.  Speeches like Bascand’s, and documents like the MPS, will have had heavy involvement from all the members of the Governing Committee –  the Governor himself, the incoming acting Governor, the incoming Deputy Chief Executive, and the long-serving Chief Economist.   One can’t help thinking that they’d have been better served taking the unemployment rate –  actually designed directly as a measure of excesss capacity –  and wage developments rather more at face value.   And of recognising that, contrary to LUCI, no serious observer thought that the labour market was at its tightest in 2004.   It isn’t much harder than that.

Reflecting on the macro data

The Reserve Bank’s Monetary Policy Statement (Graeme Wheeler’s second to last) will be out on Thursday.  I’m not in the market economists’ game of trying to tell you what the Bank will do and say (although no one expects they will do anything concrete with the OCR this time).  I’m more interested in questions around what they should do.  In time, what they should do, they usually will do.  But sometimes not until they’ve tried the alternatives.

I wrote about last month’s CPI data a few weeks ago, concluding that there had been a welcome, and expected, increase in core inflation (it is what typically happens if inflation is below target and the OCR is cut fairly substantially) but that

With the unemployment rate still above estimates of the NAIRU, and most indicators of inflation suggesting that core is probably (a) still below target, and (b) not picking up very rapidly, it certainly isn’t time for hawkish talk about near-term OCR increases.

Not everyone agrees of course.  I noticed the BNZ’s economic commentary yesterday which opened with this confident assertion

There is no excuse for the cash rate to be just 1.75% in New Zealand.

I don’t think I’m unduly caricaturing their record to say that, for at least the last decade, the BNZ economics team has never seen an OCR increase they didn’t like, even –  or perhaps especially –  those which had to be quickly reversed.  But mindful that in the story of the boy who cried wolf, the wolf eventually did come, I thought it was worth having a look at the latest wave of data.  Last week, we got the full quarterly set of labour market data (HLFS, QES, and LCI), and the Reserve Bank’s quarterly expectations survey.  To cut a long story short, it doesn’t alter my view.

Take the expectations survey first.   The headline story was one in which the two year ahead expectations of the inflation rate (of a sample of moderately informed observers –  including me) rose quite materially, and now stand at 2.17 per cent (up from around 1.65 per cent in each quarter last year).

infl and expecs

This measure of expectations isn’t typically very volatile, but it is typically somewhat responsive to changes in headline CPI inflation.  We’ve just had quite a large change in headline inflation, so some increase in the expectations measure shouldn’t be surprising. It certainly shouldn’t be concerning.  After all, ideally, the Reserve Bank wants people to believe, and act as if they believe, that on average over time CPI inflation will average around 2 per cent –  the mid-point of the target range, and the explicit focus of the current (but about to expire) PTA.

In fact, no one really knows whether this survey measure captures how people actually think and behave in real transactions in the goods, labour and financial markets.   It might be as good a proxy as we have, but (a) we don’t know, and (b) it still might not be good at all.  Glancing at the time series, there is a tendency for falls and rise to be at least partly reversed quite quickly.

But if inflation expectations are really in some sort of 2 to 2.2 per cent range, I’d welcome that.  With repeated increase in tobacco excises –  not some underlying economic process –  there is a reasonable case, in terms of the PTA, that headline inflation should average a little higher than the mid-point, and than “true” core inflation.  Only if inflation expectations were to rise further from here might I start to get a little disquieted.

In trying to make sense of the inflation expectations numbers, one thing I haven’t seen mentioned is the Labour Party’s monetary policy release.   There was a quite a bit of focus last month on their pledge to add some sort of employment objective to the Reserve Bank Act, and concerned expressed in some quarters that that could lead to higher inflation over time.   If it was a factor, you’d presumably have to take the probability of Labour leading a new government (call it a coin toss at present?) and multiply that by the probability that the change in regime (and perhaps the sort of people a new government might appoint) would make a material difference over time.  I have no evidence one way or the other, but it wouldn’t surprise me if there was a small effect of this sort.   (My own two year ahead expectation in the survey was 1.5 per cent –  around the current rate of inflation in the Bank’s preferred sectoral factor model).

Not many commentators seem to pay much attention to the rest of the expectations survey, even though its strength is partly the range of macro questions that are asked (although I’ve suggested some modifications to the Bank in their review of the survey).

Take GDP for example. There is no sign of respondents expecting real growth to accelerate.  Two years out they expect annual real GDP growth of 2.6 per cent – down on the previous quarter, but not far from the average response over the last couple of years.    But the survey also asks for quarterly GDP predictions for the next couple of quarters, and year-ahead predictions.   That enables one to derive an implied six monthly growth rate for the second half of the coming year.  Here is the gap between the expected growth rates for the first six months and the second six months, going back to just prior to the 2008/09 recession.

expec GDP growth
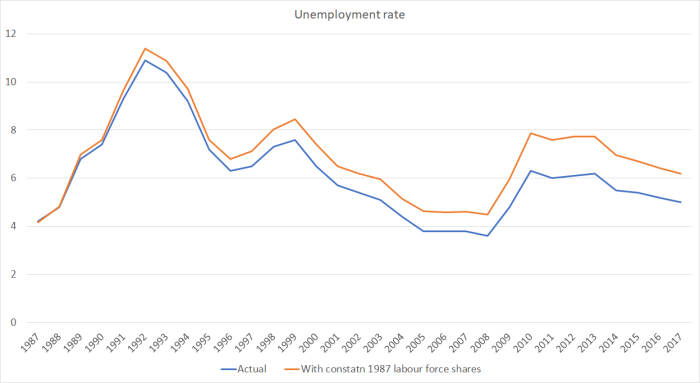
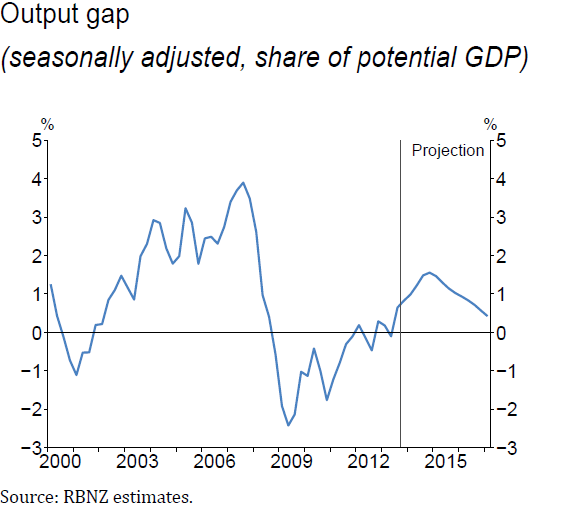
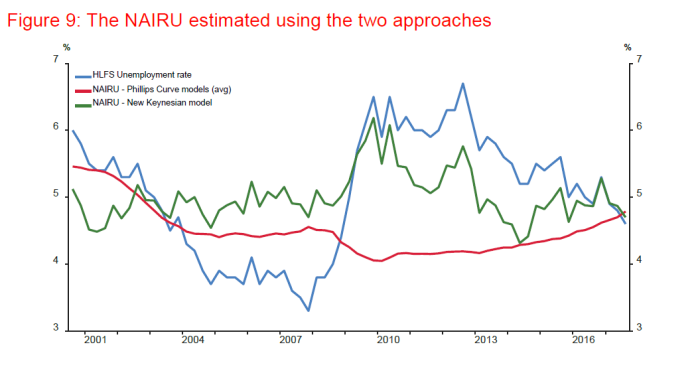
As we headed into the recession there was a lot of expectation of a strong rebound.  Even up to around 2012, respondents expected growth to accelerate.   For the last few years they haven’t expected any acceleration, and now the expect it to slow.  To be specific, respondents expect 1.6 per cent total growth in the first half of this year, slowing to 1.2 per cent in the second half of this year.     We don’t know quite why –  perhaps they expect immigration numbers to slow –  but it doesn’t speak of a sense that things are getting away on the Reserve Bank.   Similarly, two years out respondents expected that the unemployment rate would still be 4.9 per cent.

Perhaps these respondents will be proved wrong –  they often are, forecasting is like that –  but at the moment it doesn’t look like an imminent risk of core inflation rising much further, or to levels that might prove problematic for a flexible inflation targeter focused on medium-term inflation outcomes around 2 per cent.

What of the actual labour market data?   We have some problems at present because of the breaks in various HLFS series that occurred when the revised survey questions were put in place last year.  I’m still staggered they could have made these changes without running the two sets of questions in parallel for perhaps a year, to allow robust adjustments to be made for the discontinuities.   HLFS hours worked measures, employment measures, and probably participation rate measures all seem to have been affected to some extent.   We are pretty safe in saying that the number of people employed in New Zealand did not grow by 5.7 per cent last year (as the HLFS suggests).

What of the simplest headline number, the unemployment rate?   There isn’t much doubt that the unemployment rate has been falling over the last few years.  It is what one should expect after a serious recession, and with the stimulus to demand provided by low interest rates and large migration inflows (given that immigration typically adds more to demand in the short-term than it does to supply, thus tending to lower unemployment and use up spare resources in the whole economy).

But what should be somewhat disconcerting is that the unemployment rate has (a) gone largely nowhere in the last year, and (b) is still well above pre-recession levels (unlike the situation in many other advanced countries with their own monetary policies).   In the prevous boom, the unemployment rate got down to around 4.9 per cent as early as the start of 2003.     The picture isn’t much different if one looks at the broader (not seasonally adjusted) SNZ underutilisation measure.

U and under U

There still appears to be some progress in using up spare capacity in the labour market, but not very much at all.

What about the rate of job growth.  Fortunately, we have two measures: the (currently hard-to-read) HLFS household survey measure of numbers of people employed, and the QES (partial) survey of employers asking how many jobs are filled.   Unsurprisingly, the trend in the two series are usually pretty similar, even if there is a fair bit of quarter to quarter volatility.

employment

Since we know there are problems in the HLFS, and the QES doesn’t look to be doing something odd, perhaps we are safest in assuming that the number of jobs has been growing at an annual rate of around 2.5 to 3 per cent.   That isn’t bad at all. But SNZ also estimates that the working age population has been growing at around 2.7 per cent per annum.  No wonder the unemployment rate is only inching down.

One can do a similar picture for the annual growth rates in the two (HLFS and QES) hours worked series.

hours qes and hlfs

It was pretty clear that there was around a 2 per cent lift in HLFS hours worked from last June, just on account of the new survey questions.  It seems safer to assume that total hours worked across the economy might have grown by around 3 per cent in the last year.   That is faster than the growth in the working age population, pointing to some increase in effective utilisation, but not a dramatic one.  For what it is worth, in the latest releases, the two hours measures were both quite weak in the March quarter.

(And remember that nothing in the expectations survey data suggested pressures were likely to intensify from here.)

And what of wages?    There is a variety of measures.  The QES measure is quite volatile –  there are issues of changing composition –  and I don’t put much weight on it.  But for what it is worth, average hourly earnings rose 1.6 per cent in the last year on this measure, around the lowest rate of increase seen for decades.    The Labour Cost Index measures should get more focus (but have some challenges of their own).

lci inflation 2Perhaps there is some sign of a possible pick-up in the analytical unadjusted series (which doesn’t try to correct – inadequately –  for productivity changes) but it is a moderately volatile series, and the most recent rate of increase is still below the peak in the last little apparent pick-up a year or two back.

A common response is “ah, but what about the lags?”.  But as we’ve shown, there is little sign of any material tightening occurring in the overall labour market, no sign of expectations that that is about to change, and so little reason to expect much different wage inflation outcomes over the next couple of years from what we’ve seen in the last couple.  At best, there might be some slight pick-up in wage inflation (especially if the increase in inflation expectations is real), but any pick-up is going to be from rates of increase that have, over the last couple of years, been consistent with disconcertingly low rates of core inflation.

So where does it all leave me?  Mostly content that an OCR around 1.75 per cent now is broadly consistent with core inflation not falling further, and perhaps continuing to settle back where it should be –  around 2 per cent.   Of course, there is a huge range of imponderables, domestic and foreign, so no one should be very confident of anything much beyond that.   But it is worth bearing in mind that the unexpectedly strong net migration over the last few years has been a significant source of stimulus to overall domestic demand (including demand for labour).  In the face of typically too-tight monetary policy, it is part of why the unemployment rate finally started gradually coming down again after 2012.

Whatever happens to the cyclical state of the Australian economy, the National government is already putting in place immigration policy changes that should be expected to lead to some reduction in the net inflow of non-citizens, and two of the main opposition parties are campaigning on promises of much sharper reductions than that.   If such policy changes come to pass then, all else equal, the OCR will need to be set lower than otherwise.  It isn’t something that Graeme Wheeler can or should actively factor into this week’s OCR decision, but it may well be something the acting Governor needs to think hard about (if any decisions he makes are in fact lawful) after the election.