My post the other day about fiscal policy (and why it shouldn’t be eased in New Zealand now), together with a throwaway line about Kevin Rudd’s fiscal policy in the 2008/09 crisis, prompted me to spend a bit of time digging around in the data for the 2008/09 period for both New Zealand and Australia. This relates to the question “why did New Zealand have a recession and Australia didn’t”
Of course, even that statement is not as simple or uncontentious as it looks. The shorthand people are using here is the “two consecutive quarterly falls in real (seasonally adjusted) GDP”. On that measure, New Zealand actually had two recessions (from a peak in 2007q4 to a trough in 2009q2, and not having regained the previous peak, real GDP again fell for a couple of quarters from mid 2010). By contrast, real GDP in Australia fell in only a single quarter, in 2008q4.
But Australia did not just sail through unscathed:
- In per capita terms, it took two years for real GDP in Australia to recover to 2008q3 levels.
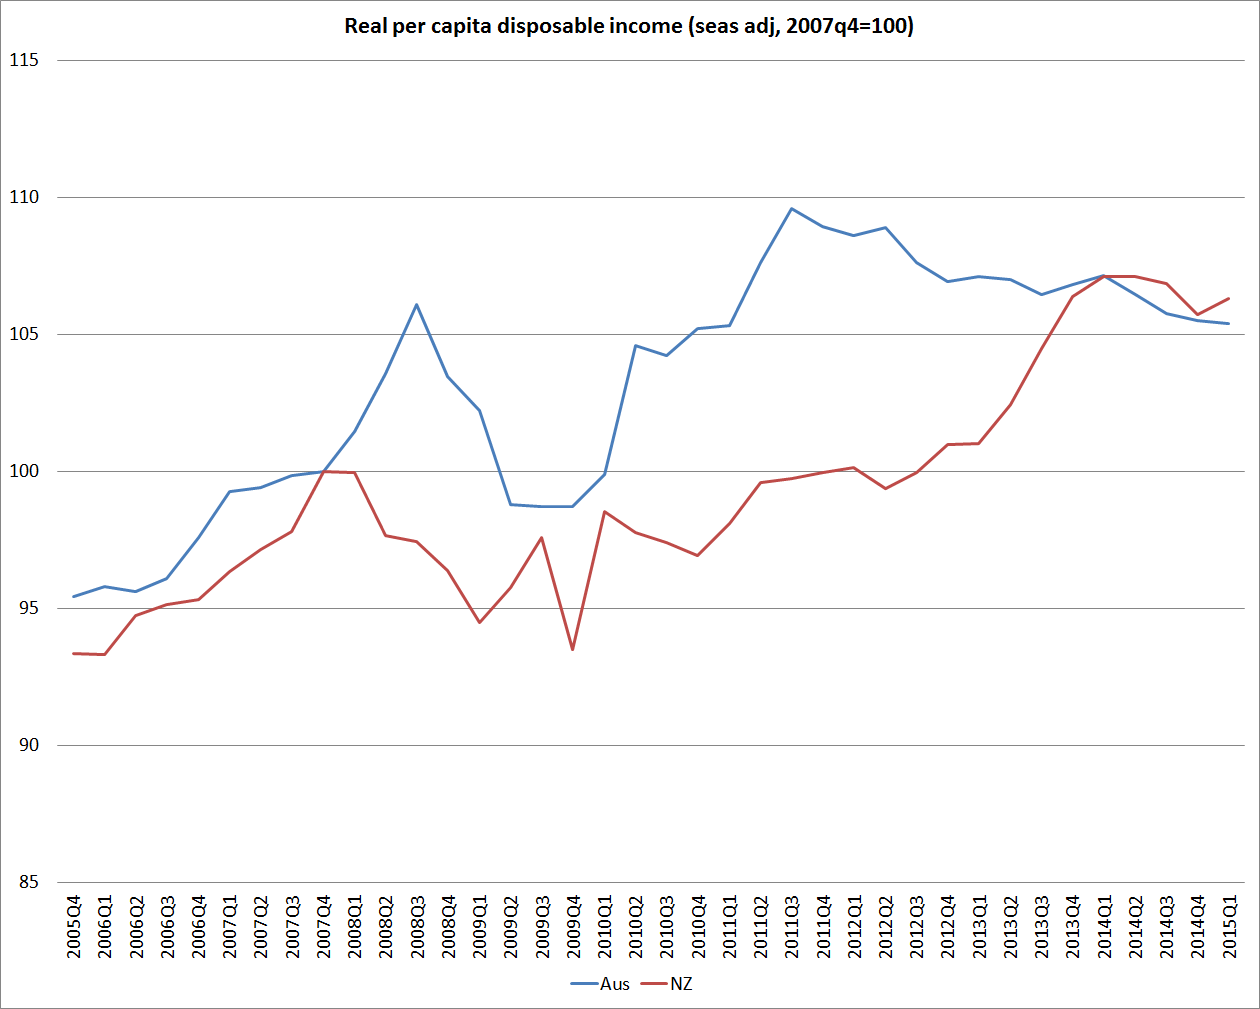
- When Australia’s terms of trade fell, real net national disposable income per capita (a measure that captures the direct effects of the terms of trade) fell by around 9 per cent. The similar measure in New Zealand only fell by around 5.5 per cent.
- Australia’s unemployment rate rose by around 1.5 percentage points in 2008/09, the scale of increase that might be expected in a mild recession (similar, for example, to the increase in unemployment rate in the New Zealand recession of 1997/98)
So, I don’t want to get hung up on the question of whether Australia had a recession or not. But it is pretty generally accepted that Australia was less hard-hit than New Zealand (and many other countries).
Some people reckon that the difference is fiscal policy. No doubt senior figures in the then Australian Labor government (if they could agree on anything) would like people to think so. The government, egged on by the Australian Treasury, announced two significant fiscal packages in the middle of the global crisis, one in October 2008 and another (much larger) one in February 2009. By contrast, neither New Zealand government (either side of the November 2008 election) did any material amount of discretionary fiscal stimulus in response to the crisis.
But what I find striking is how similar New Zealand and Australian fiscal policy was, in bottom line terms, during the second half of the 2000s. If we did not have a crisis-response package in late 2008, we had had a very expansionary Budget earlier that year. And both countries had been running down structural surpluses for several years.
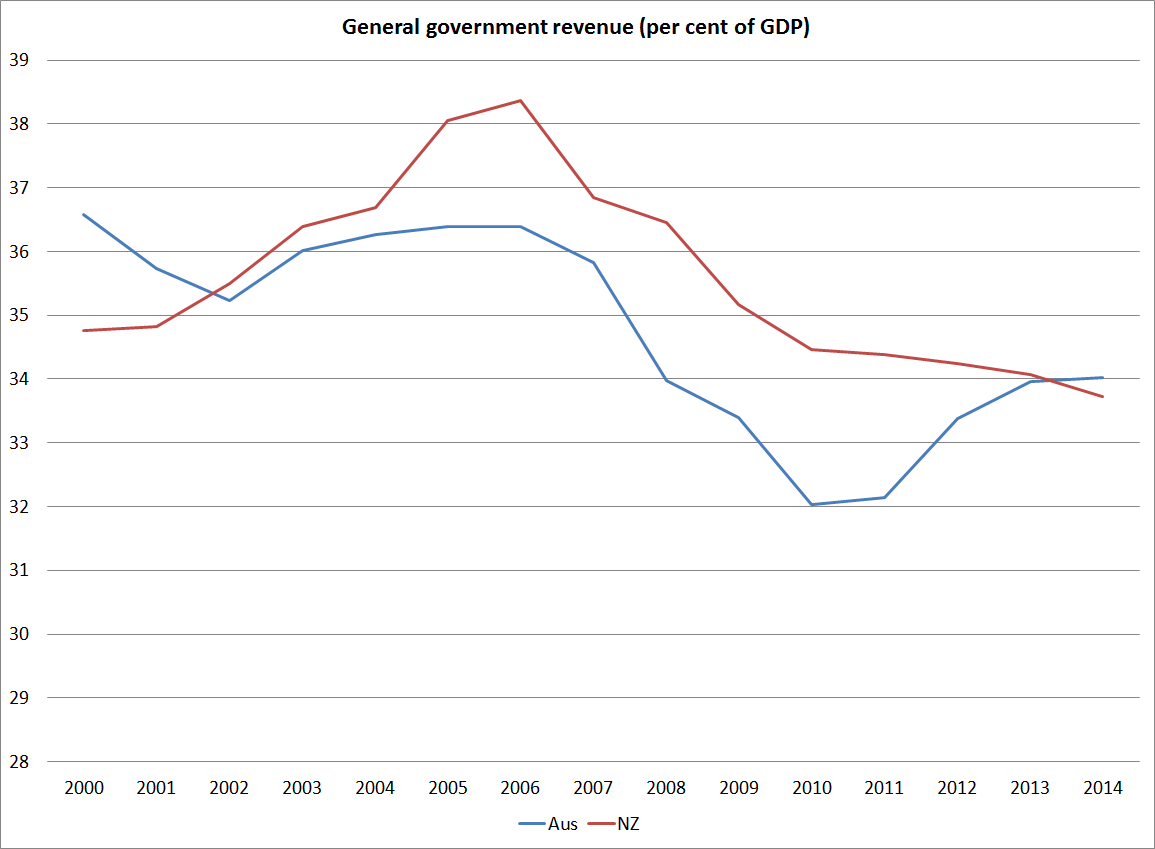
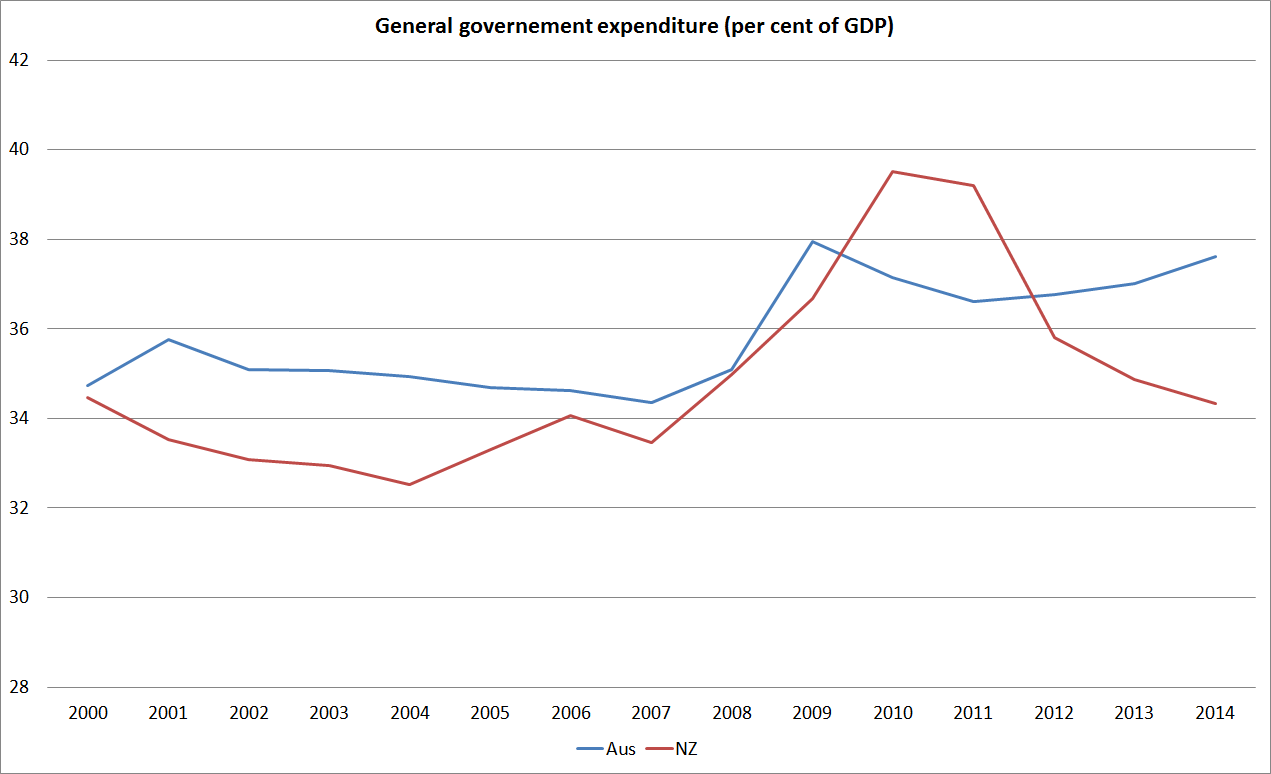
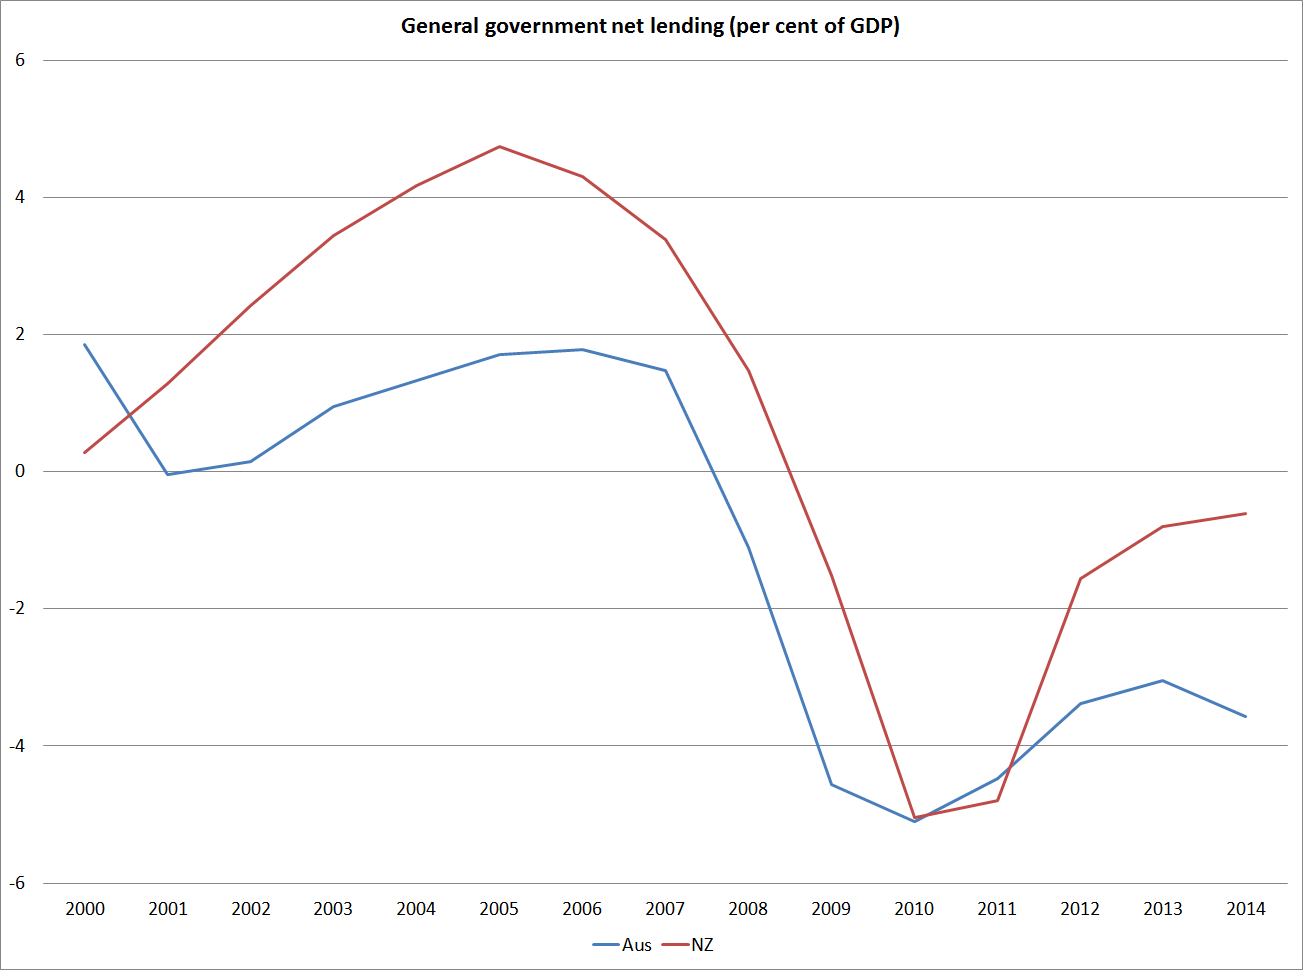
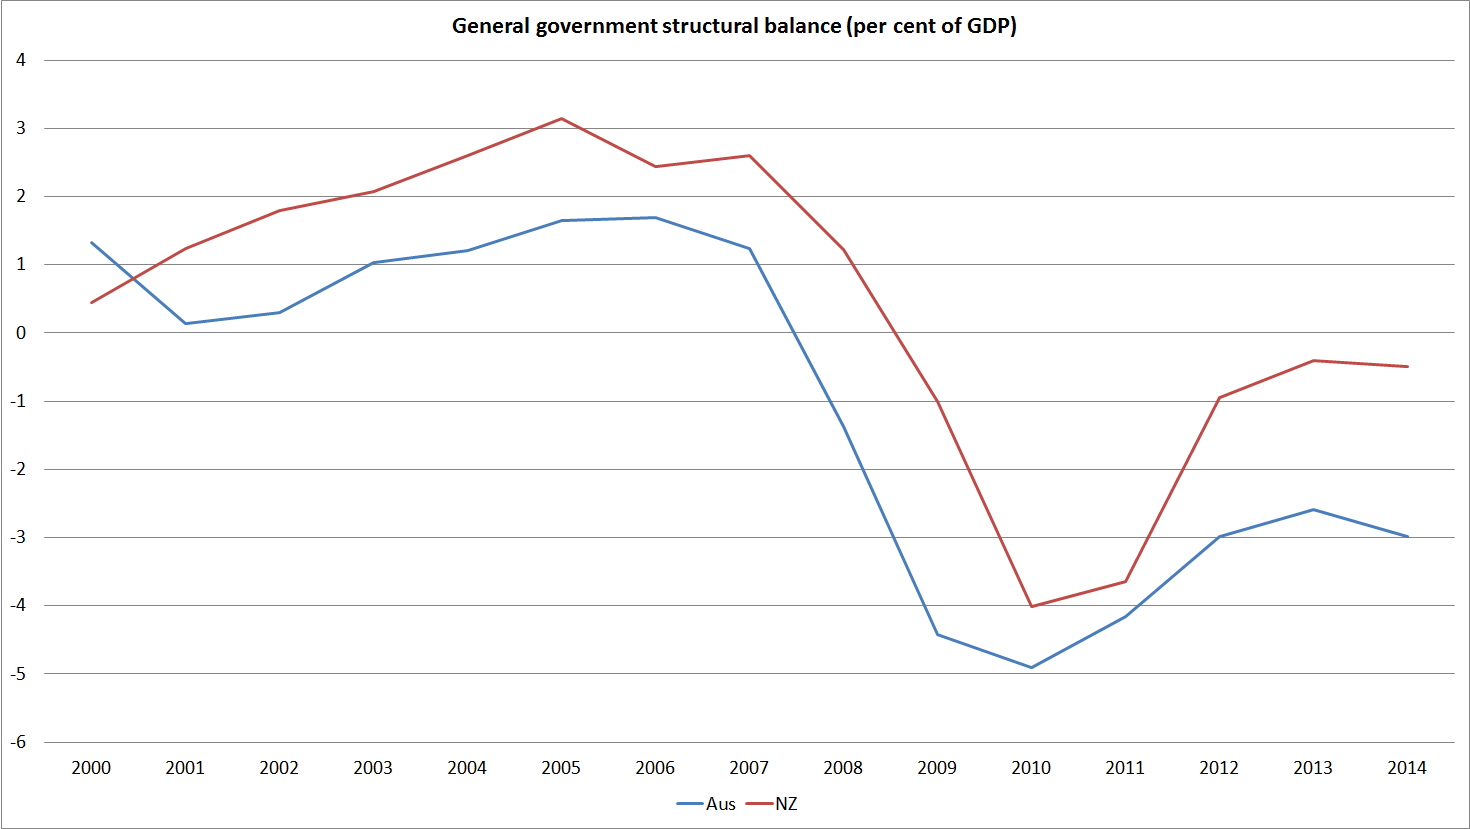
Here are some charts from the IMF WEO database:
For revenue
For expenditure
For the fiscal balance
And for the (estimated) structural balance
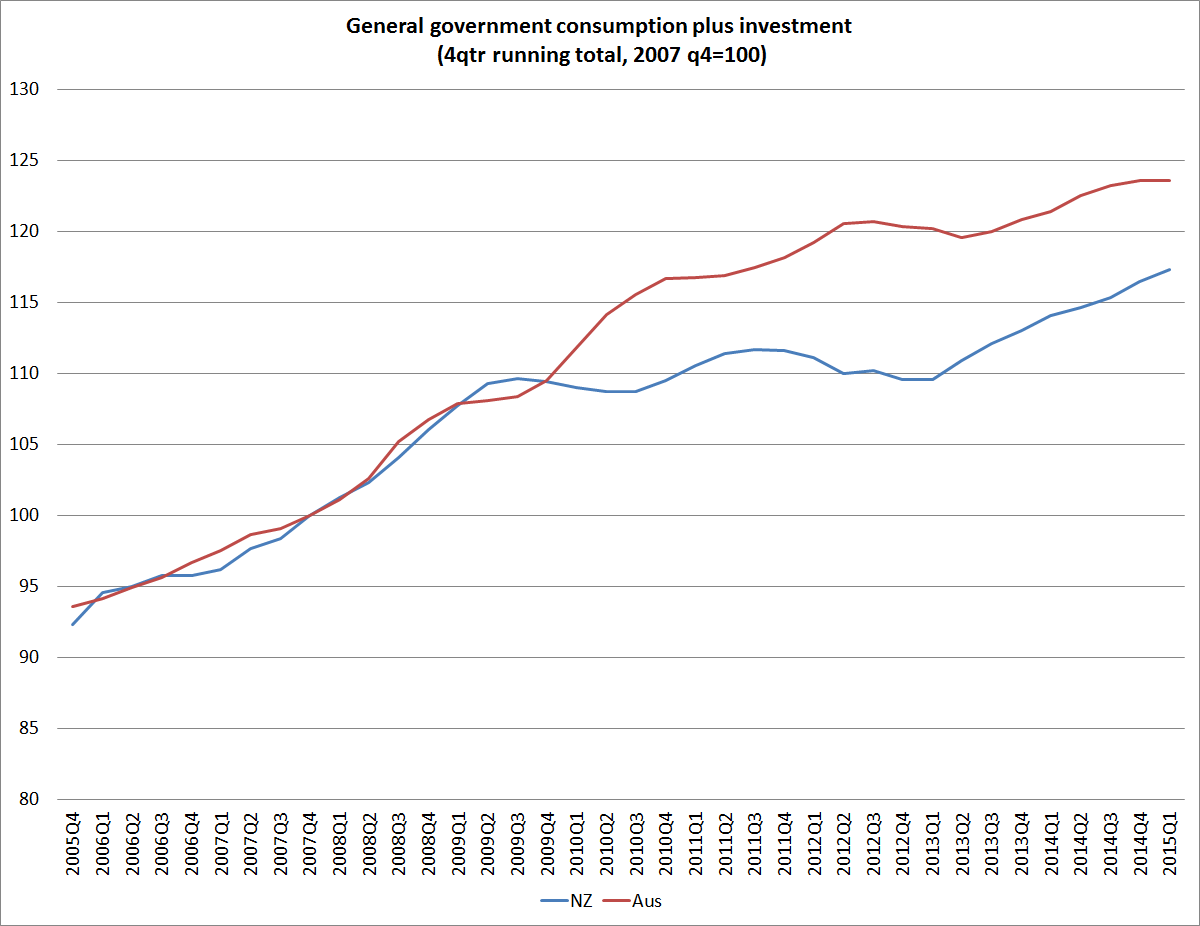
And, perhaps most starkly, here are direct real government purchases (consumption and investment) for the two countries (indexed to 10o in 2007q4). It is not until the start of 2010 that one can see any material difference between the two lines. New Zealand’s recession (like those of most other OECD countries, ended in mid 2009).
Of course, these are highly aggregated numbers, and it may be that there was something in the specific make-ups of the fiscal programmes that meant fiscal policy was much more effective in Australia. But it isn’t obvious, and it probably shouldn’t be that surprising since in both countries the central banks will have been taking fiscal developments into account in deciding how much to cut their respective policy interest rates. As it happened (and unsurprisingly) the Reserve Bank of New Zealand cut the OCR by much more (575 basis points) than the RBA (which cut by 400 basis points from the end of 2007 to the trough in April 2009 – having raised the cash rate in early 2008).
So if fiscal policy differences don’t appear to explain why Australia did less badly through this period, what does? In the New Zealand story, the drought at the start of 2008 didn’t help.
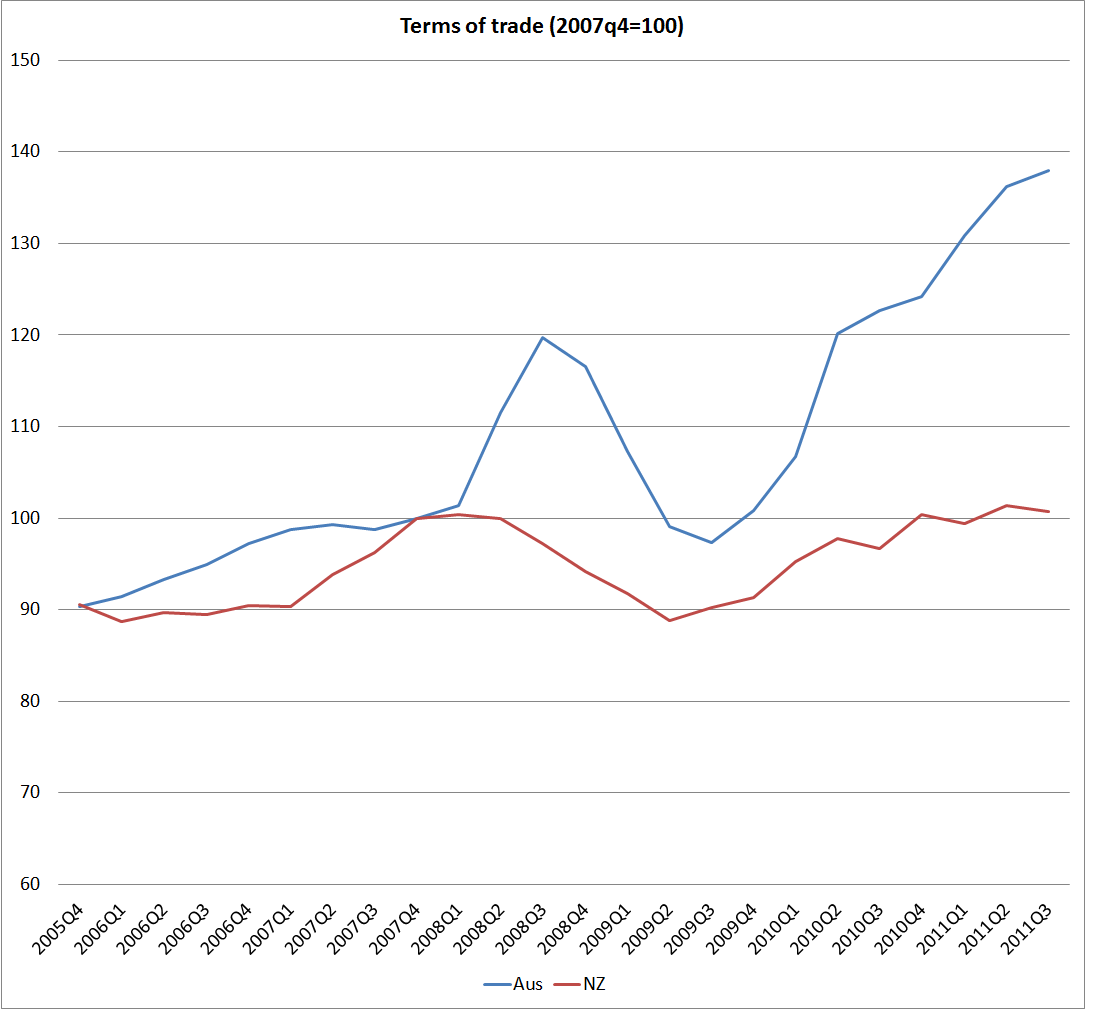
More generally, the terms of trade are very important to both countries, and in both countries they are quite volatile. In New Zealand, changes in the terms of trade flow more directly into changes in household incomes, since most of the tradables sector is domestically owned (FDI in New Zealand is heavily concentrated in the non-tradables sector). By contrast, most of the Australian minerals sector (where the terms of trade volatility arises) is foreign-owned, so that Australian residents’ incomes are not so directly affected. But the Australian minerals sector is very capital intensive, and huge investment programmes drive off actual and expected minerals prices.
What happened to the terms of trade in the two countries? New Zealand’s increased by around 10 per cent in 2007, and then started gradually falling away again. But Australia’s terms of trade rose by around 20 per cent in 2008. The terms of trade then fell away almost equally sharply before the effects of the Chinese rebound drove hard commodity prices on to their 2011 peak. But what that timing difference meant was a quite different environment for the Australian economy in 2008 than was the case in New Zealand (or most other OECD countries).
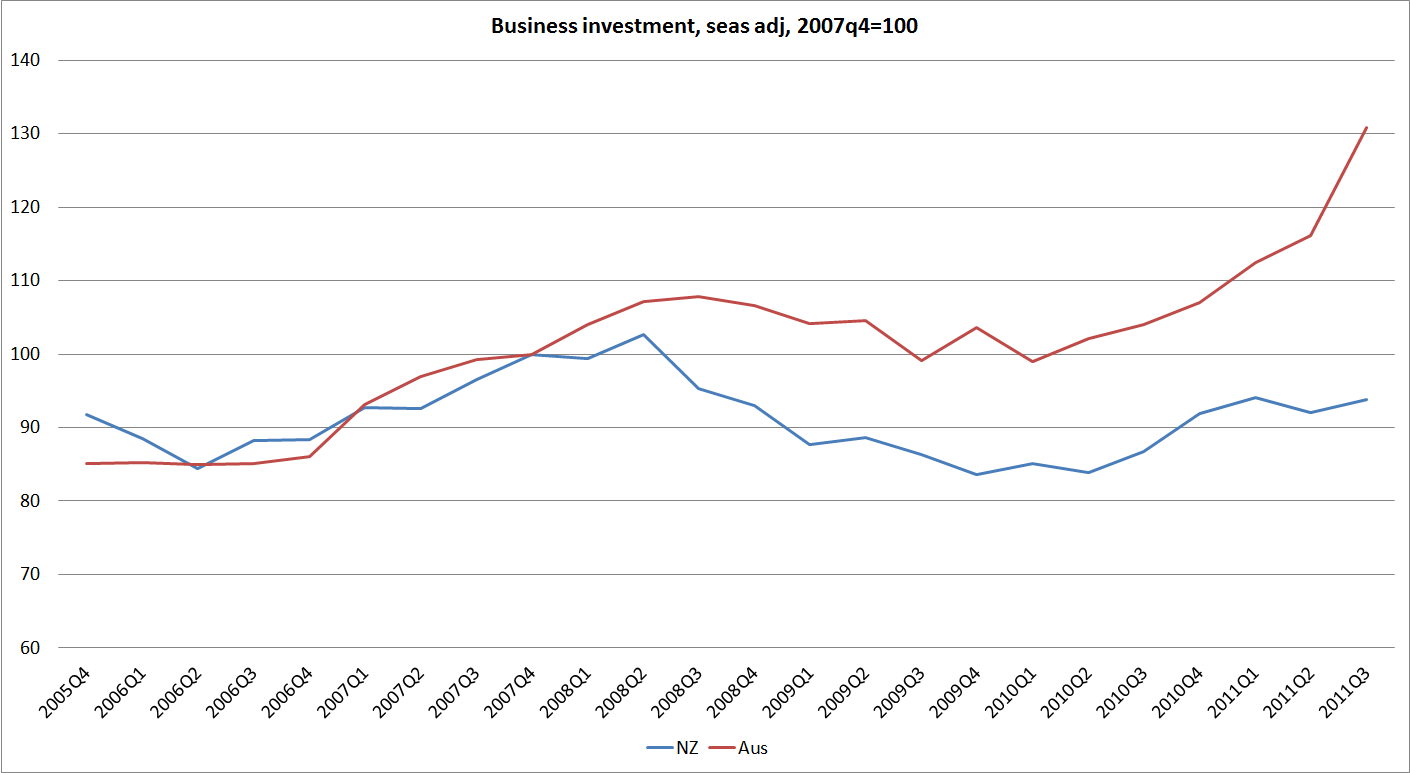
One important place where the difference shows up is in business investment. Australia’s business investment peaked the same quarter as the terms of trade and – no doubt reflecting long lags on minerals investment projects, and perhaps the sharp fall in the exchange rate – never fell as far as New Zealand business investment did. As has been pointed out previously, New Zealand’s business investment boom in the 2000s appears to have been concentrated in the non-tradables sector.
A similar timing difference is apparent in respect of residential investment. New Zealand’s peaked in 2007q3 and Australia’s peaked in 2008q3. It looks as though timing differences (both domestically and particularly in the terms of trade) were enough to provide just enough momentum for Australia to avoid the two quarters of falling real GDP.
In closing, here is the chart of RGNDI (for NZ) and RNNDI (for Australia), both indexed to 2007q4 (the peak of the last cycle for NZ, the US, and a number of other OECD countries). It helps highlights just how important that 2008 terms of trade surge was in limiting the slowdown in economic activity in Australia through 2008.

Very interesting as usual Michael.
Looking at the reverse scenario, i.e. fiscal consolidation, what is your interpretation of the impact of the Mother of All Budgets in 1990-1? I know it was very unpopular at the time, but I also vaguely remember that output rebounded very strongly in the early 1990s. How much fiscal consolidation do you think the economy could handle today?
LikeLike
A lot comes down to how much monetary policy would respond. Over the years, I’ve argued that the key thing about 1991 and the subsequent rebound wasn’t that fiscal tightening itself induced a huge wave of renewed confidence (if anything the political position of the govt and Ruth Richardson in particular was sufficiently threatened that it wasn’t wise to place very much confidence in the enduring nature of the cuts) as the huge cuts in interest rates that year. That was partly about global easing, partly about inflation expectations falling, and partly about a rather-belated recognition by the Reserve Bank of the severity of the situation. As we woke up to just how severe the recession was we let interest rates plummet, and with it (again belatedly) the exchange rate (and if I’m criticising anyone here, it is me as much as anyone – I was one of the hawks, and my management role was of a team responsible for providing the mon pol advice to the Governor).
What about further fiscal consolidation now? Personally, I think it would be a little unwise – risking exacerbating the downturn – unless the Bank were really to respond very pro-actively.
LikeLike
Australia didnt have an earthquake level one of their major cities either, so that helps.
LikeLike
Yes, altho the main quakes weren’t until 2011, and my focus in this post was on the 08/09 period.
LikeLike
how come OZ and NZ share the colours instead of having the one colour all the time?
Structural parts of the budgets are highly problematic. Ireland went from a structural deficit of around 0.5% of GDP to 6% or more if my memory serves me right and there was NO stimulus there. Quite the reverse!
I would say a stimulus program however devised has a larger impact on the economy than one without.
LikeLike
Sorry about the colours
Of course what matters is not the label “stimulus package” but the actions of discretionary fiscal policy. We had a highly expansionary Budget in 2008, and you had two “stimulus packages” (albeit prob larger as a % of GDP) than ours.
LikeLike
now that makes a lot of sense. So like Canada you had yours After the fact.
LikeLike