The Reserve Bank has long been averse to too much focus on the unemployment rate. Some of that was political. Opposition MPs back in the 1990s would try gotcha games, trying to extract estimates of a non-accelerating -inflation rate of unemployment (NAIRU) with the aim of then being able to tar us with lines like “Reserve Bank insists full employment is x per cent unemployment” [at the time x might have been 7 per cent or more] or “Reserve Bank insists on keeping x per cent of New Zealanders unemployed”. So there was an aversion to using the concept, and most certainly to writing it down. If you don’t write things down, it is hard to have them OIAed.
But for decades there has been something a lot like a NAIRU embedded in successive versions of the models the Bank uses as a key input to the forecasting process. But there was still an unease. Some of it was those old political concerns. Some of it was the aversion to being pressured into any sort of dual objective model – even though discretionary monetary policy was only ever introduced to allow short-term macro stabilisation together with medium price stability.
In the last decade or so, it seemed to be some mix of things. In 2007, the unemployment rate was down at around 3.5 per cent, but the official view at the time was that the overall economy was more or less in balance (as I noted yesterday the output gap estimates then were positive but quite small). So, the unemployment rate tended to be discounted. To the extent there were NAIRU estimates implicit in the thinking, they had been trending down for 15 years. Perhaps, some felt, 3.5 per cent unemployment wasn’t much below a NAIRU at all.
In the years after the 2008/09 recession, there seemed to be two problems. The first was a quite genuine one. The HLFS unemployment rate numbers were quite volatile for a while, and while it was clear that the unemployment rate was still quite high, it was hard to have much confidence in each new quarterly observation. The rise in the unemployment rate in 2012 only further undermined confidence among some of my then colleagues. The economy seemed to be recovering.
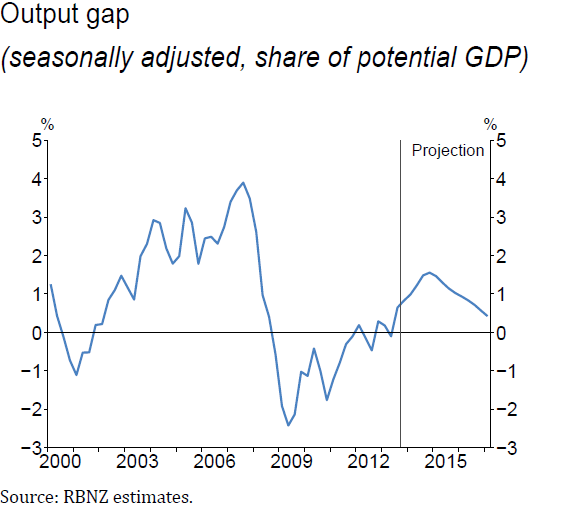
So there had always been a tendency to discount the unemployment rate. Odd short term developments in the series itself reinforced that, and then as the recovery began to develop the Bank kept convincing itself that the output gap had all but closed. If the output gap – which tended to be central focus for much of the analysis, even though it was something of a black-box, and prone to significant revisions – had really closed, then surely the labour market must also be more or less in balance? If the unemployment rate appeared to suggest otherwise, so much the worse for that particular indicator, which many at the Bank had never much liked. When the Bank started the ill-fated tightening cycle in March 2014, they thought then that excess capacity had already been used up for a couple of years. This is the output gap chart they ran then.
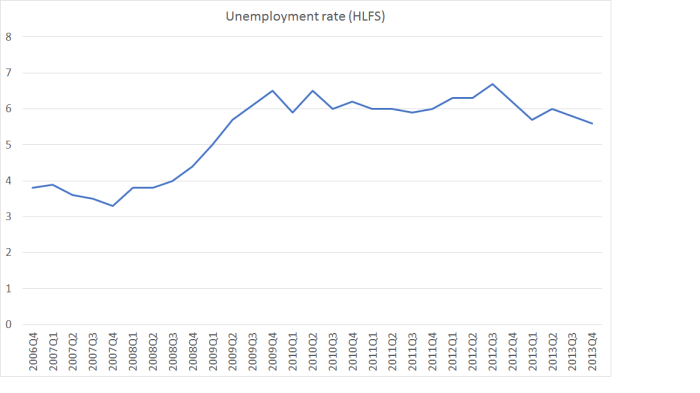
At the time, the unemployment rate was still 5.6 per cent
(Contrast that output gap chart with the one from yesterday’s MPS, which I included in yesterday’s post. At first glance, they look quite similar, but whereas in 2014 they thought excess capacity had been exhausted in 2011/12, now they think it was only exhausted in 2013/14.)
Various people had various ideas for how best to look at labour market data. But mostly the unemployment rate was just ignored.
A year or two back, some US researchers had done an interesting exercise, trying to combine formally the information in a whole variety of labour market indicators, to distill an overall picture. And somewhere along the line, someone got the idea of doing something similar for New Zealand. And thus was born the Reserve Bank’s Labour Utilisation Composite Index, with the pleasing acronym of LUCI.
One day last April, Reserve Bank Deputy Governor Geoff Bascand gave a major address on monetary policy matters, Inflation pressures through the lens of the labour market. As I noted at the time, it was little odd for him to be giving the speech – as his day job was mostly responsibility for notes and coins, and the Bank’s corporate functions. Then again, his ambition for higher office was pretty apparent, and earlier in his career he had led the Department of Labour’s Labour Market Policy Group. Geoff on labour market matters should have been worth listening to.
The broad thrust of the speech was that high immigration wasn’t going to put much pressure on demand (contrary to the usual experience, and past Bank research), and that the labour market was pretty much operating at full capacity. In support of these propositions, the Bank simultaneously released not just the speech, but three new Analytical Notes. Since I had been harrying the Bank about its change of view of immigration, I focused then on the two immigration research papers, and identified a number of issues with them. At the end of a long post I noted
There is a more material on other topics in Bascand’s speech, and another whole Analytical Note on other labour market issues which I haven’t read yet. I might come back to them next week.
But I never did. Other things presumably distracted me, and thus I never got round to reading the Analytical Note introducing LUCI. I didn’t until yesterday afternoon – I’d heard the Governor, or the Chief Economist, mention it at the press conference, and it was a wet afternoon, so I went and downloaded the paper.
The Reserve Bank has given quite a lot of attention to this brand new indicator. In the Deputy Governor’s speech, it gets three whole paragraphs
Over the business cycle, a key driver of wage growth is the balance of supply and demand, or labour market ‘slack’. However, the unemployment rate is an inadequate indicator of labour market slack, particularly when the participation rate fluctuates. Researchers at the Bank have recently constructed a labour utilisation composite index, or LUCI, to help address this problem. Such indices combine the information in a large number of labour market variables into a single series of labour market tightness, and are used internationally to help gauge labour market pressures. The New Zealand index uses official statistics such as the HLFS and survey measures of the difficulty of finding labour, such as the QSBO.
By construction, the LUCI has an average value of zero. A LUCI value above zero indicates greater labour market tightness than usual – a value below zero indicates greater labour market slack than usual. Our research shows that, historically, a higher LUCI has been associated with stronger wage growth.
The LUCI suggests there was a large degree of slack in the labour market at the trough of the 2008-09 recession. The LUCI then gradually returned to zero, and has been around that level since early 2014 (figure 7). This movement is consistent with the range of the Bank’s suite of output gap indicators.
This wasn’t just some speculative new tool dreamed up down in the engine room by smart researchers, but still needing road-testing. The Deputy Governor (presumably with the approval of the Governor and the Chief Economist) seemed sure it was action-ready.
Consistent with that approach, a chart of LUCI has appeared in all but one of the five MPSs since that speech. Here was LUCI as she appeared yesterday
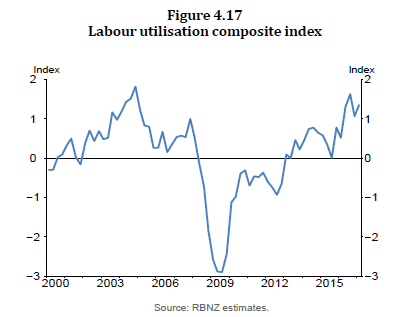
On the Deputy Governor’s telling
A LUCI value above zero indicates greater labour market tightness than usual – a value below zero indicates greater labour market slack than usual.
In other words, on that particular interpretation, labour market tightness was now more severe than it had been in 2007 (just prior to the recession), and almost as severe as at the peak of the series in around 2004.
And, of course, Geoff Bascand didn’t just make up that interpretation. It was what the researchers had said in their Analytical Note, almost word for word. It was also what the footnotes on the LUCI charts in the MPSs said. At least until yesterday. In yesterday’s MPS, slipped in so quietly, the interpretation of LUCI had changed rather materially. The chart was still there, it still looked the same as ever. But below it, it has these words written
Note: a positive value indicates a tightening in labour market conditions
Lay readers may not immediately notice the difference, but it is substantial. When the indicator was launched, with some fanfare (there are many clever new indicators, and not many get three paragraphs in a Deputy Governor speech), a positive value was interpreted as the labour market being tighter than usual (thus the pesky single indicator, the unemployment rate could keep on being largely ignored). But now a positive value simply means that the labour market is a bit tighter than it was last quarter. If there was lots of slack last quarter, it simply doesn’t matter to the indicator – all that matters is the direction of change.
The Bank didn’t draw this to readers’ attention at all. They didn’t change the heading on the chart either. It was a bit naughty really. What it means is that whereas we once had an indicator – using 16 different variables – that might have suggested the unemployment was completely misleading as a measure of slack, what we actually have now in LUCI saying similar things to the unemployment rate. The unemployment has been edging down, and LUCI has been positive. But that LUCI number is now felt to tell us nothing at all about the absolute level of labour market slack (or even the level relative to a long run of history).
I don’t quite know how the Bank fell into this – except, perhaps, for the wish (for a labour market measure suggesting the market was at full capacity – in line with the output gap estimates) getting the better of hard-headed challenge and scrutiny.
The approach they used to construct LUCI was very much the same used to construct the sectoral factor model of core inflation. In essence (there), get the rates of price increases for all the CPI components, and look for a common theme (or “factor”) that runs through them all. It seems to work quite well there. All the variables are expressed the same way (percentage changes). But LUCI is a bit different. Here is the list of all the variables used.
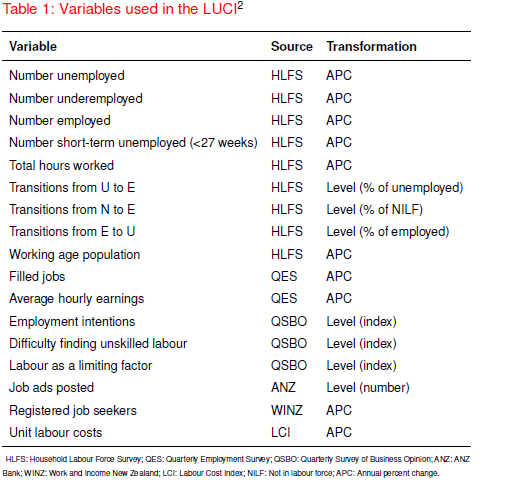
They take each variable and standardise it relative to its own mean.
But it is an odd mix of variables. There are annual percentage changes mixed in with levels. And some of those levels measures (eg the QSBO ones) are the outcome of questions that are actually technically expressed in change terms. It is also a mix of quantity measures and price (wage) measures. When I looked through the list, the first real oddity that struck me was that unemployment itself is not expressed as a percentage rate. Rather, they take the number of people unemployed and calculate the percentage change. If, then, every single person was fully employed – so the labour market was very tight – this component (used in calculating LUCI) would be showing a zero percentage change. They’ve done the same thing to all the quantity variables, so it should have been obvious from the start that what they were doing (at least for that half of the inputs) was looking at variables that would produce a change indicator, not a levels one.
I understand why they did it. The unemployment rate trended down for 15 years or so. The gap between the actual unemployment rate and the average unemployment rate wouldn’t be a very meaningful indicator. But it meant, almost inevitably, that the new indicator couldn’t be an indicator of absolute labour market tightness, only (at best) an indicator of changes in tightness.
But there are other problems. Think about what would happen if (to be deliberately extreme) the population doubled, and yet there was no change in “true” labour market tightness. That isn’t far from the Reserve Bank’s story about the recent immigration shock – they told us again yesterday that, contrary to past common experience, they think the demand and supply effects have more or less offset each other.
But if the population doubled, and there was no change in “true” labour market slack, we would still expect to see employment, numbers unemployed, the number of short-term unemployed, numbers underemployed, the number of filled jobs, hours worked, the working age population, the number of job ads, and the number of registered job seekers all increase (that is roughly half the variables in LUCI). The unemployment rate (%), for example, might stay the same, but both the numerator and the denominator would increase a lot. Since LUCI uses annual percentage changes, it seems highly likely that such a shock would show up as a big increase in LUCI in the year the population shock happened (in my extreme examples, the APCs would go to 100 per cent that year), even if there had been little or no actual change in labour market tightness.
It seems astonishing that, for a variable launched by a Deputy Governor in a speech playing down the net demand effects on a large immigration shock, this issue never seems to have occurred to them.
There are other, probably more minor and mundane, problems too. These ones probably weren’t foreseeable in April last year, but probably still should have been highlighted as they became apparent. The revised HLFS was introduced in June last year. It is pretty clear that the modifications to the questions have led to material step changes in the HLFS measure of hours worked and of employment (you can see the anomalies in the charts in this post from earlier in the week). (For some reason, they don’t even use the QES measure of hours in LUCI). Perhaps a distortion of this sort to only two of the component variables won’t have affected the common factor that the model is trying to identify. But we don’t know. I hope the Reserve Bank does. This particular problem will wash out of the data in the next HLFS release (since a year will have passed, and LUCI uses annual percentage changes), but for now it is another reason not to have much confidence in LUCI as any sort of indicator of labour market tightness (level or changes).
I did put some of these points to the Reserve Bank yesterday, mostly just to check that my understanding of the technical points was correct. I had a helpful response this afternoon which essentially establishes that they are (obviously I’m not associating the Bank with the interpretations I’ve put on those technical points).
Overall, it isn’t a case of the Reserve Bank at its best. I have no problem at all with them doing the research in the first place. We should always be looking for new or better ways to understand what is going on, and how best to combine sometimes conflicting bits of data. But it doesn’t have the feel of something that was at all well road-tested before being launched as a major indicator variable. And then, when they did finally realise that it was much more like an indicator of changes in labour market pressure rather than the level of pressure, that recognition was sneaked through without even an explanatory note, leaving anyone who had taken the earlier use of LUCI at face value none the wiser unless they were a particularly assiduous reader (and I’m usually not, when it comes to changes in footnotes on charts).
We now have a recognition that LUCI isn’t a measure of overall pressure on the labour market. It may be, loosely speaking, an indicator of changes in labour market pressure, but even then that reading is made more difficult when you get large population shocks (of the sort that NZ is prone to, with quite variable large immigration flows, in a way that many other countries are not), and when the Reserve Bank repeatedly assures us that its overall interpretation is that this particular population shock isn’t putting additional net pressure on demand, and may even be easing capacity pressure in the labour market.
We really should expect better from our central bank. Speeches like Bascand’s, and documents like the MPS, will have had heavy involvement from all the members of the Governing Committee – the Governor himself, the incoming acting Governor, the incoming Deputy Chief Executive, and the long-serving Chief Economist. One can’t help thinking that they’d have been better served taking the unemployment rate – actually designed directly as a measure of excesss capacity – and wage developments rather more at face value. And of recognising that, contrary to LUCI, no serious observer thought that the labour market was at its tightest in 2004. It isn’t much harder than that.

Labor utilization level is hours worked / working age population. It’s measurable. We always had good labor utilization and low output per hour.
LikeLike
But remember that they were looking for an alternative/better cyclical indicator, not a (trending) structural one.
LikeLike
17 variables can be made to match any 18 data points but the resulting formula is meaningless. Every extra variable reduces intuitive understanding. This is similar to the climate change models where only the early simple ones can be relied on.
It seems unrelated to reality – would economists & bankers gain more understanding of employment data by a prolonged period of unemployment? Grumpy.
Thanks for the analysis; I do think I grasped what you were saying.
LikeLike
Impossibilities and The tyranny of matrices, variables, numbers, outcomes
What isn’t stated is the possible permutations than can be achieved by 18 variables
Add 1 additional variable and the number of possible outcomes is mind-numbing
Change the value of 1 of the variables and the number possible outcomes is explosive
LikeLike
Here I’ll bend over backwards a bit to defend the researchers themselves. The statistical exercise is a bit more subtle than that, altho it does suffer from the problem that they had to work with only 15 years data, which is basically two upswings and one recession, so any formal results were never likely to be that reliable.
To my mind, the problem isn’t with the researchers, but with how quickly senior management rushed it into production (so to speak) and then tried to cover their backtrack when they finally realised that the thing wasn’t saying what they had thought it was. And character/judgements are two of the key things that should be looked for in a new Governor.
LikeLike
As the labour gets harder to get and keep then management react by spending on ;labour saving devices. Labour is cheap until you can’t get the quality you want and as production ramps up its becomes more viable to use capital for labour saving devices.
That’s where we are now. Labour, trained and able to do is harder to get and keep so investment picks up. That of course means more labour available. Virtuous circle aided by the current bank policies of lending to businesses rather than housing. People like UDC with billions to spend. They are making it a lot harder for housing, no question.
Then there is this.
“ICT service and software exports doubled between 2008 and 2014, making ICT our third largest export. And a report released last year by NZTech showed in 2015 our tech sector contributed over $16 billion to GDP, exported over $6 billion in goods and services and employed 98,900 people.”
The Tauranga MP says supporting growth of the New Zealand tech sector is one of the key outcome areas identified in the government’s Building a Digital Nation report.
– See more at: http://www.sunlive.co.nz/news/153976-supporting-digital-growth-bay.html#sthash.1x77en9O.dpuf
My question about these figures is if ICT is so good at exporting where does that show up? Presumably, like tourism, we should be making more exports per GDP but it seems we are not. Are our traditional exports performing so badly that we are no further ahead or is there some explanation I can’t see?
LikeLike
Those technology exports will be a mix of goods and services exports. I have been meaning to download the report to understand how they get to those rather large numbers (after all, a great deal of goods and services could be said to have a tech dimension). Bear in mind that $6bn is only about 2.5% of the economy – good to have no doubt, but I suspect the next doubling is going to be quite a bit harder.
LikeLike
Variables used in LUCI
Just one of the variables, Registered Jobseekers, is from WINZ
I have often wondered
(a) why StatsNZ do not use WINZ data on the number of people receiving unemployment benefit
(b) The unemployment benefit data is not published
(c) The NJS New Jobless Claims are not published weekly as in the USA
LikeLike
I’m no expert but I think because the unemployed includes a lot of people not eligible for the unemployment benefit the household labour force survey is the preferred measure.
The unemployed spouse or defacto of an in-work person is one obvious big distortion.
LikeLike
For many years I have followed the US – Weekly New Jobless Claims – NJC – it is published weekly – it is “real data” derived from Government activity and only includes those who are eligible to get on to the roll
The real value is the “weekly movement” rather than the absolute numbers
Have you ever been chosen to participate in the HLFS survey or have you ever known anybody who has?
LikeLike
No I can’t say I have been asked and I do agree with you about surveys. One obvious issue is with phones – if that is the preferred means of contact it will be highly distorted because a lot of the poorer, and more people generally no longer have a landline. Maybe they random call possible cell phone numbers but I doubt it.
A survey using house visits is going to be just as problematic but we can get real data from PAYE returns that should pick up trends at the very least.
LikeLike
As it happens, starting with the March quarter HLFS (just published), my wife and I are in the HLFS sample for the next two years I think.
We were informed by letter that we were in the survey, and for the first survey we had a home visit and interview from the SNZ staffer (subsequent surveys done by phone).
Having said that, my confidence in the HLFS was slightly dented by the experience. First, I was a bit surprised to find that I could answer not just for myself but also for my wife. They did ask if I was comfortable doing so, and I was, but I’d probably have erred towards answering yes anyway to save her the bother of a separate visit at another time.
For some things, answering for a spouse was easy. But for her hours worked wasn’t so easy. They wanted both usual hours and actual hours, and even when I was working I might have struggled to give a very accurate estimate of my own hours the previous week. But on this occasion I commented on my wife’s hours, “she usually works around x hours, but she did comment that she’d had a slower week last year so put her down for x-2 hours”. The interviewer responded, “oh don’t worry about that, we’ll just put her down for x”. I was somewhat takeaback by that response, and went to the effort of passing it on to the manager at SNZ responsible for labour market statistics, who agreed that it didn’t seem an appropriate way to have treated my answer.
Overall, the HLFS isn’t ideal, and often one will want to use information from other data. But I’m not aware that there is any other source that gets at intentions – ie are you looking for work, and available to start next week if you find a job. That is unemployment, and – allowing for small quarter to quarter variation – the unemployment rate has proved a pretty useful indicator over long periods of time.
LikeLike
[…] road-tested and socialised the background research. Persevering readers may recall the saga of LUCI , touted a couple of years ago by a Deputy Governor as the latest great thing, allegedly […]
LikeLike