I was having a conversation with someone the other day, trying to explain both what data there were on movements of people into (and out of) New Zealand, and which data was useful for what purpose. Reflecting on that afterwards, it seemed that a post might be useful. This follows on from my post last week on the Herald’s misleading article on “work visas”, but is intended to be much general, not aimed at anyone or any recent comment in particular, and to be something I can refer (others) back to.
For those who find my discursive posts a bit trying the quick summary is that if you want to talk about immigration policy – something that only affects non-citizen movements – use the MBIE data. MBIE, of course, could and should make it much easier to do so.
Being an island a long way from anywhere, it is pretty easy to count pretty reliably the number of people coming into or leaving New Zealand. Perhaps there are a few illegals who never declare themselves, but even if so it is a trivial issue for us.
And, of course, when you enter or leave New Zealand you have to fill in, and hand over, an arrival or departure card before you can continue with your journey. We know exactly how many people come in and go out. In principle, the data could be available daily, but in practice monthly is just fine. Statistics New Zealand publish that data.
But these data often aren’t that useful for anything. Even seasonally adjusted, this is what the quarterly data look like (in all chart in this post, I’ve annualised any quarterly or monthly data, so that you can implicitly benchmark it against the headline net annual inflows people are most familiar with).
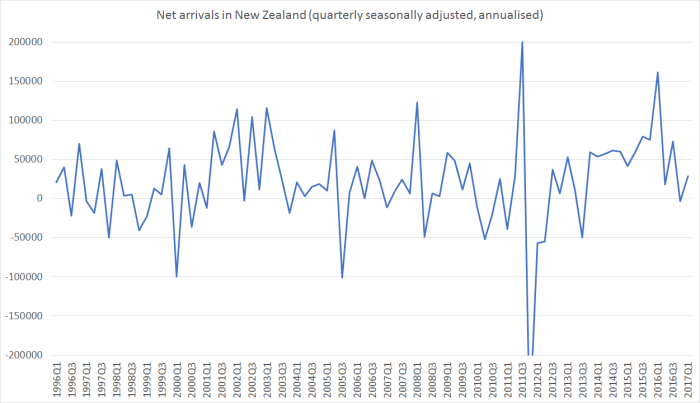
There is a huge amount of short-term volatility, and any new quarter’s information has almost no information value at all. After the event you can see the big net inflow periods around 2002/03 and over the last few years, but it takes a lot of time to discern any trends. Some of the volatility relates to identifiable one-off events: one can readily see the short-term inflows for the last Lions tour in 2005, and for the Rugby World Cup in 2011. Much of the rest of the volatility can’t easily be pinned down, or adjusted for, at all. So mostly (but see below) people don’t pay much attention to this series. Using total movements data is made even harder by the fact that SNZ don’t publish a breakdown by citizenship (even though they have the data).
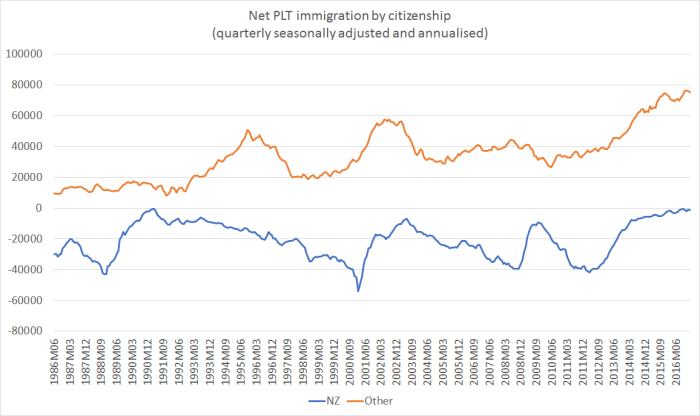
The permanent and long-term migration (PLT) data are a (largely successful) attempt to look through the noise, and provide a reasonable timely indicator of (changes in) the number of people coming and going fairly permanently. If you say on your arrival/departure card that you are intending to come (or be away) for more than 12 months you end up in the PLT category. This is what that data looks like (quarterly seasonally adjusted, and then annualised).

There are still big cycles in this series, but the short-term volatility is much less than in the net total arrivals chart above (and it would be even more obvious if the scale on the second chart was not much more compressed than that on the first chart).
What is more, SNZ publish this data by citizenship. That enables us to separate out movements of New Zealand citizens, (who don’t permission at all to come and go), Australian citizens (who do need permission, but have been given ex ante blanket permission) and all other citizens, who need specific approval from the New Zealand government to come and stay. I showed the chart of New Zealand and non-New Zealand citizens a week or so ago.
Both those series are also quite smooth. Usually, it takes only a few quarters to see if the trends in these series have been changing.
That can be really useful, at least in principle, for some purposes. If you are the Reserve Bank, trying to keep tabs on housing market pressures or overall pressure on resources, it is useful additional information. It is more important here than in many countries both because immigration flows are so large, but also because the scale of the cyclical variations – relative to the size of the economy – are larger than in most advanced countries.
It is also useful information if you want to comment on the behaviour of New Zealanders (coming and going), because it is all the data we have. New Zealanders don’t need permission to come and go (it is also the only data on Australian citizen movements, but the size of those flows, and the variation in them, is quite small).
But the PLT data aren’t ideal by any means – not even for the movements of New Zealanders. As we’ll see below, they probably pick turning points quite well, but for levels they can at times be quite seriously misleading.
And that isn’t because of ill-will or malice on anyone’s part. It simply reflects the fact the data rely on self-reported intentions. Sometimes people aren’t sure of their plans, but even when (probably mostly) they are, plans change. Plenty of New Zealanders head off to Australia, in particular, planning never to come back. But some won’t find a job, and others will just miss friends and family, and they’ll be back within 12 months. Others go, planning to be a way for only a few months, but they find they like it, a temporary turns more permanent, or perhaps they just fall in love. And if they ever come back, it will be an absence much longer than 12 months. And, even for New Zealanders, this all works in reverse: people come home, intending to stay, but actually…they miss the bright lights or whatever and are gone again a few months later.
Plans also change for non-citizens. After a few months, some find New Zealand isn’t all it seemed on the brochure, and some go home again. For others, they might have come for a few months, and then found opportunities for a work visa, or even eventually for residence.
You might think the differences/errors would be small, but often they aren’t. They probably don’t much affect the usefulness of a single quarter’s data, compared with that for the prevous quarter, and for macro forecasters that might be almost all that matters. But over very long periods, the differences can be massive (and unpredictable). Here is a chart showing the cumulative net arrivals for the last 20 years or so, from both the PLT data and the total migration data.
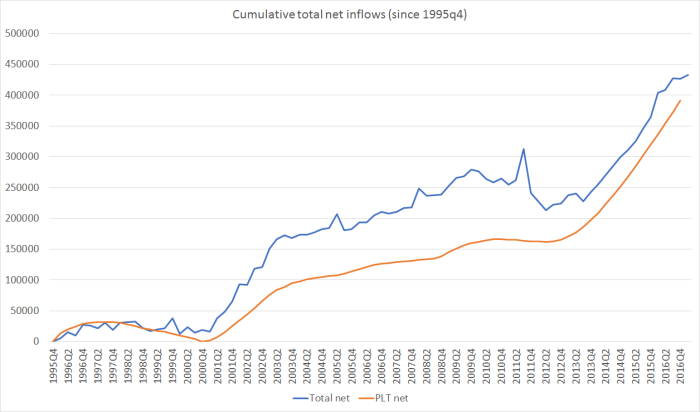
With this particular starting point, the cumulative gap isn’t that large at present. But at times it has been very large. (And the big differences at times aren’t just changes in the stock of tourists in New Zealand, or New Zealand tourists abroad.) Cumulatively, over this 20 year period we’ve a bit more actual permanent and long-term migration than the arrival and departure cards suggested. But in the last decade or so, it has been the other way round (as the gap between the two lines has materially closed). It isn’t easy to get a sense of how much of the differences are changes of plans by New Zealand citizens and how much by non-New Zealanders.
Statistics New Zealand recognise that the PLT numbers they publish – and which they themselves use in publishing quarterly population estimates for the periods between censuses – are no more than approximate indicators. Prompted by the Reserve Bank, a couple of years ago they published this note on work they had done on Alternative methods for measuring permanent and long-term migration.
Here is their opening chart, which highlights (in particular) the big gap between total migration (net passenger movements) and recorded PLT in the 2002 and 2003 period.

They identified three possible methods of working out (later) who actually was away for, or in New Zealand for, more than 12 months. Those methods produced impressively consistent results

As is clear in the chart, the actual PLT inflow over 2002 and 2003 was much larger than had been suggested by the reported intentions of travellers in the published PLT data (in fact, since New Zealand’s population was quite a bit smaller then, the net inflow as a share of population at peak was a bit larger than what we’ve seen – according to published data – in the last year or so.)
The limitation of these alternative methods is that they can be done only after a year has passed since the initial arrivals/departures happened. That is no small point, but it is hardly unique to immigration data. Our official GDP series are regularly revised for several years after the quarter to which they relate, as better annual data come available to Statistics New Zealand.
Unfortunately, Statistics New Zealand apparently has no money to update or report these better estimates on an ongoing basis. That seems quite extraordinary – although perhaps par for the course in underfunding important statistics in New Zealand – for data that plays such a significant role in economic monitoring and public debate in New Zealand.
The alternative methods don’t invalidate the use of the published PLT numbers for short-term cyclical analysis. Even though these are only annual charts, you can see that the turning points in the series are much the same as in the published PLT data. But if the absolute level of the net numbers can be out by so much – as SNZ themselves recognise in completing this analytical work – so, inevitably, will the absolute levels of the many of the derivative series drawn from the PLT numbers. Use the overall PLT numbers by all means for some short-term purposes (is the rate of population growth right now accelerating, slowing or holding roughly steady), but it is crucial to recognise the limitations of those data.
Perhaps the new Minister of Statistics could look at securing some budgetary funding for Statistics New Zealand, to enable them to move those alternative methods into becoming a regularly-published and updated part of the suite of official statistics?
But if you want to have an informed discussion about immigration policy – the choices by the New Zealand government as to how many non-citizens to allow to live and work here, under what terms and programmes – the PLT numbers really aren’t very useful at all. After all, the PLT data only capture visa types rather loosely, and many people change the visa they are on while onshore (including more than 70 per cent of those eventually granted New Zealand residence visas).
More importantly, we can use – what surely government officials advising ministers on immigration policy mostly use – direct administrative data generated by MBIE itself on the numbers and types of visas granted, and to whom they are granted. MBIE administer the immigration programmes, and grant the visas that are issued. They know exactly how many they have issued, and to whom. And they know when those visas are cancelled, and thus can tell you how many are outstanding. It is immeasurably superior data for discussions of immigration policy.
The problem is that although MBIE has this data, and presumably could update it every single day from its own systems, it is really quite hard for the public – and even analysts – to use it on a timely basis.
Once a year they publish Migration Trends and Outlook, chock-full of interesting charts and tables. And at the same time they provide accompanying detailed summary spreadsheets of the annual data both on the residence approvals programme – the centrepiece of our immigration policy – and on the numerous temporary visa programmes. Those tables are great.
But these publications are available only with quite a lag. Last year’s report, for the year to June 2016, came out in late November. Presumably the next issue is now at least six months away. For some purposes it isn’t a problem. For others, it is serious problem. Analysts cannnot simply go to the MBIE website (let alone the Statistics New Zealand website, where much of this should be accessible) and find easy to use summary data on a monthly or quarterly basis, seasonally adjusted where appropriate. Consider another set of administrative data. Building permits are also granted by government entities: Statistics New Zealand collect them from 70 or TLAs and make the data available, readily usable, by the end of the following month. Since only one agency issues visas, there is really no excuse for not having at least as good data (coverage and timeliness and accessibility) on immigration approvals.
MBIE do put out quite a lot of data on a monthly basis. But it is a series of enormous (eg half a million lines long) spreadsheets here. You could, if you wanted, produce your own summary tables, formatted along the lines of MBIE’s annual tables, on a monthly basis. You could, if had the technical capability, seasonally adjust the data yourself. But to do so is a major hassle for any ordinary analyst (public sector, media or whatever), the more so when one is used to statistical agencies providing accessible summary data, in usable formats and seasonally adjusted where appropriate. As I noted the other day, it took me an hour or so to generate 10 numbers on how many Essential Skills visas had been granted to nationals of various countries in the last year. By contrast, it took less than two minutes to download the comparable data for earlier years (from the MBIE summary tables).
It isn’t good enough. The outgoing head of MBIE, David Smol, and the Minister of Immigration should really make it a matter of priority to get this data out there, in readily usable form, on a high frequency and timely basis. It is inconceivable that it would cost much to do so, and by doing so they would help contribute to a much better informed debate on actual immigration policy. It isn’t as if, as in some countries, immigration policy is minor matter in New Zeland – like or not, even MBIE recognise that we have one of the largest per capita immigration programmes of any advanced country.
Now, it is true that for many of visa programmes, neither the numbers approved nor the make-up of those who receive approvals, change very much from year to year. Mostly, if you want to know about how many people, and what sort of people, we are approving, whether as residents, students, or the various classes of work visas, looking at the last annual numbers will give you a reasonable picture. There just isn’t that much noise in the series – and I commend the Migration Trends and Outlook tables to those, perhaps including those in political parties, wanting to offer deeper analysis or policy alternatives. But year old data simply isn’t good enough, when much more timely data are available internally – and could readily be formatted to be more widely usable by non-government analysts and commentators. Nature abhors a vacuum, and when it is so much easier simply to fall back on timely PLT data then, with all their limitations, too many people will do so. And the debate will be the poorer for that.
It can easily be done. For example, Education New Zealand gets the student visa data, apparently within a few days of the end of each month. They in turn transform that data into a fascinating monthly “dashboard” (an example is here). There is no reason why we couldn’t have official detailed tables, and a Hot off the Press from Statistics New Zealand, for these and the other visa categories. After all, immigration policy is (concretely) about how many visas we issue, to whom, and on what terms. When people want to talk about how many work visas have been issued, and to whom, they shouldn’t be going anywhere near the PLT data. They should turning automatically and instinctively to accessible data from the visa-granting agency.
And when people want to debate the medium-term contribution of immigration policy to New Zealand population growth, again they shouldn’t be going anywhere near the PLT data, but turning to the rich data MBIE has, going back a large number of years now, on the total numbers and the various possible breakdowns (age, nationality, sex, occupation, approval stream etc). These are people who will, in most cases, be future New Zealanders. By comparison, PLT arrivals data will shed almost no useful light at all.
(Sometimes, of course, like all statistics, if they can’t be used for actual illumination the PLT numbers can still be (mis)used for support).
Because you can’t easily get it from MBIE, here is the table I ran last week on one breakdown of residence approvals for the year ending March 2017 (with thanks to the reader with MS Access who did generated them).
| Residence Approvals: Year ended 31 March 2017 | ||
| Application Substream | Application Criteria | Number approved |
| Skilled Migrant | Skilled Migrant | 25,357 |
| Work to Residence | Talent – Accredited Employer | 1,464 |
| Investor Category | Investor 2 Category | 1,404 |
| Entrepreneur Category | Entrepreneur category | 740 |
| Work to Residence | Long Term Skill Shortage List Occupation | 527 |
| Investor Category | Investor 1 Category | 154 |
| Partnership Deferral Skilled | Skills/Business deferral | 142 |
| Work to Residence | Religious Worker | 122 |
| Work to Residence | Talent – Sports | 27 |
| Employee of businesses | Employees of businesses | 3 |
| Business / Skilled | Sub-total | 29,940 |
| Refugee | 1,902 | |
| Samoa Quota | 1,008 | |
| Pacific Access | 607 | |
| Other | Ministerial direction | 295 |
| Other | Victims of Domestic Violence | 28 |
| Section 61 | Section 61 | 133 |
| International / Humanitarian | Sub-total | 3,973 |
| Family Tier 1 & 2 | Family Parent Tier 1 | 2,555 |
| Parent | Family parent | 457 |
| Sibling | Family sibling | 397 |
| Adult Child | Family child adult | 47 |
| Sibling | Family sibling | 2 |
| Parent Sibling Adult Child Stream | Sub-total | 3,458 |
| Partnership | Partnership | 9,439 |
| Dependant Child | Family child dependent | 1,861 |
| Partnership | Partnership – Partner of an Expatriate | 1,247 |
| Parent Retirement | Parent Retirement | 37 |
| Partnership Deferral Family | Partnership deferral | 23 |
| Dependant Child | Family Child dependent – Dependants of an Expatriate | 11 |
| Partnership | Partnership | 3 |
| Uncapped Family Sponsored Stream | Sub-total | 12,621 |
And here is my own (time-consuming) table of the top 10 countries for people getting granted Essential Skills work visas, updated to include the year to March 2017.
| Essential skills visas granted, by country | |||
| 2006/07 | 2015/16 | 12mths to Mar 17 | |
| Philippines | 1695 | 5,408 | 6174 |
| India | 1943 | 4,812 | 4904 |
| UK | 4692 | 3,686 | 4086 |
| Fiji | 2145 | 1,973 | 1756 |
| China | 2749 | 1,823 | 1801 |
| South Africa | 2003 | 1,382 | 1807 |
| Ireland | 481 | 969 | 824 |
| Brazil | 1376 | 923 | 1066 |
| South Korea | 1145 | 828 | 767 |
| United States | 1493 | 820 | 837 |
| Total all countries | 31015 | 31766 | 32775 |
You should really be able to get those, and so much more, readily from MBIE. Sadly, you can’t.
As a result, the debate – whichever angle you find yourself inclining towards – is poorer than it could, and should, be.
UPDATE: I can also recommend Alex Tarrant’s amusing piece on some of the data issues.
