One can, and does, grizzle about the range and quality of New Zealand’s official statistics. But last Friday saw a small but welcome step forward.
On various occasions I’ve written about the limitations of the permanent and long-term migration data. Those data are based on the self-reported intentions of travellers at the time they cross the New Zealand border, and people can and do change their minds. That is as true of New Zealand citizens coming and going as it is non-citizens.
Prompted by the Reserve Bank, in late 2014 Statistics New Zealand published a paper containing some experimental work they had done trying to estimate the actual permanent and long-term movements (ie allowing for the ability of travellers to change their minds and their plans). That work confirmed that, while the broad patterns were similar, on occasions the differences between the published PLT figures and the results using the follow-up methods could be large. In the 2002/03 episode, the published PLT numbers materially understated the extent of the actual permanent and long-term inflow.

At the time Statistics New Zealand published that paper they indicated that they had no budgetary resources to update this work regularly, or make it part of the suite of official statistics. And so when I wrote a post a few weeks ago on which migration data to use for which purposes I noted
Use the overall PLT numbers by all means for some short-term purposes (is the rate of population growth right now accelerating, slowing or holding roughly steady), but it is crucial to recognise the limitations of those data.
Perhaps the new Minister of Statistics could look at securing some budgetary funding for Statistics New Zealand, to enable them to move those alternative methods into becoming a regularly-published and updated part of the suite of official statistics?
Little did I know that Statistics New Zealand had already found some funding. Because last Friday, they put out a press release (together with some background material) indicating that they have settled on a particular methodology, providing updated estimates using that methodology, and indicating that they will shortly commence regular updates of this data. That is good news. Anyone who wants details on the new “12/16 month rule”…
Any traveller with at least one border movement in a given month has their resident status reviewed. The combined information on the assumed resident status at the start of the month, the direction of the last movement in the month, and the 16-month follow-up travel history, determines the traveller’s final migrant status.
…can consult the SNZ background paper. As SNZ notes, the 12/16 method is also the one used by the Australian Bureau of Statistics.
There are several things to remember:
But what do the new statistics actually show? Here is SNZ’s summary chart

The orange line is the previously-published PLT numbers and the purple line is the new 12/16 series.
As highlighted previous, there is a very big difference between the two series in the 2002/03 period. But the pictures are also quite different around the 2008/09 recession. On the PLT numbers there was a big increase in net inflows in 2009, which then more than reversed over the following couple of years. But on the new 12/16 numbers, net permanent and long-term actual inflows had been pretty steady for several years (from 2004 to 2009), and then fell away very sharply over 2010 and 2011. Fortunately, in the last couple of years of the new data, the two lines are very similar but – since plans can change – there is no guarantee that will be consistently the case in the future. This is a genuine improvement in the provision of data on an ongoing basis, not just something to deal with a one-off anomaly in 2008/09.
Over this particular period, the net inflow over the full 14 years was a bit higher than the PLT numbers had suggested. That wasn’t a surprise – we already knew it from the experimental numbers a couple of years ago. But it is also important to stresss that the changes of plans can run either way; there is no a priori reason to suppose that one method will typically understate or overstate the actual net inflows.
Before showing you a few of my own charts, I wanted to reproduce one more of the SNZ charts
As I’ve noted repeatedly in recent months, the PLT data showing the visa type people held when they arrived in the country isn’t very enlightening for anything much at at all. The immigration system is set up in a way that encourages many people to change their visa type once they are here (eg most people who get residence visas do so while already living here, many people move from a student visa to a work visa while here). That is why I urge people to focus on the MBIE approvals data if you want to understand immigration policy decisions etc. And this chart from the new SNZ paper really just reinforces the point.

There are huge differences in all four categories between what the PLT numbers showed, and the new 12/16 method numbers. For most purposes, both are less useful than the MBIE approvals data.
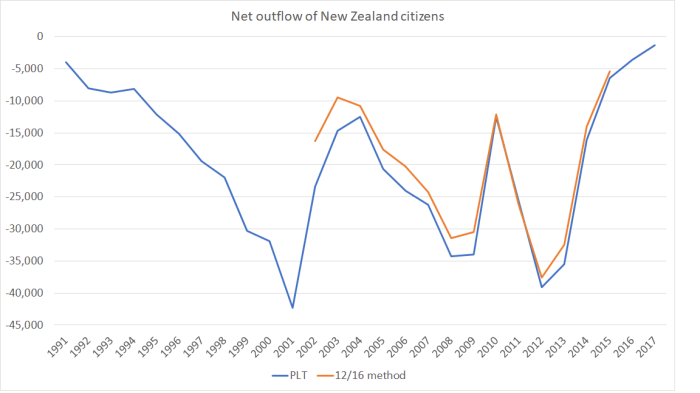
One area where the new 12/16 data are a real boon is around the permanent and long-term movements of New Zealanders. New Zealanders don’t need permission to come or go, so (at least between censuses) we are totally reliant on the migration statistics for an accurate sense of the net flow of New Zealanders. The PLT data have recorded a huge net outflow of New Zealanders (and actual outflows every year since 1962/63). My hunch has been that the PLT numbers overstated the outflow (and that, net, some people who went intending to stay away long-term came back quite quickly). The new 12/16 data are available by citizenship (although not yet in a terribly user-friendly format). Here is the chart showing the two methods, on a March year basis.

In no individual year have the differences been very large. That is reassuring for short-term analysis, but over the full 14 years for which SNZ have provided the new data, those moderate annual differences add up. On the PLT data, a net 341000 New Zealand citizens left between January 2001 and March 2015. On the 12/16 rule data, 300000 left. Both are large numbers, but the actual outflow of New Zealanders appears to have been around 10 per cent less than the PLT numbers had suggested. That is a big part of the reason why the overall net inflows to New Zealand have been a bit larger than the PLT numbers had suggested.
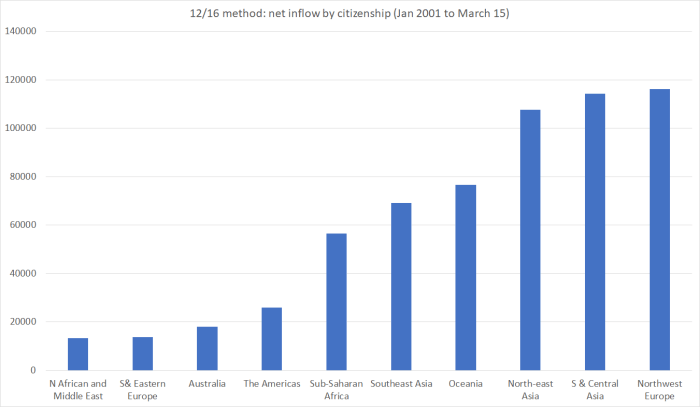
For other citizenships, SNZ has only provided the data at an aggregated level. But here is the chart showing the net inflows, on the 12/16 method, for various groups of citizenships for the full period the new data are available for.

As I’ve stressed previously, if you want to look at immigration policy choices, look at the MBIE approvals data. But these data, even if not very timely, do have the advantage of capturing not just those who got approval and came, but also those who left again.
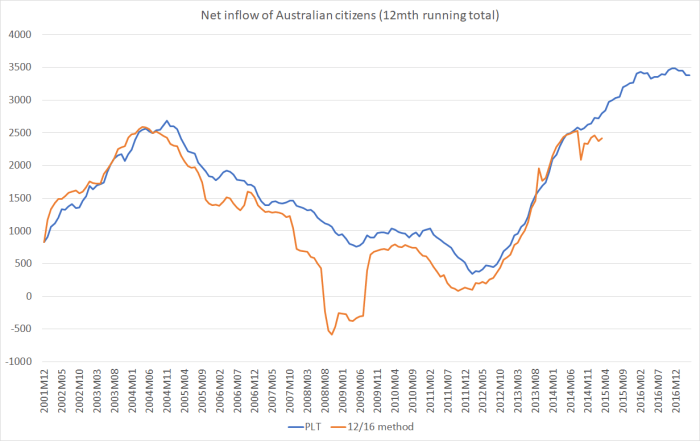
Australian citizens don’t need advance approval to come. The numbers who do come are pretty small, but out of interest here is the net flow of Australian citizens, both on a PLT basis and on the new 12/16 method.

The divergence between the two series over 2008/09 looks like a possible example of a case where both lines tell us something interesting. Although the net inflow of Australian citizens had been falling, it was still positive (on the PLT numbers). But in 2008/09, the New Zealand economy went into an unexpected recession and the unemployment rate rose quite sharply. Presumably, a large proportion than usual of the Australians who came here changed their minds fairly quickly and went home again.
And one last chart from the new data. One of the stories around the divergence between the PLT numbers and the other methods in 2002/03 had been that much of it reflected Chinese (in particular) language students, who ended up staying for longer than they had indicated on their initial arrival card. This chart, of net arrivals from north-east Asian countries (the SNZ grouping) seems consistent with that.

There was a huge surge, on this better method, in 2002/03, significantly balanced out by net outflows of north-east Asian citizens several years later. Actual residence approvals granted to people from these countries were much steadier throughout the period (for Chinese, the number of residence approvals fluctuated between 4800 and 8000 per annum).
To be boringly repetitive, if you want to talk about immigration policy, it really is best to look at the MBIE approvals data. If only they would make them readily available, in user-friendly form, every month it would be lot easier to encourage people to consistently do so.
Well done to Statistics New Zealand for publishing this new data. It will help shed more light on the activities of New Zealanders (and the typically small flow of Australians), and enable us to see better – albeit with a bit of a lag – how the overall movement of people in and out of New Zealand has been contributing to the population change. For some purposes, the PLT data themselves remain useful, but it is always important to remember that they are only an estimate of what is really going on.