How sacrosanct should inflation targeting be?

On Donal Curtin’s blog the other day I noticed a reference to a recent paper published in New Zealand Economic Papers (unusually it appears to be accessible to non-subscribers) that looked at, among other things, whether inflation targeting had reduced the variability of long-term interest rates in New Zealand and Australia.   They conclude that it has.  Donal uses the results to encourage politicians to stay clear of any changes to monetary policy.

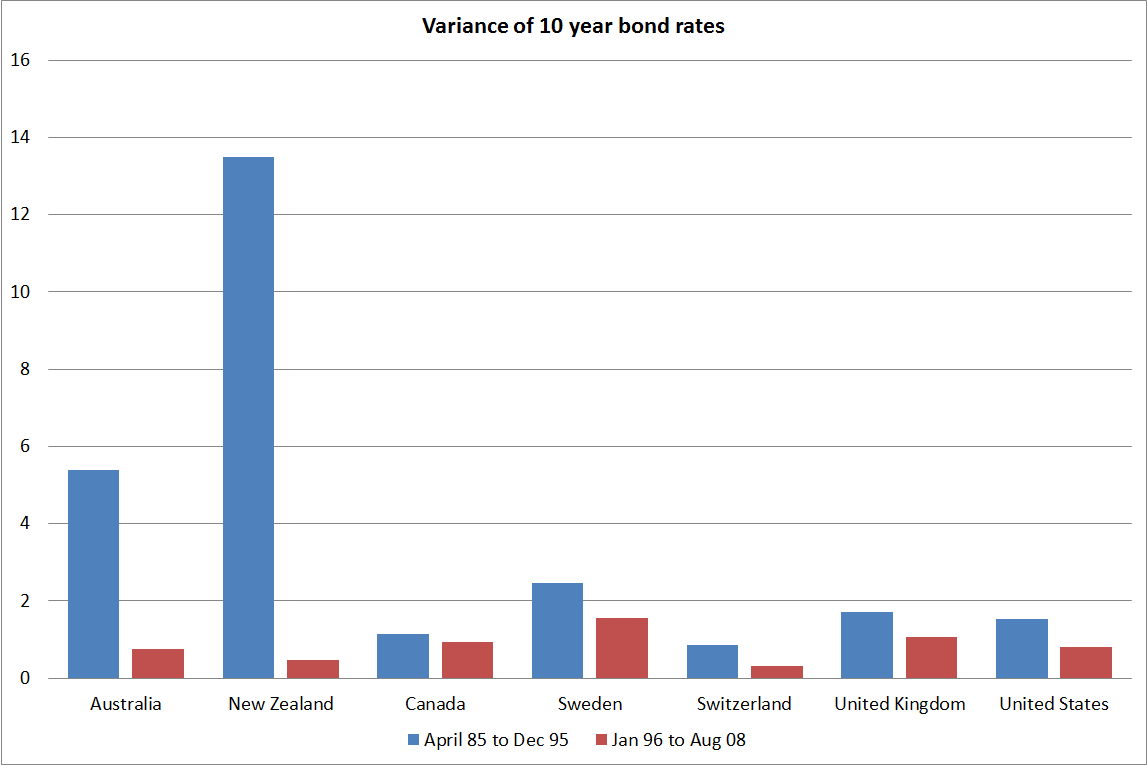
There is no doubt that long-term interest rates in New Zealand (and Australia) are much less variable than they were in the early days of liberalisation.  There was an awful lot going on back then.   The authors present the data for two sub-periods, April 1985 to December 1995 (which commences shortly after New Zealand interest rates were liberalised), and January 1996 to August 2008 (a period which ends just prior to the worst of the crisis, and the prevalence of near-zero short-term interest rates in many countries). For the countries they report, here are the data:

variance

In the late 1980s, inflation in Australia and New Zealand was also much higher than in the other countries. Australia’s inflation rate averaged around 8 per cent, and New Zealand’s 10 per cent, while the US had an inflation rate of around 4 per cent.  Sweden’s inflation rate was also still on the high side.

There is little doubt that getting inflation under control (lower and less variable) was part of what helped markedly reduce the variability in nominal interest rates. It did that in all these countries. But how much of that is down to “inflation targeting” per se? I’d suggest very little. After all, as early as 1990q3, just a few months after the first PTA was signed, New Zealand’s annual CPI inflation rate was already the second lowest among the countries these authors look at.   In the UK case, the central bank didn’t even have operational independence until mid-1997, and in the United States anything closely resembling inflation targeting really only dates to the last few years.

I don’t want to get into a debate here as to whether inflation targeting is the best option for advanced economies these days, but to get a better sense of the contribution of inflation targeting we’d really need a country (preferably several) to change their regime. A decade with several countries running NGDP targets, or wage inflation targets, or even price levels targets, in parallel with others still running inflation targets might shed rather more light on the issue. For New Zealand, as I’ve argued elsewhere, inflation targeting was a specific form of articulating a commitment to more stable macro conditions than we’d had previously. It may have provided more discipline (on the Reserve Bank) than operating without an explicit target, but even there one could be reasonably sceptical. Most other advanced countries had already got inflation a long way down –  as had we (see above) before they got very serious about anything like inflation targeting.

There is a variety of good reasons for encouraging Opposition parties not to tamper too much with the essence of the monetary policy targeting framework (and perhaps to focus their energies instead on reforming the Reserve Bank, including its governance framework). Whatever is wrong with New Zealand’s economic performance over the long-term has little or nothing to do with the details of the monetary policy arrangements. But I wouldn’t take much from this NZEP paper on that score. It won’t, for example, shed any light on whether the Labour Party’s proposed restatement of the goal would make things better or worse, or just make no difference.

Here is how Labour last year proposed to amend section 8 of the Reserve Bank Act. The new section would read.

“The primary function of the Bank with respect to monetary policy is to enhance New Zealand’s economic welfare through maintaining stability in the general level of prices in a manner which best assists in achieving a positive external balance over the economic cycle, thereby having the most favourable impact on the stability of economic growth and the level of employment.”

It was clever piece of drafting.  I argued at the time, and still believe, that it would have made no material difference to the conduct of monetary policy. The inclusion of similar sorts of words in the Policy Targets Agreement in 1996 didn’t (but it allowed Winston Peters to tell the world that he had secured changes). I was never sure whether Labour recognised, or not, that the change would make little or no difference. I think their people were smart enough to know, but also to know that, in political positioning product differentiation and branding matter.

Of course, other possible changes might make more difference. Some might (conceivably) be for the better. There is certainly no reason to suppose that inflation targeting will prove to be the last word in how best to conduct monetary policy.

House of cards?

The Reserve Bank announced last month its decision to require banks to classify all loans secured on residential investment properties separately from other residential mortgage loans. This applies not just to large commercial operators, but to borrowers with just a handful of investment properties. The Reserve Bank will now require banks to use higher risk weights (ie have more capital) in respect of the former than in respect of the latter.

This has been quite a saga. The Bank went through a couple of rounds of consultation on earlier proposals last year (then focused on larger operators), and then came back earlier this year with a revised proposal. I made a brief submission on that consultative document, as no doubt did a variety of other people (although we don’t know who, as the Reserve Bank – unlike parliamentary select committees – does not routinely publish the submissions it received). The Reserve Bank’s summary response to the submissions can be found half way down the page here (various specific links on the RB website don’t appear to be working today),

The proposal that the Reserve Bank consulted on in March/April, and which it recently adopted, had a strong feel of being reverse-engineered. The Governor had apparently decided that he wanted to be able to impose additional direct controls on lending for residential property investment, and to do that he needed banks to have systems in place which would clearly delineate between investment property loans and owner-occupied loans. To support that prior policy conclusion, the Bank has sought to argue that loans on residential investment property are, all else equal, riskier than other residential mortgage loans.   To be clear, the Reserve Bank is asserting that a loan is riskier because it is secured on an investment property, even if the initial LVR, the initial date at which the loan was taken out, the nature of the house itself, the borrowers’ income etc were all exactly the same as those for an owner-occupied loan.

What has always been a bit surprising is how little in-depth effort the Bank has put into demonstrating that its argument is correct. It has run a variety of arguments in principle about why investment property loans might be riskier than those to owner-occupiers. Most of those have never seemed overly compelling, especially not in a New Zealand context.   Indeed, there are some reasons why the result could be reversed (for example, unemployment is probably the largest single risk, all else equal, in respect of an owner-occupier mortgage, but rental income flows – which help service investment property loans – tend to be less discontinuous).

But the issue should ultimately, be an empirical one. All else equal, have investor property loans proved to be riskier than owner-occupier loans? Getting good comparable data isn’t always easy.  Material loan losses tend to arise only when nominal house prices fall, and although real house prices fell sharply in the late 1970s, large nationwide falls in nominal house prices haven’t happened in New Zealand since the 1930s. Data from that period aren’t available – although perhaps it is an opportunity for an economic history PhD project working in bank archives. But even more recently, nominal house prices have fallen materially in a number of regions, and I have encouraged the Bank to ask banks for data on the loan loss experience (investor vs owner-occupier) in places like Gisborne, Wanganui, or Invercargill.

In fact, the Bank has tended to rely on a handful of overseas studies, about a handful of overseas experiences. This isn’t one of those areas where there are dozens of studies about dozens of episodes. That makes it all the more important that what studies exist are read carefully and applied and interpreted to New Zealand very carefully. That appears not to have been done. Worse, even when some weaknesses in the way the Bank interpreted and applied such papers were pointed out to them (in submissions on the consultative document), they largely just repeated their assertions and interpretations.

I’ve worked my way through some of the papers, and had had concerns about how the Bank had interpreted and applied the results. My former colleague, Ian Harrison, who consults as Tailrisk Economics, and is much more expert in the specialist risk aspects than I am, has worked his way carefully through each of the empirical papers the Bank has cited, and several that they should have cited, but did not. He has sent me a forthcoming paper “A House of Cards”, in which he has worked his way carefully through each of the Bank’s arguments and pieces of evidence. Cumulatively, it is a pretty damning read. Ian has given me permission to run some excerpts here, and I hope that when his paper is published it will get the attention it deserves.

On the international experience, Ian summarises as follows:

The international literature does not provide support  for the Bank’s contention that investor loans are riskier and owner-occupier loans. Four of the four studies that controlled for other loan attributes found that investor status had no impact, or only a trivial impact, on default rates. A European Banking Authority survey of 41 advanced modelling banks found that none identified investor status as a risk driver in their retail housing mortgage lending models.

A good example of what appears to have gone on is how the Bank has represented an important paper on the Irish experience

Lydon and McCarthy 2011 “What lies beneath? Understanding recent trends in Irish Mortgage arrears”

The graph presented in paragraph 11 of the March 2015 Consultation document presents data from the Lydon and McCarthy paper, which addressed the question of whether BTL [buy to let] status was, in itself, a default driver, or whether the higher default experience could be explained by differences in other loan characteristics.

It was found that after controlling for differences in LVR and servicing costs, BTL status had no impact on default rates.  The higher increase in observed BTL default rates was due to the fact that a larger share of BTL loans were made in the lead up to the GFC when underwriting standards were at their lowest point and house prices at a peak.

Naturally subsequent default rates were higher for investors who bought at the wrong time and who offered scant protection to the lender, but default rates would also have been higher than average for owner occupiers with the same characteristics.

The results of their analysis are presented in table 7 of the paper which shows that the coefficient  for the marginal impact of BTL status is 0.00.  This estimate is significant at the 1% level.

In a subsequent presentation (“The Irish Mortgage market in Context – Central Bank of Ireland 2011) the authors said:

“Controlling for LTV & MRTI…

–Relative to next-time-buyers (NTB), FTB borrowers are 2% less likely to be in arrears

–whereas, no relative difference for BTL”(our emphasis)

The data presented in the Consultation document does not provide evidence that Irish BTL loans are a riskier asset class. It is misleading to represent the paper, as the Bank does in several documents, that it provides evidence that BTL loans are riskier.’

Or, in respect of a US study:

Palmer C. (2014) ‘Why do so many subprime borrowers default during the crisis: Loose credit or plummeting prices’

The Bank made the following statement:

“Palmer (2014) reports that default rates increased in a multivariate regression with loan to value ratio and for loans that were declared non-owner occupiers.”

In his paper Palmer uses comprehensive loan-level data to decompose sub-prime loan loss defaults amongst three default drivers. His conclusion is as follows.

“Decomposing the observed deterioration in subprime loan performance, I find that the differential impact of the price cycle on later cohorts explains 60% of the rapid rise in default rates across subprime borrower cohorts. Loan characteristics, especially whether the mortgage had an interest-only period or was not fully amortizing, are important as well and explain 30% of the observed default rate differences across cohorts. Changing borrower characteristics, on the other hand, had little detectable effect on cohort outcomes. While quite predictive of individual default, borrower characteristics simply did not change enough across cohorts to explain the increase in defaults.”

There is no marker for investment property as such in the study, just a marker for whether the dwelling was  to be owner occupied or not. It is not clear whether holiday or other second homes would fall. Regardless, the non-occupier marker fell into the borrower characteristic category, which in total provided little independent explanation of deliquency. There was no result that investor status increased defaults. The Bank’s statement was false.

I suggest that you read the entire document when it is available. As far as I can tell, none of the studies the Bank cites appears to have been fairly represented, or applied to New Zealand.

If Ian’s reading of the papers is accurate (and I have no reason to doubt it) it is a very disconcerting commentary on the processes in the Reserve Bank.   The Bank has plenty of able people, who would have been well able to pick up on each of the weaknesses Ian Harrison has identified.  And yet not just once, but again in the response to submissions, and in the new consultative documents, after the Bank had had time to consider the criticisms that submitters have made, the studies have continued to be explained or applied in ways that are, at best, misleading.

Reasonable people can reach different views on appropriate policy measures. I think the Governor of the Reserve Bank has far too much power in this area, and I disagree with the proposed restrictions.   But if citizens cannot trust the Bank to cite evidence in a balanced and accurate way, confidence in the entire policymaking process is likely to be severely eroded.

As I have noted, in such areas the Governor is effectively prosecutor, judge, and jury in his own case. Worse, he is also responsible for the investigative work that is presented in support of the case that he will himself decide. Of course, he has staff to do the work for him, but the staff (and their managers) are hired, rewarded, and potentially fired, by the Governor. A strong Governor will want to know the weakest points in his own case, and to ensure that those weaknesses are appropriately aired, balanced presumably by other strong evidence or arguments for the sorts of regulatory initiatives he is proposing. But the Wheeler Reserve Bank appears to be one in which either no one is willing to stand up and point out the weaknesses or, if someone did point them out, where the Governor and his senior managers said, in effect, “oh just ignore that, continue to repeat the same lines”. One would hope there is a better explanation, but it isn’t obvious. The Bank’s Deputy Governor, Grant Spencer, for example, has spent decades in senior roles in the Bank, and many thought he was a strong candidate to become Governor in 2012. He has direct line responsibility for the two departments dealing with these banking regulatory issues. How did he let documents this weak go out, not just once, but repeatedly? Anyone can make a mistake citing a single paper, but the breadth and repeated nature of what Ian highlights has the feel of something more deliberate.

Even if the Bank could show, with some degree of confidence, that investor property loans were riskier than those to owner-occupiers, other characteristics held equal, the case for the proposed ban on lending in excess of a 70 per cent LVR for residential investment properties in Auckland has serious weaknesses. I elaborated on those in my recent submission (and have also requested copies of all the submissions the Bank has received).

I’ve been critical of the Governor’s conduct of monetary policy over the last couple of years. But reasonable people will, at times, reach quite different views on what monetary policy stance is required. His turned out to be wrong although, as I noted this morning, he had plenty of company for too long.   But repeated misrepresentation of data to support a controversial regulatory initiative strikes me as much more serious. It might do less damage to the economy, but it strikes at the heart of the integrity of the institution, and raises serious questions about the extent to which the public can have confidence in the (unelected) Governor’s ability and willingness to carry out his statutory duties in the public interest, in an objective and dispassionate manner. Cynics might expect such standards from politicians. We certainly shouldn’t tolerate them from officials.

I hope that when Ian Harrison’s full paper is published, the Bank’s Board will start asking some pretty searching questions.  The Board is charged to, inter alia,

    • keep under constant review the performance of the Bank in carrying out—
      • (i) its primary function; and
      • (ii) its functions relating to promoting the maintenance of a sound and efficient financial system; and
      • (iii) its other functions under this Act or any other enactment:
    • (b) keep under constant review the performance of the Governor in discharging the responsibilities of that office:

Perhaps the Minister of Finance might refer the issue to Rod Carr, chair of the Board, for his views.
The Shadow Board on tomorrow’s OCR

The NZIER this morning released the results of its Shadow Board exercise. They survey nine people (currently three market economists, three business people, and three with academic affiliations) and ask them to assign probabilities for the “most appropriate level of the OCR for the economy”. In principle, I suppose “the most appropriate level for the economy” could be different from “the most appropriate level to be consistent with the requirements of the Policy Targets Agreement”, although I suspect that respondents will typically be treating the two as the same. Note that, in principle, the information in the Shadow Board responses is different from the information in financial market prices (which are close to a direct view on what the Reserve Bank will do – as distinct from what people think it should do) or from ipredict, which runs direct contracts allowing people to bet anonymously on what they think the Reserve Bank will do. When I looked just now, the prices reflected an 84 per cent chance of a 25 basis point cut tomorrow

Launching the Shadow Board was a modest but useful initiative by NZIER. It helps spark a little more debate, and a little more scrutiny, about what the Reserve Bank is doing, and puts the results in a useable (and reportable) format. It was inspired by a similar exercise in Australia (which is slightly more (too?) ambitious in that it also asks respondents for probabilities for the right rate six and twelve months ahead).

But what the Shadow Board doesn’t really do is provide any additional information on what the Reserve Bank should do. As everyone recognises, there is a great deal of uncertainty around monetary policy. Central banks talk of trying to target inflation a couple of years out, and yet have no great certainty even as to what is going on right now, let alone what will be going on 12-18 months hence.

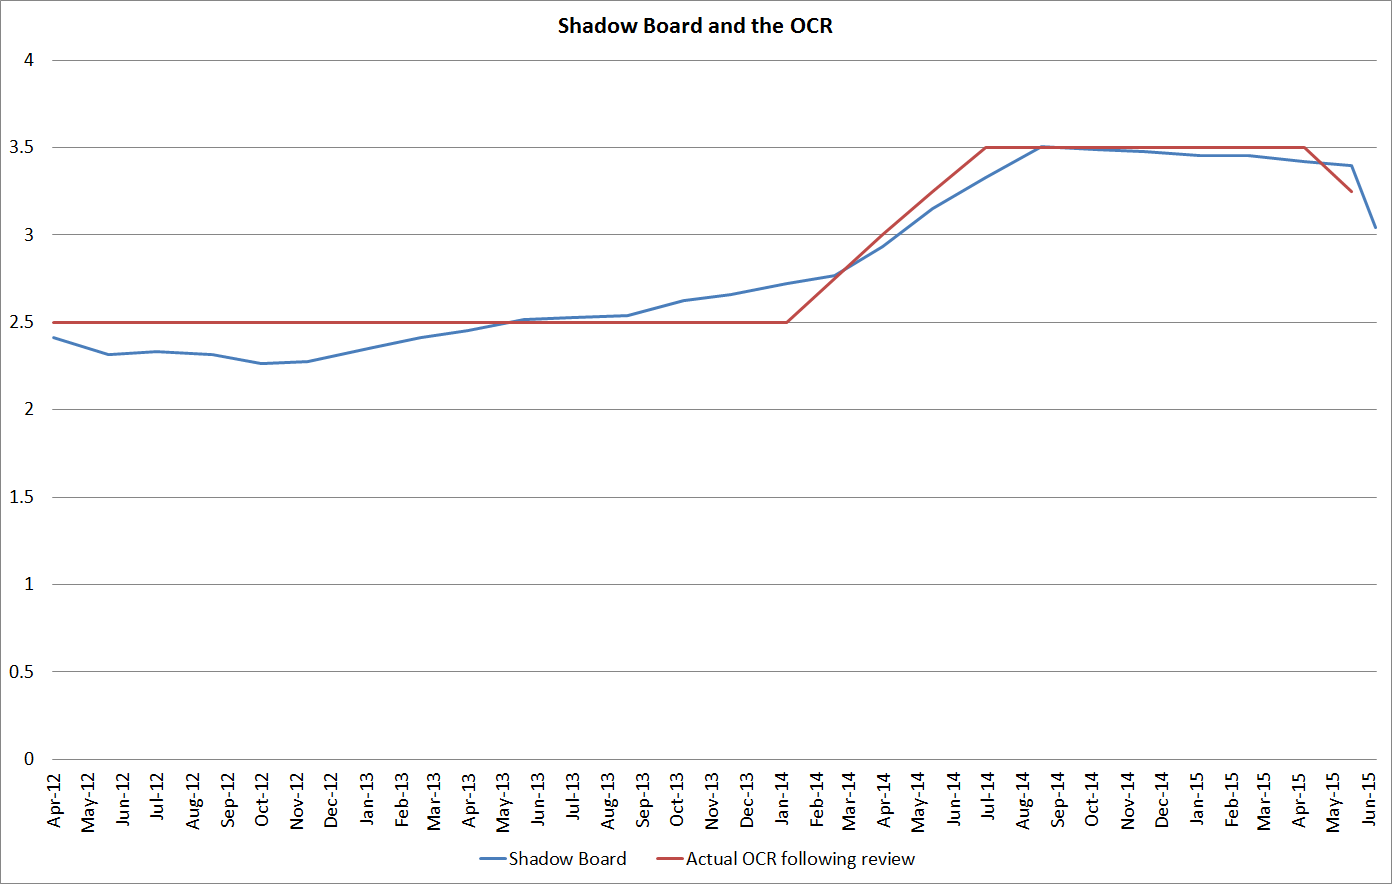
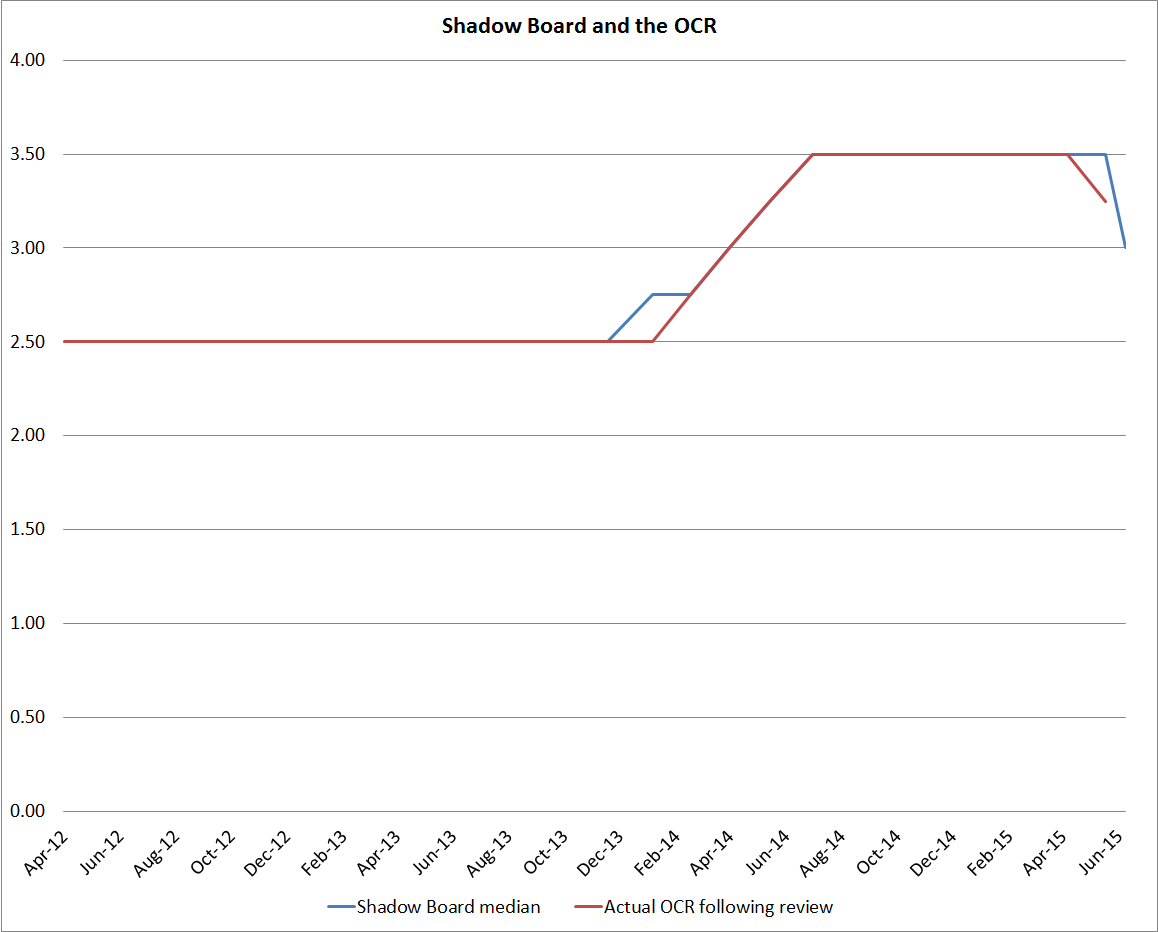
Here is a chart showing the actual OCR following the relevant review and the median view of the Shadow Board (thanks to Kirdan Lees at NZIER for sending me the historical data).

shadow board 1

They are all but identical, at least over this relatively short period. And yet the Reserve Bank has subsequently acknowledged that, with the benefit of hindsight they would have had the OCR lower in 2011 and 2012.   And most observers would now agree that the OCR did not need to have been as high as it was over the last year.

Perhaps the information is in the distribution of probabilities rather than in the median view?  Here is the mean of the views of the Shadow Board members. It does deviate a little from the actual OCR, and perhaps during last year the Shadow Board’s views were a little more cautious than the Reserve Bank was. The Shadow Board’s mean view was a little below the actual OCR, while the Reserve Bank itself was still stressing upside risks and the probable need for further rate increases.

shadow board 2

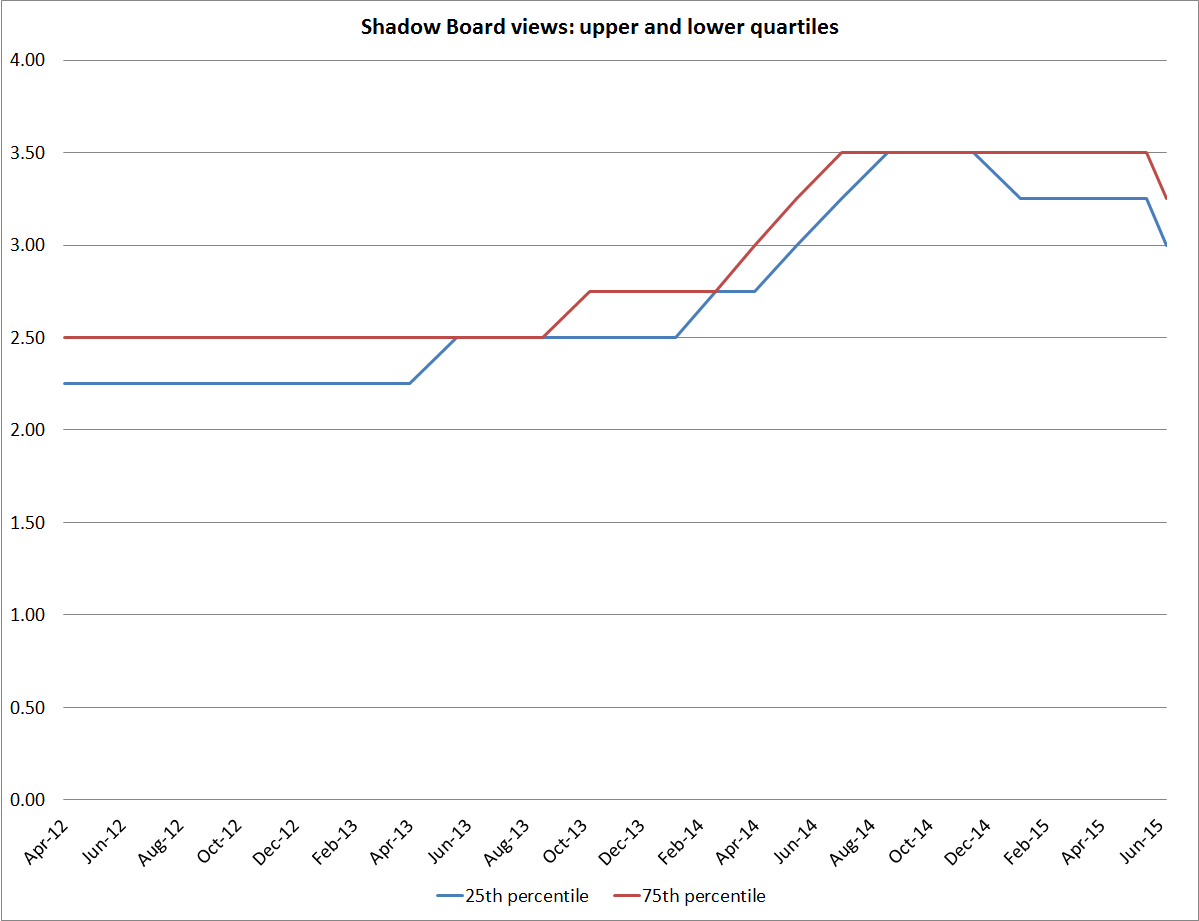
And here are the 25th and 75th percentiles. Respondents collectively put at least a 25 per cent chance on something at or below the 25th percentile being appropriate, and at least a 25 per cent chance on something at or above the 75th percentile.

shadow board 3

It is striking just how tight these ranges are. I noted back in June that most individual respondents’ views seemed excessively tightly bunched, given the huge historical uncertainty about the appropriate OCR. This time around there is a little more dispersion. The Shadow Board exercise has now been running for 27 reviews, and this is one of only three in which respondents collectively put a less than 50 per cent weight on one particular OCR (the other two were January last year, when the Reserve Bank was just about to commence raising the OCR, July last year which proved to be the last of the OCR increases).  I doubt, if I’d been assigning my own probabilities, if I would ever have put even a 40 per cent weight on any particular OCR in any particular review.

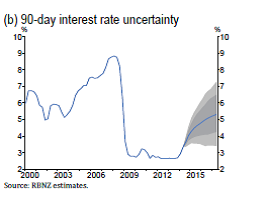
One other way of looking at the scale of the uncertainty around the OCR is the fan charts that the Reserve Bank published in the June MPS last year.  These were somewhat controversial, and are hedged around with lots of caveats in the technical notes, but the Governor presumably regarded them as a sufficiently useful device to run prominently in the main policy analysis chapter of a Monetary Policy Statement.   On the subset of shocks and uncertainties considered in that exercise, the 90 per cent confidence interval for the 90 day rate (proxy for the OCR) two years ahead was some 400 points wide. Perhaps a little embarrassingly for the Bank, that range did not even encompass an OCR of 3 per cent or less by July 2015.

fan chart

What do I take from all this?   I’d probably make only two points:

  • There is a huge amount of uncertainty in running discretionary monetary policy.  Some would argue that it is a mug’s game and only likely to introduce additional volatility.  That isn’t my view, but the uncertainty (across a range of different dimensions) is large enough that in general everyone should be a little cautious in taking a stand on a particular OCR (of course, under the current regime, the Reserve Bank must take a view, in actually setting the OCR). Mistakes won’t be uncommon –  whether by commentators or central banks – and that should be recognised, with appropriate humility, by all involved.  Of course, Reserve Bank mistakes matter more because they are charged with the power to take decisions that affects all of us in one way or another.
  • That very uncertainty highlights just how important it is that there is robust debate around a range of perspectives.  In this post, I haven’t looked at the diversity in the individual respondents’ views (partly because the panel of respondents has kept changing, and the sample is quite short), but looking through that data there hasn’t been much diversity of view across respondents either (with the creditable exception earlier in the period of Shamubeel Eaqub).    It is very easy for consensus views to form – both within the Reserve Bank – and in the wider New Zealand debate more generally.  And yet those consensus views will often be wrong.  Sometimes those looking at New Zealand from the outside have had a better take on things, but I doubt that has been consistently true (in the last year, HSBC in Sydney has been running the “rockstar economy” story, while other offshore players were rather more sceptical of the Reserve Bank’s continuing tightening cycle).  Encouraging that diversity of perspective is particularly important within the Reserve Bank, and yet it can be hard to maintain.  That is probably true in all central banks, but is a particular risk in our system, in which the Bank’s chief executive controls resources and rewards and is also single monetary policy decision-maker.  A very good single decision-maker would probably want as much debate and challenge as possible, recognising just how uncertain the game is.  A less-good one would find it too easy to discourage debate and challenge –  while never explicitly saying so, or perhaps even meaning to – preferring material that supports the decision-maker’s own priors and predilections.

David Parker and non-resident housing demand

David Parker has an interesting piece in the Herald, on how the various free trade agreements New Zealand governments have signed affect the ability of New Zealand to restrict non-resident purchases, should it wish to do so.  The heart of his argument is here:

The most favoured nation provision in article 139 does apply to existing investments and controls on new investments. If we want to further restrict the sale of farmland or houses to Chinese investors, we can. Article 139 simply requires NZ to treat China no less favourably than other countries. Clause 3 of article 139 means earlier agreements with our Australian and Pacific Island neighbours are not affected, and do not flow into the China FTA. Later agreements do flow through.

National does not believe there should be more restrictions on foreign buyers, and so the South Korean FTA does not contain the protections found in the China FTA. This creates risks if New Zealand moves to restrict or ban South Korean investment in residential property. Screening or bans are allowed for existing categories but not new categories, that is farms but not houses.

Article 139 of the China FTA means NZ can’t properly ban sales to Chinese investors but allow them to South Korean investors. Even the South Korean FTA does not limit the sovereignty of a future New Zealand government to restrict house sales to foreigners, but it does create a risk of South Korean claims.

If Parker’s reading is correct, it does appear to leave some options open. According to the MFAT website, the New Zealand-Korea FTA has not yet been ratified, and so is not yet in force.

Rodney Jones proposed a 20 per cent stamp duty on non-resident purchases in Auckland. Such restrictions or taxes are not a first-best solution. Particularly if the non-resident demand from China is likely to persist over the medium to long term, it would be much better to liberalise land-use restrictions and make it much easier to supply new houses and apartments. It is an export industry.  (But if the demand was likely to prove pretty short-term in nature, it might actually be preferable to simply absorb excess demand in temporarily higher house prices.)

But I don’t see any sign of wide-ranging liberalisation of land-use restrictions in the next few years. As I’ve noted previously, I’m not aware of other countries or major cities that have had tight supply restrictions and materially and sustainably liberalised them. Surely it must come some day, but regulation once established tends to linger for a long time. Import controls, from New Zealand’s history, were another good example.

I don’t think there is any obvious welfare gain for New Zealand in allowing extensive non-resident purchases of houses/apartments if governments also make it hard to bring new urban land to market and utilise it intensively in response to changes in demand. There is none of the technology transfer that might be associated with FDI. There is simply a redistribution – windfall gains to those who happen to own property in Auckland before the demand picked up, and windfall losses to those who would have wanted to purchase in the future. And the gain is simply the result of government-imposed and maintained supply restrictions. In that climate, I see no major problem in principle with some sort of restrictions.

And yet, I remain a little uneasy. In terms of accommodation itself – surely more important than home ownership – it is purchases of houses that are then left vacant that have the stronger adverse effects. Houses that are bought and put back on the rental market maintain the supply of accommodation. And yet we have no data on how important this “left vacant” component might be, and I don’t think the new post-October information requirements will provide any data on this split. Given that demand for house-buying seems relatively price-inelastic, even if the “left vacant” component is itself quite small, as a marginal boost to demand it could still be having quite an impact on price.

Perhaps this is where advocates of the Australian rule (“you can buy, but only a new build”) come in. The Australian rule doesn’t seem to have been very effective, but perhaps a similar one could be much more effectively policed if the authorities were serious about doing so? Perhaps it really is the minimally distortive approach if there is to be new regulation at all? The caveat to that proposition is that if the offshore demand were to prove short-lived we could be left with a nasty over-supply of the sort of housing not overly popular with most New Zealanders. An ample supply of (cheap) apartments sounds good, but real resources will have been diverted into building the properties, skewing the rest of the economy. Real resource misallocation tends to be more costly than changes in asset prices in isolation.  Perhaps that should be less of a concern starting from current house/land prices than in other circumstances?

I’m usually reasonably settled in my views as to appropriate policy responses. For now, on this issue, I’m not. Waiting for October’s data is a convenient line, but I suspect it is a bit of a cop-out. I am left rather closer to Rodney’s 20 per cent stamp duty than I was previously.

Fiscal and monetary policy interactions: some New Zealand history

The role of fiscal policy has been much-debated in recent years. I think the consensus view now is that discretionary adjustments to fiscal policy make little difference to GDP in normal times, because monetary policy typically acts to offset any demand effects. By contrast, if interest rates can’t go any lower (or central banks for whatever reason are reluctant to take them lower) then discretionary fiscal policy adjustments can have quite material impacts on near-term GDP behaviour.

These debates focus on demand effects. If the government spends less, without changing tax policy, spending across the economy as a whole is likely to be dampened to some extent, all else equal. But there are also stories about confidence effects. If the overall economic and fiscal situation is sufficiently fragile, then in principle tough and credible new fiscal initiatives could lift confidence sufficiently that the confidence effects overwhelm the demand effects.  This was the vaunted “expansionary fiscal contraction”. I’m not sure I could point to any examples in advanced countries, but others read the evidence and case studies a little differently. I’m not wanting to buy into debates about Greece here – but “credible” was perhaps the operative word in the previous sentence.

Before 2008, there was a variety of historical episodes that people often turned to when looking at the effects of fiscal contractions.  The UK experience in the early 1980s and the Canadian experience in the mid-1990s got a lot of attention.  I think the best read on the Canadian episode (with more extensive treatment here) was that substantial fiscal contraction did not have adverse effects on the Canadian economy because interest rates fell sharply,the Canadian exchange rate fell in response, and the United States – Canada’s largest trading partner – was growing strongly.

And then there was New Zealand’s experience around 1990/91. After several years of significant fiscal consolidation (which had been sufficient to generate material primary surpluses), new fiscal imbalances had become apparent by late 1990. In a major package of measures in December 1990, and in the 1991 Budget, substantial cuts to government spending were made. In combination with the earlier efforts (which were probably more important), these cuts helped lay the foundation for the subsequent decade or more of surpluses.

Former director of the Business Roundtable, the late Roger Kerr, was prone to argue that it was an example of an expansionary fiscal contraction. I’ve repeatedly argued that it wasn’t. Certainly, the recession troughed at much the same time as the 1991 Budget and the subsequent recovery was pretty strong. And, as Kerr noted, the academic economists who publicly argued that the fiscal contraction could only depress the economy further and would prove largely self-defeating ended up looking a little silly.     But the recovery had much more to do with the very substantial fall in real interest rates – as inflation was finally beaten – a substantial fall in the exchange rate, and with the recoveries in other advanced economies than with any confidence effects resulting from the tough fiscal policy measures.   By mid-1991, the new National government’s political position was so fragile that no one could have any great confidence that the fiscal stringency that was announced would be sustained (and, indeed, several of the higher profile measures were subsequently reversed). The rest of the macroeconomic policy framework, including the Reserve Bank Act, were in jeopardy. Elected in October 1990 with a record majority, the National party was 15-20 points behind in the polls only a year later, and only scraped narrowly back into government in 1993.

A few years ago, there was renewed debate here around the appropriate pace of fiscal consolidation. At the time, the government had large deficits, and the exchange rate had risen uncomfortably strongly from the 2009 lows. Some argued for a faster pace of fiscal consolidation, arguing that to do so would ease pressure on interest rates and the exchange rate. It had been the thrust of Treasury advice, and some outsiders were also making the case. Among them was then private citizen Graeme Wheeler, who had had a meeting with John Key and Bill English and had reportedly cited the experience on 1991, noting that monetary policy could offset any demand effects of faster fiscal consolidation.   Reports of this conversation had been passed back to the Reserve Bank.

Not many people at the Reserve Bank knew much about that earlier period. Newly-returned to the Reserve Bank from a secondment to Treasury, I wrote an internal paper discussing the interplay between fiscal and monetary policy over 1990 and 1991, including addressing some of the “expansionary fiscal contraction” arguments. It drew extensively on previously published material, on the now-archived files I had maintained during the late 1980s and early 1990s (as manager responsible for the Bank’s Monetary Policy (analysis and advice) section, and from my private diaries.

The Reserve Bank finally released this paper yesterday, with a limited number of deletions (I have appealed these deletions to the Ombudsman, given that they relate to events of 25 years ago, and in some cases involve deleting quotes from my own private diaries). The Bank is obviously uncomfortable about the paper. Despite the fact that the paper draws extensively from contemporary records – most of which are in the Bank’s archives – and was run past (in draft) several of senior people from the Reserve Bank in the early 1990s, the Bank has included a disclaimer on each page suggesting that the paper is primarily based on my memories, which it can’t vouch for. But, to be clear, it draws primarily on contemporary records, trying to document and explain historical events, and then to interpret them to an audience used to different ways of conducting monetary policy. Different people may read the same evidence in different ways, and access to a fuller range of records could alter some perspectives. As an example, while my files had copies of many Treasury papers, and records of many meetings with Treasury officials, I did not have access to a full set of Treasury papers comparable to the collection of Bank papers I used. As background, Graeme Wheeler was the Treasury’s Director of Macroeconomics in 1991.

A copy of the paper is here (two separate links, as that is how I got it from them).

Memo to MPC – Fiscal policy, monetary policy and monetary conditions part 1

Memo to MPC – Fiscal policy, monetary policy and monetary conditions part 2

This was an extremely tense period. The Reserve Bank Act had come into effect on 1 February 1990, and although both main parties officially supported it, it was contentious in both caucuses. In the National Party caucus, Sir Robert Muldoon and Winston Peters had been the leading sceptics. The Labour Party was almost equally split, and Jim Anderton had left the party over the direction of economic policy. Going into the 1990 election, no one knew which wing would dominate the (probable) new National government, nor which tack the Labour Party would take once it was in Opposition. Economic times were tough, and patience with the Reserve Bank was wearing rather thin as the disinflationary years dragged on. It wasn’t helped by the system for implementing monetary policy that we were using (documented here) which at one point led to our efforts being described by Ruth Richardson in Parliament as comparable to those of Basil Fawlty in the comedy classic. (Treasury and the Bank were actively at odds over the implementation arrangements – they variously hankered after money base targets or, on occasion, exchange rate rules[1]).

Last night I reread some of my diaries from the period, and dipped into Ruth Richardson’s book, and Paul Goldsmith’s biography of Don Brash, and was reminded just how fraught the period was. We spent most of 1991 not knowing whether, or how long, the monetary policy framework would last, and whether the senior management would survive. Ruth Richardson records that even at the end of 1991 when the worst of the pressures were beginning to ease, the Prime Minister Jim Bolger, in a meeting of senior ministers, canvassed the possibility of changing the Reserve Bank Act to provide an impetus to growth.

The Bank had for some time publicly argued that there was no problem with the exchange rate. As a result the Bank’s position with the new government was not helped by a change of stance quite late in the piece: the new view was that a lower real exchange rate was likely to be required to rebalance the New Zealand economy. This was an important theme in the Reserve Bank’s 1990 post-election briefing, and took the incoming Minister of Finance quite by surprise. The Reserve Bank openly making the case for a lower exchange rate seemed to provide ammunition for some of her caucus and Cabinet colleagues who were less convinced of the overriding importance of macroeconomic stabilisation.

She would have been more aghast had she realised that until the very eve of the election the Reserve Bank had been planning to recommend stepping back from the 0-2 per cent inflation target itself. This had been the outcome of some mix of unease over how (excessively) mechanical the first Policy Targets Agreement had been, and a wish to allow room for the desired depreciation in the exchange rate. The suggestion had been to keep a medium to longer-term focus on a 0-2 target, or perhaps redefine it to 1-2 per cent, but to add a 0-4 per cent “accountability range”, within which inflation could fluctuate without triggering severe accountability consequences. We stepped back from that recommendation at the last minute, in large part because of the view that to have recommended that sort of change would have left Ruth Richardson out to dry, as the only defender of a 0-2 per cent target, exposing her to (in the words of my diary two days before the election) “Peters’ and Muldoon’s ridicule and Bolger’s incomprehension”.

In terms of the fiscal policy dimensions, one of the Reserve Bank’s deletions in from this extract from my diary a couple of days after the election:

We had a marathon session in Don’s office (from 8-11) going thru para by para agreeing on a text with DTB finally showing his impatience with the last minute chaos. Changed fiscal tack in favour of a tough stance now, to help cement-in any exchange rate depn and, as important as anything it seemed, to help the Richardson faction in Cabinet.

What this captures is the somewhat uncomfortable extent to which the Reserve Bank (and Treasury, as we shall see) in this period were focused on supporting, or at least not undermining, those political players supporting the sorts of frameworks and reforms that the Bank and Treasury favoured. In the Bank, senior management came to a view in 1991 that saving the framework (the Act) was, for now, more important than price stability itself (as least in the short-term). Sceptics of this stategy – I was one – caricatured it as “the Reserve Bank Act is more important than price stability”.

Even with the benefit of long hindsight, I’m not sure what to make of the approach taken at the time. On the one hand, it is somewhat distasteful – neither the Governor nor the rest of us were elected – but on the other hand, perhaps it is just what inevitably happens in any fraught and controversial period. As it happens, we probably gave quite unnecessary ammunition to the opponents of reform through this period. In small part this was because we communicated badly and ran an implementation system that – with hindsight – was pretty bizarre. But more importantly, we held monetary policy too tight for too long – not to make any points, or reinforce any positions, but simply because we misread how strong the disinflationary forces were by then. In a serious recession, that was black mark against the Bank (and I was one of the more hawkish people on the Reserve Bank side).

During 1991, the Treasury became very focused on supporting the political position of Ruth Richardson as Minister of Finance. Some of this is captured in the paper. But much of I didn’t include, since the focus of the paper had been on the fiscal/monetary interplay. On page 15 of the paper, the Bank seems to have deleted some of this extract from my 4 September diary”

David [Archer] and I had lunch with Graeme Wheeler and Howard [Fancy][2] and were treated to a litany of gloom, of how we needed to be supporting the macro policy mix and helping get the recovery going and being very concerned about the political risks. As GW said “I wouldn’t want history to look back on me as a policymaker and say that in my confidence about the framework I hadn’t taken adequate precautions” – referring to the Bank. He was going on about how we had a “near-perfect” mon pol framework for the medium-term but that at the moment we needed to be more flexible. Both were concerned to play down 0-2, with vacuous waffle about “best endeavours” but taking the view that, in effect, 2-4% inflation wouldn’t worry them. ….. Apparently Bolger is getting worried about 1981/1932 re-runs: mass demonstrations, violence in the streets etc.

Only a few months previously the Treasury had been openly sceptical that macro policy was sufficiently tight.  It wasn’t always clear how well Treasury was reading the politics either – I had a very good relationship with Ruth Richardson’s own economic adviser, Martin Hames, and on the evening of the deleted extract above I recorded a long conversation with Martin in which “he still claims there are no real threats: says things were a lot worse at times in Oppn”.

This has been become rather a long post. It is partly about providing some context for those who think about reading the whole paper. Here are a few of my bottom lines:

  • Had we been running a now-conventional system of monetary policy implementation, many of the less important of these tensions and ructions would not have arisen.  When demand and inflation ease –  whatever the source –  the OCR is generally  cut.
  • While, with the benefit of hindsight, New Zealand was probably always going to settle at a low inflation rate (all other advanced economies did) that wasn’t remotely clear at the time.  In particular, the initial passage, and the survival, of the Reserve Bank Act was a much closer-run thing than is generally recognised. Infant mortality was a real threat
  • Neither the Reserve Bank nor the Treasury covered themselves with glory through this period in their macroeconomic analysis and policy advice.

[1] Murray Sherwin presciently argued that we should adopt an OCR. I’m still embarrassed by the note I wrote in response to that suggestion.

[2] David was the Bank’s deputy chief economist, and Howard was Treasury’s macro deputy secretary.

72 per cent want to restrict “junk food” advertising

I’m not among them.

According to the Herald 72 per cent of respondents to a recent survey favour greater government controls on “junk-food” promotions to children. Similar numbers wanted to restrict or ban “unhealthy” food brands sponsoring children’s sport.  A couple of mothers are interviewed in support of such restrictions, citing the dreaded “pester power”.

As I said, I’m not among the 72 per cent. I have three kids, have done all our family shopping for years, usually have at least one child with me when I’m at the supermarket, and two of my children play team sports, where “player of the day” certificates/prizes often come from outfits like Hell Pizza or McDonalds.

But, you know what, we just say no. I don’t encounter very much “pester power” in the supermarket aisles, and when I do I almost always say no. The children watch some television – admittedly not much of it free-to-air – but they know what it is worth pestering me about (“how about making a goat curry, pleeease Dad”) and what it is not. And they aren’t fed on an unremitting diet of lentils and kale either – we have a dessert each evening, consistent with my constant message to them (contrary to the one the schools propagandize then with) that “what matters is a balanced diet and plenty of exercise. Both kids won player of the day certificates on Saturday, but we don’t let them take advantage of the free pizza at Hell Pizza (as it happens, not because it is “junk food” but because we deplore the values that company promotes).  I hope Hell Pizza fails, but I certainly don’t think it should be banned, or should be unable to promote its business.

Just say no. It isn’t really that hard. Start young, but start. Why would we want to contract out responsibility for raising our children to the government? Too much of life is already spent trying to reverse the pernicious effects of propaganda (“evils of capitalism”, for example) from state schools.

The zero lower bound and Miles Kimball’s visit

One of my persistent messages on this blog has been that central banks and finance ministries need to be much more pro-active in dealing with the technological and regulatory issues that make the near-zero lower bound a binding constraint on how low policy interest rates can go, and hence on how much support monetary policy can provide in periods of excess capacity (and insufficient demand).

I’ve found it surprising that the central banks and governments of other advanced economies have not done more in this area. In most of these countries, policy interest rates have been at or near what they had treated as lower bounds since 2008/09. A few have been plumbing new depths in the last year or so, but half-heartedly (the negative rates have not applied to all balances at the central bank), and no one is confident that policy interest rates could be taken much below -50bps (or perhaps -75bps) without policy starting to become much less effective. The ability to convert to physical currency without limit is the constraint. There are holding costs to doing so, but for all except day-to-day transactions, the holding costs would be less than the cost of continuing to hold deposits once interest rates get materially negative. For asset managers and pension funds, for example, that shift would look attractive.  I would certainly recommend that the Reserve Bank pension fund (of which I’m an elected trustee) transferred much of its short-term fixed income holdings into cash if the New Zealand OCR looked likely to be negative for any length of time.

I’ve been surprised by the lack of much urgency in grappling with this issue in other countries. I suspect there must have been a sentiment along the lines of “well, getting to zero was a surprise, and inconvenient, but we got through that recession, it is too late to do anything now, and before too long policy rates will be heading back up to more normal levels”.     But they haven’t, despite false starts from several central banks. And each of these countries is exposed to the risk of a new recession, with little or no macroeconomic policy ammunition left in the arsenal. Interest rates can’t be cut, and the political limits to further fiscal stimulus are severe in most advanced countries.

If the rather sluggish reaction of other advanced country central banks (and finance ministries) is a surprise, the lack of any initiative by the New Zealand and Australian authorities is harder to excuse. Neither country hit the zero bound in 2008/09, or in the more recent slowdown (Australian policy rates are now at their lows, and commentators increasingly expect that New Zealand’s soon will be).  The period since 2008/09 should have shown authorities that the zero lower bound is much more of a threat that most of us previously realised (not just, for example, a Japanese oddity). It should have suggested some serious contingency planning – as, for example, the Reserve Bank of New Zealand had done as part of whole of government preparedness for the possibility of a flu pandemic. Both countries have had years to get ready for the possibility of the zero lower bound. It is not as if the experience of the countries who have hit zero is exactly encouraging – slow and weak recoveries and lingering high unemployment.

But neither New Zealand nor Australia appears to have done anything about it. Indeed, in the most recent Reserve Bank of New Zealand Statement of Intent these issues don’t even rate a mention. I’m not suggesting it is the single most urgent or important issue the central banks face. Contingency planning never is, but that does not make doing it any less important. I’m also not suggesting that New Zealand is as badly placed as some – if we were to get to a zero OCR, our yield advantage would disappear and the exchange rate would probably be revisiting the lows last seen in 2000. And we have some more room for fiscal stimulus than some other countries. But no central bank or finance ministry should contemplate with equanimity the exhaustion of monetary policy ammunition.  Nasty shocks are often worse than we allow for.

My prompt for this post is the visit to New Zealand this week of Miles Kimball, Professor of Economics at the University of Michigan (and an interesting blogger across a range of topics). Kimball has probably been the most active figure in exploring and promoting practical ways to deal with the regulatory constraints and administrative practices that make the ZLB a problem. They are all government choices. I’ve linked to some of his work previously. I noticed Kimball’s visit through a flyer for a guest lecture he is giving at Treasury on Friday, on a quite unrelated topic. I presume he will also be spending time at the Reserve Bank, addressing some of the monetary issues. This would seem like a good opportunity for some serious and enterprising journalist to get in touch with Kimball – whether directly, or via the Reserve Bank or Treasury – for an interview on some of his work in this area, and the reaction he is getting as he promotes his ideas, and practical solutions, around the world.

I’ve suggested previously that if our authorities are not willing to start on serious preparations to overcome the ZLB then the Minister should think much more seriously about raising the inflation target. I’d prefer to avoid a higher inflation target – indeed, in the long-run a target centred nearer zero would be good – but current inflation targets (here and abroad) were set before people really appreciated just how much of a constraint the zero lower bound could be. Better to act now so that in any future severe recession there is no question as to ability of the Reserve Bank to cut the OCR just as much as macroeconomic conditions warrant.

Here are some other previous posts where I have touched on ZLB issues:

On the physical currency monopoly, and thus block to innovation, held by central banks.

On a sceptical speech on these issues by a senior Federal Reserve official

How not to have a “reasoned and deliberate discussion” of housing and immigration

I noted in my post yesterday that I was a little surprised at how NBR had characterised differences between Shamubeel Eaqub and me around how to think about the contribution of immigration policy to housing demand. The description was “war of words”, something I didn’t recognise. But I hadn’t seen the article then.

As I noted yesterday, the difference is simply about how to interpret net PLT migration figures. Shamubeel uses them to conclude that immigration policy has not been a major influence on housing demand over 50 years. I pointed out, in response, that immigration policy is about how many non-New Zealanders we let in, and how long we let them stay. It does not affect the movement of New Zealanders at all. Accordingly, if we want to understand the role of immigration policy, we should focus mainly on data on the movement of non-New Zealand citizens. I have used the net inflow of non-New Zealand citizens as a proxy, while noting that it is not a perfect proxy.  On that measure, most of the trend increase in household numbers is now down to immigration policy choices.

So far I thought we just had the sort of difference that crops up all the time in analysing data. Someone proposes a hypothesis, with some numbers, and others respond questioning whether, for example, the data cited are showing quite what the first analyst thought they were. That sort of debate is how we advance our understanding. I didn’t (and don’t) challenge the accuracy of Shamubeel’s numbers (and I’m sure he isn’t challenging mine). The only issue should be what light each set of numbers sheds on the issue (and which issues they each shed light on). As I put it yesterday, if people prefer I’m quite happy to say that (given land use and housing supply restrictions) the large net outflow of New Zealanders has greatly eased pressure on house and urban land prices, and the (even larger) policy-facilitated net inflow of non-New Zealanders has greatly exacerbated pressures.    But only one is a immigration policy matter.

To the extent I had given it any thought, I assumed Shamubeel was approaching the discussion in the same dispassionate way.   In his book (page 129) he notes:

Economist Paul Collier, in his book Exodus argues that we need to talk openly about immigration. Not through the lenses of envy and racism, but in the context of a reasoned and deliberate discussion of why we want immigration, how many people we want, and what kind of people we want.

I nodded, largely agreeing, when I read that passage. Collier’s book is also worth reading.

But this morning I picked up a copy of the print edition of NBR and understood immediately Jenny Ruth’s “war of words” description. Instead of “reasoned and deliberate discussion” my argument is simply dismissed by Shamubeel as “That’s racist”, and “he’s always had this thing about non-New Zealanders. That’s pretty much been the tenor of his work over the last three years”, and “he’s taken a biased approach”.

And there is nothing more than that. There is no sense as to why, as a descriptive exercise, he disagrees with my interpretation of the role of immigration policy in explaining medium-term demand for housing.

Perhaps he provided a more substantive response to the journalist and she didn’t report it, preferring only to report the slurs?  (With apologies to Jenny Ruth) I rather hope so, because Shamubeel is someone whose contributions to economic analysis I have had some time for (indeed on this blog, I encouraged people to read his book) . I think he is much better than is suggested by simply falling back on labels like “racist”, or even “he has this thing about non-New Zealanders”, when someone challenges his framing of the numbers.

I’ve been posing some questions around New Zealand’s immigration policy and the implications for understanding economic performance for five years now. When one is discussing, or researching, the implications of immigration policy, inevitably one is focusing on non-New Zealanders. That is who immigration policy affects. As Shamubeel notes, we (and every country probably) need “reasoned and deliberate discussion of why we want migration, how many people we want, and what kind of people we want”.

In that time I’ve debated the issues and analysis with many people- here and abroad, New Zealand born and foreign born – and I’m pretty sure no one has ever previously accused me of racism.  These are important analytical and policy questions, and the prospects for reasoned and deliberate discussion recede further when people contributing to it the discussion are simply labelled “racist”, rather than engaging on the substance of the issues and analysis.

I hope that Shamubeel will, on reflection, withdraw his slur. As ever, I would be very happy to engage him (or anyone) on the substantive issues (whether interpretative, analytical or policy). And I still think people will benefit from reading his book.

Welfare numbers

I noticed a piece in the newspaper this morning reporting the latest quarterly welfare benefit numbers, including enthusiastic comments from Anne Tolley, the Minister of Social Development.

The report highlighted that the number of working age benefit recipients had reached the lowest June level since June 2008 – the lowest level in the last couple of decades (even though by June 2008 New Zealand was already two quarters into a recession).

These numbers do look like mildly good news, but need to be kept in context.

First, the Minister encourages us to look at annual changes because “quarterly data was subject to seasonal influences”. So perhaps she could ask MSD to resume the practice of publishing seasonally adjusted data. Other agencies do it.

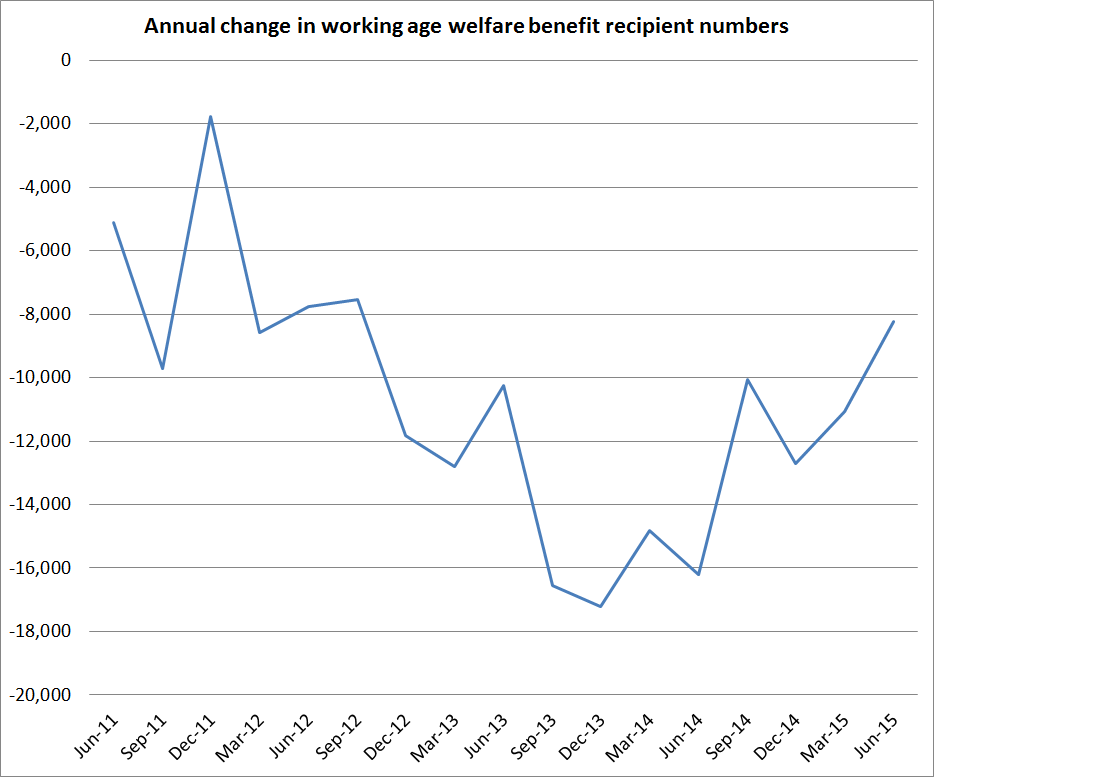
But even focusing on the annual data, these numbers suggest that the best is behind us. Here is a chart of the annual change in the number of working age people on main benefits. At best, a couple of years ago, numbers on benefits were not dropping quite as rapidly as they had been in 2007 (by which time, GDP growth rates were unspectacular). And for the last 18 months or so, the rate of decline in benefit numbers has itself been dropping away. That would be not inconsistent with signs that the unemployment rate has levelled out and, more recently, that the pace of economic growth is slowing.  A more robust recovery – not something the Minister of Social Development can do much about – could have made deeper inroads to the beneficiary numbers.

benefits

But standing further back, the MSD release notes that 10.3 per cent of the working age population is on one of these main benefits.  Repeat slowly: one in ten working age adults is primarily dependent on state welfare benefits for their income. And 74 per cent of those people have been on a main benefit for more than a year.

And how about the ethnicity of recipients. 120000 benefit recipients identified as NZ European and 99000 as Maori. 2013 Census numbers suggests there were just over 300000 people (ages 20-64) self-identifying as Maori.   How people self-identify in the Census might be different to how they identify themselves in MSD, but it looks as though almost one in three adult working age Maori are primarily dependent on state welfare benefits.  And that in an economy with an unemployment rate of under 6 per cent.  It is shameful.  I’m not suggesting it is primarily the current government’s fault. But it is not clear how seriously they, or previous governments, take it. Or whether they are really willing to ask hard questions about how this welfare dependence came to be.

Finally, while it is encouraging to see the numbers on working age benefits dropping, and the government has taken some steps that have assisted that process (which is generally dominated by the economic cycle), don’t forget that total welfare benefit numbers are rising each and every year. MSD don’t make it easy to find quarterly data on the numbers receiving New Zealand Superannuation, but they look to be rising by 20000 a year.  Working age benefit numbers are now dropping by 8000 a year.   That rise in NZS numbers is something that the government could have done something about, by gradually raising the age of eligibility, but has resolutely determined not to do so.

So, yes, there are some mildly encouraging points.  But there is, surely, so much more to do.  Can any of us be content, longer-term, with a society in which such large proportions of the population rely on state grants for their income?

Two comments on housing

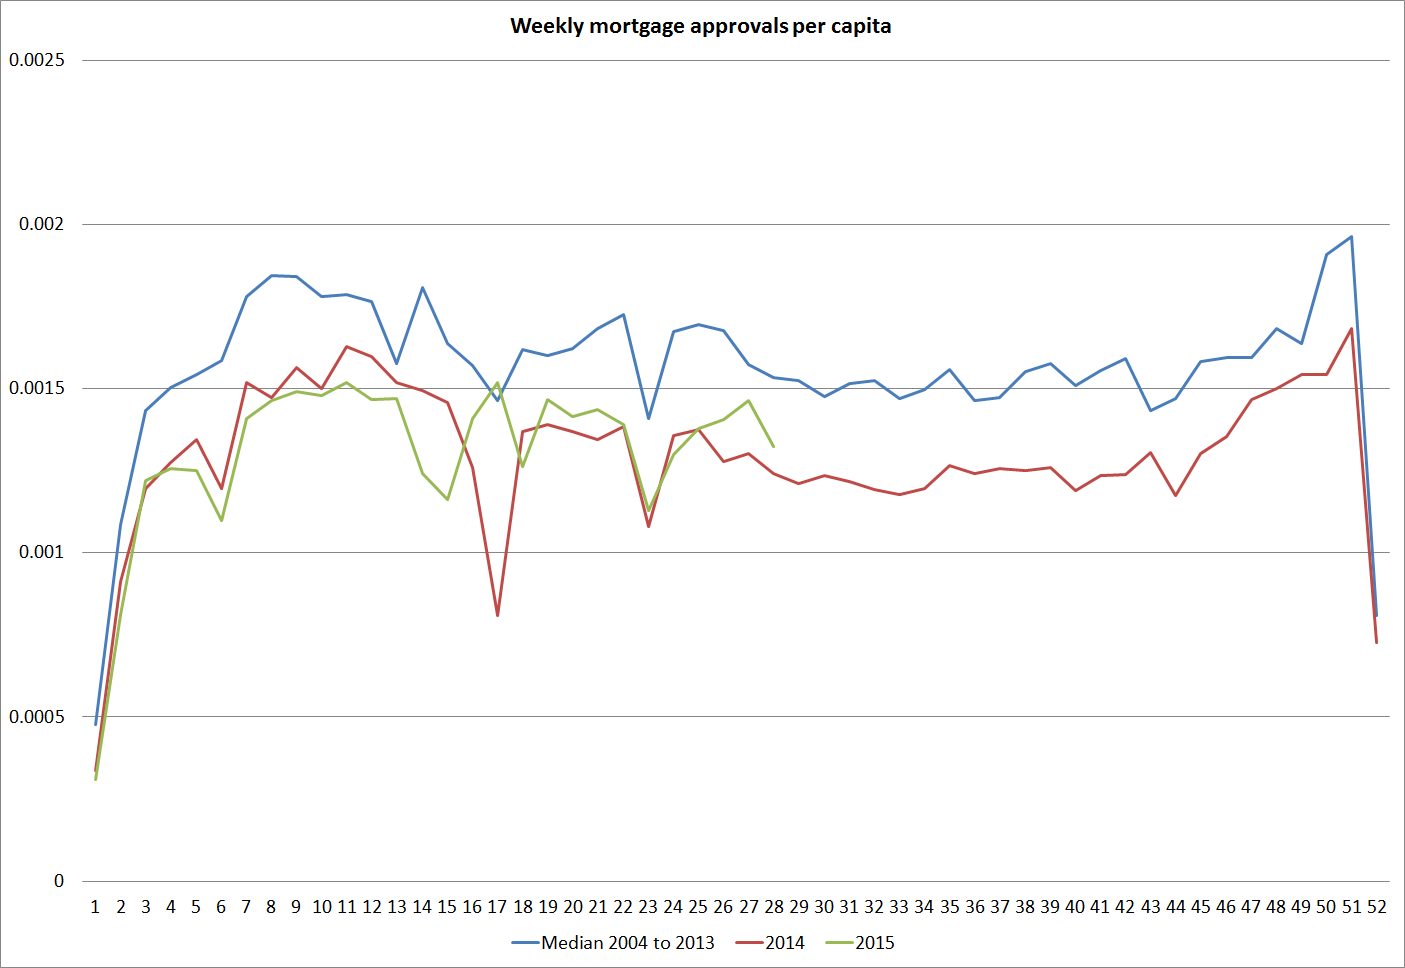
This morning I updated my chart of mortgage approvals per capita. I’ve shown it previously and I like it because it is very timely data.  As you can see, the number of mortgage approvals per capita is running just slightly ahead of last year’s level. But the number of approvals is running below the average, for the time of year, in the 12 year history of the series. In fact, in only three years (2010, 2011, and 2014) have approvals been lower than they are this year.

mortgage approvals 2

What do I take from this? First, it reiterates the point that across the country as a whole the housing markets are not particularly buoyant. House sales per capita are far below the peak in the previous boom. Most places have real house prices below previous (2007) peaks, and in most places nominal house prices are pretty flat.

Auckland is a (big) exception. If we had mortgage approvals data on a regional basis, perhaps we’d find that Auckland’s were nearer to or even above the historical median, while the rest of the country might be tracing the lows. But the non-resident demand for houses in Auckland may also be relevant here. We don’t know how large the contribution of that demand to rising house prices is, but much of those purchases (however large or small they are) are probably either cash purchases, or perhaps financed with credit from abroad (not captured in New Zealand data).

I think these data also tend – not conclusively, but suggestively – to confirm the line I ran in my submission last week on proposed investor finance controls. There is simply no evidence that rising house prices in Auckland are to any material extent the result a credit-driven process. If they were, not only should the Reserve Bank be able to point to concrete evidence of deteriorating lending standards, but we would also expect to see lots of mortgages being approved. In fact, only three years have been weaker.

Changing tack, I see that print edition of the NBR has an article about what is described as a “war of words” between Shamubeel Eaqub and me, about the contribution of immigration policy to the house prices pressures in Auckland over time.  I didn’t recognise the description (“war of words”)  and the print edition of NBR isn’t sold this far out in the suburbs so I haven’t yet seen the article, but I just wanted to explain again the difference in how Shamubeel and I are interpreting the same data. I set it out here a few weeks ago.

Shamubeel notes (correctly) that net migration has accounted for only 9 per cent of household formation in New Zealand over the last 50 years. My point is quite simply that net PLT migration (which is probably understated on average over time) is not a description of the contribution of immigration policy. Immigration policy affects the arrival (and duration of stay) of non-citizens. Using the net flow of non-citizens as a proxy for the policy-controlled bit, I concluded that immigration policy accounts for most of the household formation in New Zealand in the last couple of decades. Since 2006, on this proxy, it accounted for 106 per cent of household formation.

I think it would be entirely reasonable to say that, on the one hand, the large net migration outflow of New Zealand citizens over decades has greatly eased pressure on the housing market (taking as given land use restrictions), and, on the other hand, the large net inflow of non-NZ citizens, which is over time a policy-controlled variable, has (even more) greatly exacerbated those pressures. The net effect of the two independent forces might have been modest over 50 years, but one limb is the endogenous behaviour of private NZ citizens, and the other is the direct outcome of policy choices. I might comment further later when I’ve seen the NBR piece.