Rebalancing: not so much

Rebalancing the economy was a big theme when the current government came to office.

In a brief post on Friday afternoon, I looked back to Bill English’s 2009 Budget speech, shortly after the current government had taken office, and compared his complaints then about the weak export performance in recent years, with the record over the term of the current government.

Of course, exports weren’t the only indicator the then Minister made quite a bit of in his early speeches. I found three such speeches, the 2009 Budget speech, a speech in October 2009 to the Institute of Chartered Accountants (the link to which was working on Friday but not this morning), and the 2010 Budget speech.

There was also a concern about productivity.  In the 2009 Budget

Further, New Zealand’s productivity performance has been poor over the past decade. Ultimately, better productivity growth is the only way to create jobs and sustain high living standards.

And in the NZICA speech

“since 2003, our productivity has sunk to a 25-year low”

and the 2010 Budget referred to

“negative productivity growth between 2000 and 2009”

And there was concern about a lagging tradables sector.  In the 2009 Budget

The common elements to each of these imbalances are excessive growth of the domestic and consumption sectors of the economy. Meanwhile there has been insufficient growth and investment in those parts of the economy that either export or compete with foreign producers.

To NZICA a few months later

…the tradables sector –  that’s exporters or industries competing with imports –  has actually been in recession for five years, contracting by about 10 per cent in that time.

Even more staggering, there have been almost no net jobs created in the tradeables side of the economy for the past 10 years.  By contrast, the non-tradeables sector –  domestic industries not competing with exports, including the Government –  has grown by 15 per cent in the past five years.

And in the 2010 Budget

By contrast, output from exporters and import-competing industries had been in decline since 2005.  These include sectors such as agriculture, horticulture, mining and resources, forestry, fishing, food manufacturing and tourism, all areas where New Zealand should be benefiting from its natural advantages.

And, of course, there was a lot about the shift from fiscal surpluses to fiscal deficits, and about the large current account deficits in the years immediately prior to the recession.

How then have things gone under the watch of the current government?

Before bombarding you with numbers and charts, I would stress that while most of these variables are influenced by government policy choices few are under the direct control of governments, almost all government policies work with a lag, many comparisons also ideally need to take account of what is going on elsewhere in the world, and so on.   So while I will show various comparisons of how some of these economic indicators have done under the National government in the 1990s, the Labour-led government from 1999 to 2008, and the National-led government since then, using averages over the specific terms in office, no one is going to seriously claim that, say, Helen Clark or John  Key coming to office in late 1999 or late 2008 materially altered economic performance in the subsequent quarter or two.   The recession of 2008/09 would have happened, and been more or less as severe as it was, whenever in 2008 or 2009 a New Zealand election had been held.  Fortunately, all three governments held office for prolonged periods, and the use of annual average growth rates also makes comparative growth rates at least a starting point for an informed comparison of the various governments.   Events, good and ill, outside government control all complicate the matter.  To take the current government’s terms as an example, earthquakes were a severe adverse shock, and on the other hand the terms of trade have averaged higher than for many decades.  Neither was, in the slightest, something governments controlled.

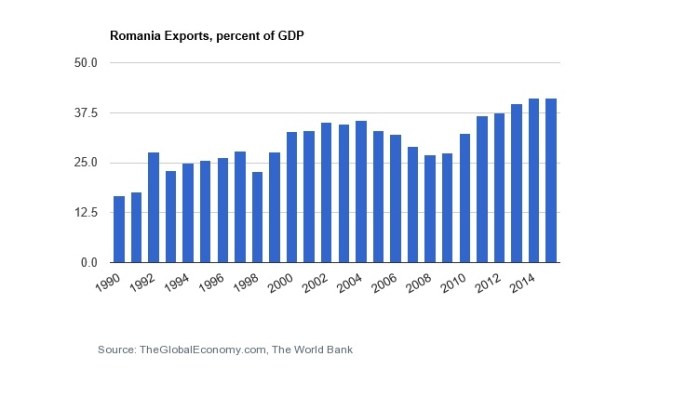
What about exports?  Here I’m using annual totals (so the first number is the average growth rate in total per capita annual export volumes from the year to December 1990 to the year to December 1999).

Export volumes (per capita) – annual average growth rate (%)
Bolger-Shipley government term 4.7
Clark government term 2.1
Key-English government term 1.5
2007q4 to now 1.1

I’d probably focus most on the final line –  the growth rate since just before the recession –  even though it doesn’t cleanly line up with one government or the other.

What about the relative performance of the tradables and non-tradables sector.  I’ve used this indicator a lot, but, as I’ve noted previously, the then Minister had been quite keen on it.    This was more or less the chart the Minister would have had in mind in mid 2009 (there have been subsequent data revisions, but they don’t affect the story much).

t and nt to dec 08

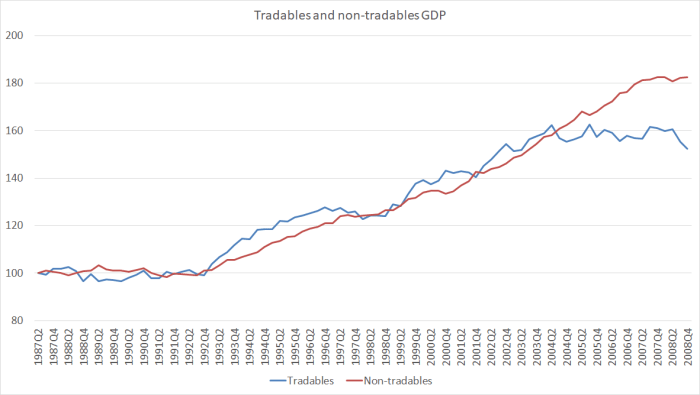
The dip in the blue line right at the end was the recession, but tradables sector output appeared to have been stagnating for some years.

And here is how the same chart appears now.

t and nt to dec 16

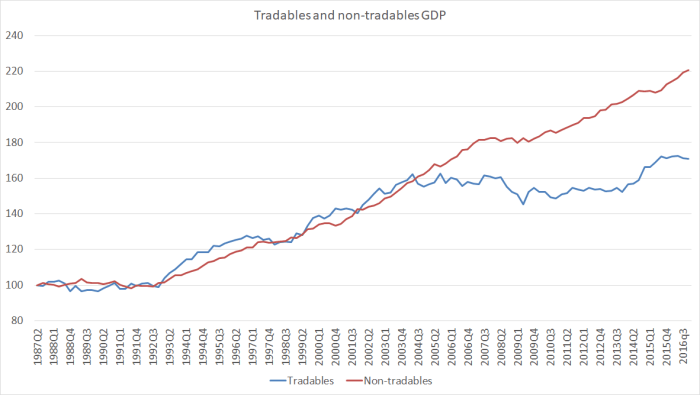
If you were worried about this indicator in mid 2009 (and not everyone was), things don’t look any better now (this is particularly apparent in the per capita version of this chart here ).

Here are the average annual per capita growth rates for the tradables and non-tradables GDP components.

Tradables Non-tradables
Annual average per capita growth rate
Bolger-Shipley 2.3 1.7
Clark -0.1 2.5
Key-English 1.4 1.1
2007q4 to now -0.6 0.9

An impartial observer would suggest not much change under the current government.  Tradables output appears to have grown faster, but that appears to be only because the government changed at the very bottom of the recession.     Date the comparison from just prior to the recession, and performance on this indicator –  which new Minister of Finance Bill English seemed to quite like –  hasn’t been particularly encouraging.In those quotes I cited earlier, there was reference to employment growth in the tradables and non-tradables sector.  There is no easy way I’m aware of to make that calculation, in a way that lines up with the split in the GDP numbers.  I recall being involved in some discussions at the time about a possible tradables vs non-tradables employment indicator, but can’t now shed any further light.What about productivity?I’m not sure where the Minister got his numbers in 2009 supporting the claim that productivity growth had been negative in the previous few years.  It may have been SNZ’s multi-factor productivity indicator (for the “measured sector”.MFP to 16 
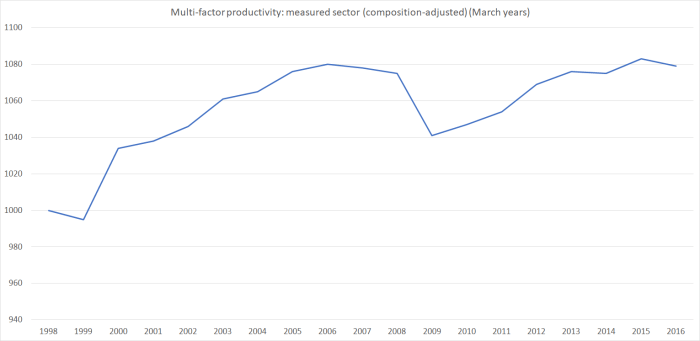
MFP measures are quite cyclical –  if plant lies idle in a recession measured MFP will fall –  but unfortunately the latest observations are only around the same levels reached a decade ago.  There was no MFP growth late in the previous boom.  There has been none since.

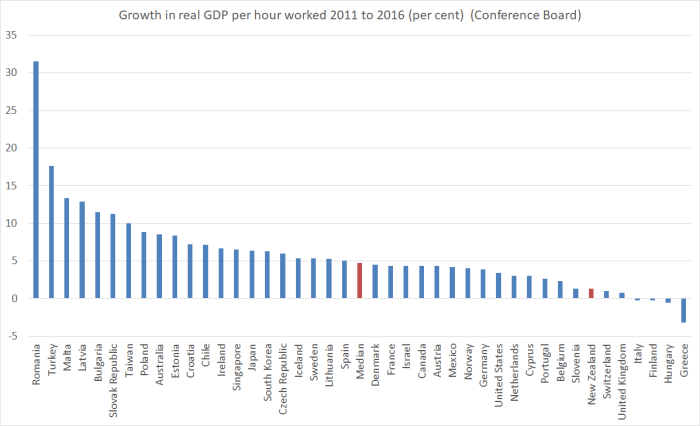
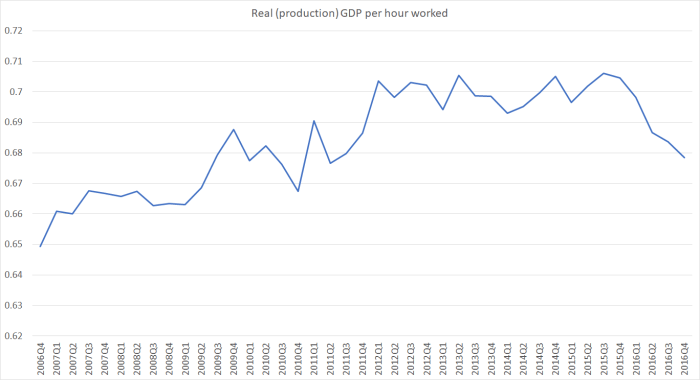
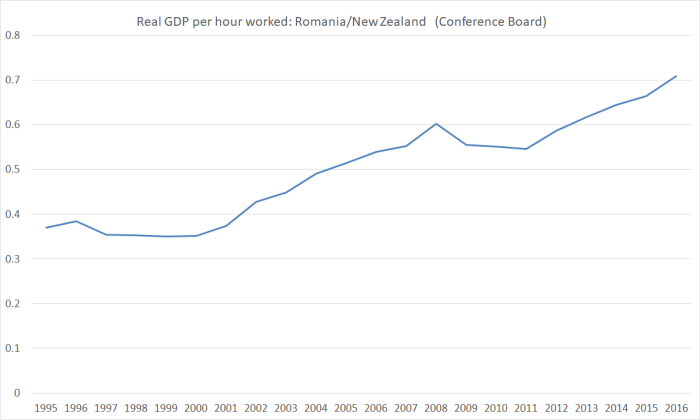
Labour productivity measures are more widely cited.  I tend to use (and do so here) GDP per hour worked calculated by averaging the two real GDP measures and dividing them by HLFS hours worked.  Treasury uses a production GDP based measure.  It doesn’t materially affect these comparisons (if anything, my measure is slightly more favourable over the last eight years).It would be remiss of me not to remind readers that global productivity growth has also been weak over the last decade, but as I’ve illustrated in various posts, New Zealand has continued do worse than the typical advanced country average over recent years, and our sharp productivity slowdown really seems to date from around 2012.Of course, there is another side of the picture.  There is no doubt credit due for the effort that has gone in to close the fiscal deficit.  In the course of that period, the government accounts have been buffeted, on the one hand by the impact of the earthquakes, and on the other by the record high average terms of trade New Zealand has been enjoying.Interestingly, for those who do want to emphasise the role of fiscal policy in exacerbating or easing pressure on the real exchange rate, here is a chart of government consumption spending (on actual goods and services, not just cash transfers) as a share of GDP.Govt C

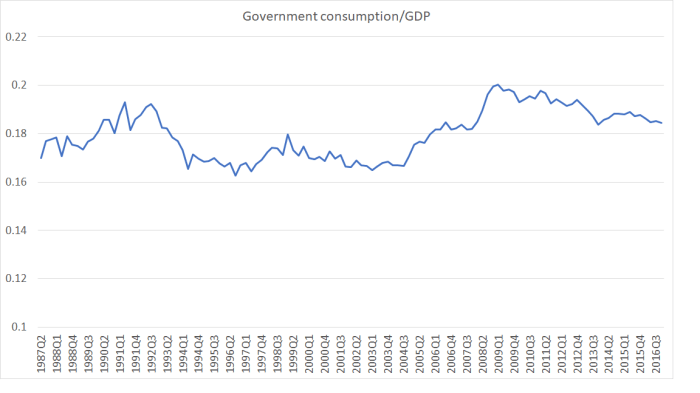
Real GDP per hour worked
Annual average growth rate
Bolger-Shipley 1.1
Clark 1.3
Key-English 0.6
2007q4 to now 0.5

It is a certainly a smaller share of the economy than it was during the recession –  that peak was a combination of rising government spending and the way that relatively stable government spending tends to rise as a share of GDP in every recession (you can see it even in the early 1990s).   As of now, government consumption spending as a share of GDP is still almost two full percentage points higher than the share it averaged –  under two different governments – from the mid 1990s to the mid 2000s.   Whatever the merits of such spending, it won’t have facilitated any sort of rebalancing of the economy.

We now expect New Zealand governments to run balanced budgets, or even surpluses.  All three governments since 1990 have.  That is no small achievement, but there isn’t much to differentiate one government from the others.

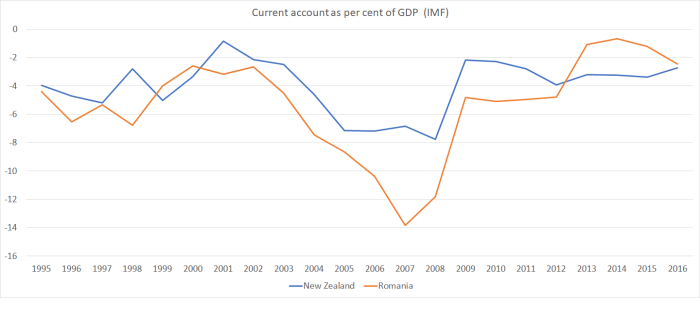
What about the current account deficit?    It certainly is smaller than we had experienced in the years running up to the recession –  but those years look exceptional.

CAD

In fact, the current account deficit at present (2.7 per cent of GDP) isn’t much different from the average over the period 1988 to 2004 (3.1 per cent).   And that despite two things largely outside New Zealand’s control:

  • the interest rate on our quite large accumulated stock of foreign debt is much lower than it was (most of the debt is hedged back to NZD, and New Zealand short-term interest rates in the last four years of the boom averaged 6 per cent or more (the OCR peaked at 8.25 per cent).  The OCR now is 1.75 per cent.    The gap is smaller at longer maturities, but there was a quite unexpected windfall in the reduction in interest rates,
  • the very high average level of the terms of trade (almost 10 per cent higher in the last three years than in the last years of the previous boom).

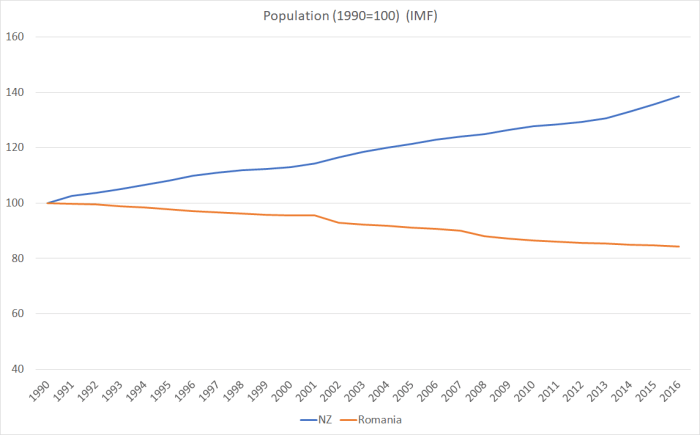
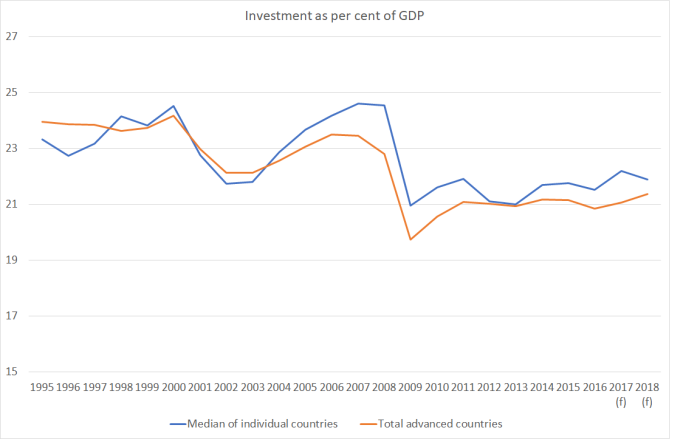
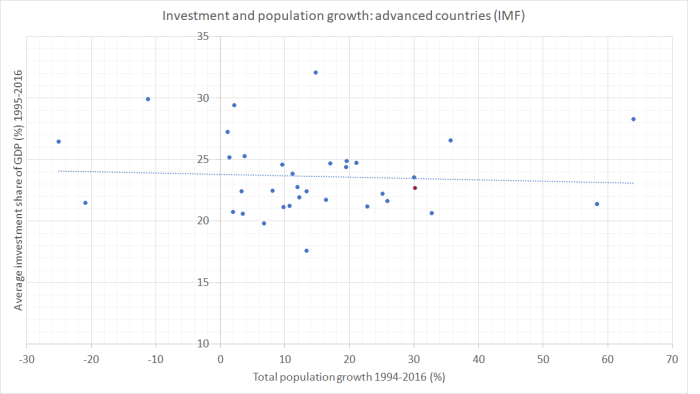
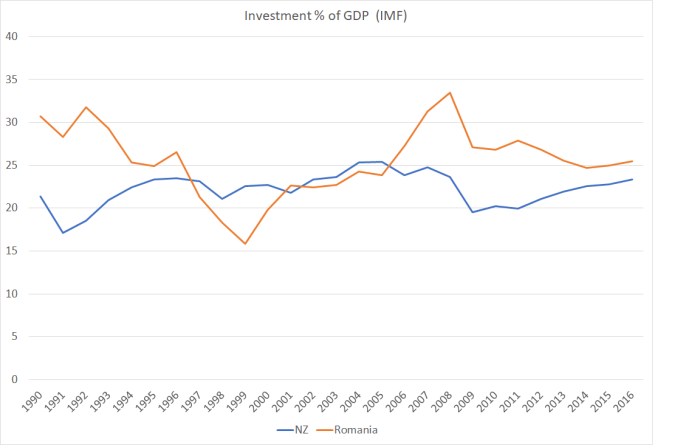
Another way of expressing the current account balance is the difference between savings and investment.    Government investment as a share of GDP is now much as it was during the pre-recession boom years.  Other investment –  despite all the construction activiity –  is not.

investment to dec 16

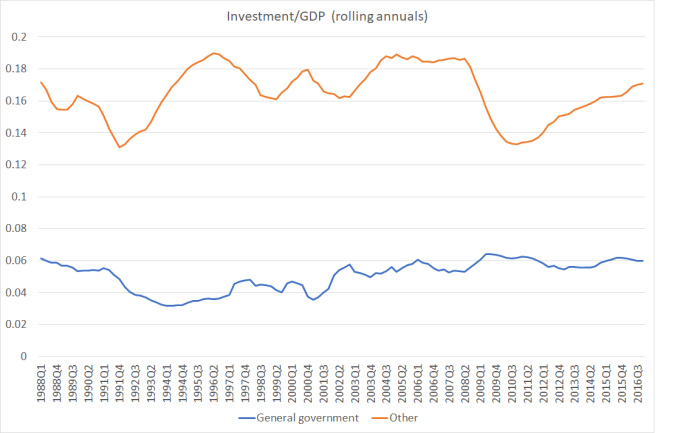
Despite all the population growth the non-government sector as a whole appears not to have been finding the scale of remunerative investment opportunities that they were voluntarily undertaking –  wisely or not –  in the pre-recession period.   Not quite the sort of rebalancing that the 2009 Minister of Finance appeared to have in mind.

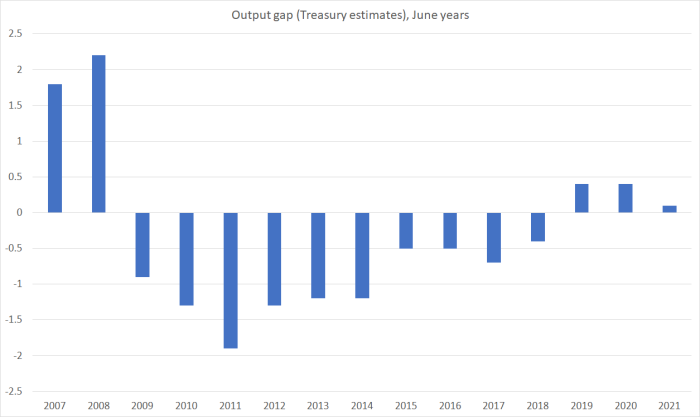
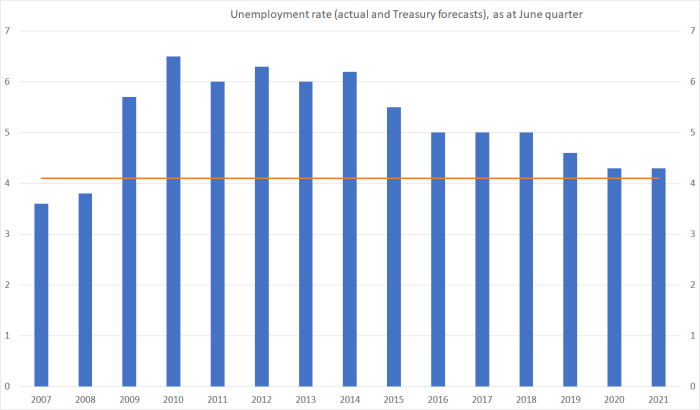
Perhaps the subdued investment isn’t too surprising given that, on Treasury’s estimates, New Zealand has had a negative output gap –  unemployed excess resources –  for getting on for 10 years now.

And what of saving?  We don’t have a quarterly national savings series, but the other side of savings is spending –  consumption.     An earlier chart showed that government consumption was still running higher than we’d seen previously.   Here is total consumption as a share of GDP.

total consumption

The latest observation is just a little below the average of the history of the series (consistent with the annual national saving rate data, which is just slightly above the average of the history of the series).

What to make of all this?   New Zealand’s productivity performance has been pretty poor, as has the overall performance of its tradable sector.  Consistent with the continuing excess capacity, and perhaps with the weak productivity performance, non-housing private investment has remained pretty subdued, and that is  reflected in the smaller current account deficit than we’d seen for some time.   Economic outcomes are never fully the result of government choices.  But as the current incumbents approach the voters a few months from now, on the sorts of indicators they incumbents were citing, with legitiimate concern, when they came to office, the story doesn’t look like a particularly favourable one, of corners turned, new and better trajectories set out on.   And that without even mentioning house prices.

The Rennie review

A couple of months ago we learned that the new Minister of Finance had requested Treasury to have a review done of two key aspects of the governance of the Reserve Bank:

  • whether something like the existing internal committee in which the Governor makes his OCR decisions should be formalised in legislation, and
  • whether the Reserve Bank should remain the “owner” of the various pieces of legislation (RB Act, as well as the insurance and non-bank legislation) it operates under.

Treasury, in turn, contracted Iain Rennie to conduct the review. Rennie was, until not long ago, State Services Commissioner.  And a bit earlier in his career he had been Treasury’s Deputy Secretary for macroeconomic policy, including all matters to do with the Reserve Bank.

Learning of the review, someone lodged an Official Information Act request with The Treasury, seeking (a) the terms of reference of the review, and (b) the terms on which Rennie was engaged.    Treasury’s response, dated 17 May, is here.

Somewhat strangely, the terms of reference for the review were withheld, allegedly to “maintain the constitutional conventions protecting the confidentiality of advice tendered by ministers and officials”.      Which seems strange because (a) the Minister had already talked to the media (first link above) about what the review would cover, and (b) because Rennie is neither a minister nor an official, just a consultant hired to provide some analysis and advice.  The terms of reference for that work hardly seem to amount to “advice”.   Treasury further state that the terms of reference are withheld “to enable Minister and officials to have undisturbed consideration of advice”.  I’m not clear that that is a statutory ground, and –  as importantly –  how knowledge of a consultant’s terms of reference would interfere with “undisturbed consideration of advice” is far from clear.

But Treasury did release Rennie’s terms of engagement, and some other interesting bits of information.   We learn that

The Treasury is contracting Iain Rennie to provide a report assessing governance and decision-making at the Reserve Bank.

Is this different, I wonder, than looking at the relevant statutory provisions (the implication  of the words is that the report will assess actual governance and decisionmaking, rather than the relevant laws)?  Perhaps not.  The wording might also be taken as implying that the review covers more than just decisionmaking for monetary policy.  If so, that would be welcome.

Pleasingly, Treasury seemed not just to be pushing a single option.

The analysis should outline a few alternative, coherent reform packages, and draw out the central design trade-offs, while making clear a preferred approach.

We also learn, and this did surprise me a little, that the contract period began on 7 February.  That was the day the Minister of Finance announced Grant Spencer’s appointment as acting Governor, having taken the relevant paper to Cabinet that morning.   If Rennie’s contract started from 7 February, presumably the Minister’s decision to initiate this review work had been taken some time earlier –  perhaps not long after he took office.

When he took the job, Rennie undertook to have his report completed by 31 March (in return for $60000 + GST).  In fact, the papers confirm that Rennie took longer than expected and, by mutual agreement, the final report was delivered to Treasury on 18 April.

In undertaking this contract, Rennie and Treasury agreed that

In completing the work, the author will engage with an agreed set of domestic and international experts

This seems a strange provision.  It suggests that Treasury could veto who Rennie could consult with in researching the issues and analysing the options.  It would be very interesting to know who these experts are –  perhaps especially the domestic ones.   (I’ve written extensively on the issues and wasn’t consulted –  not that I had expected to be.)  I will lodge an OIA request for that information.

Having received Rennie’s report, Treasury has a further step in the process, presumably before they pass on the report, and their own advice, to the Minister of Finance.

The key deliverable is a report, which will be peer reviewed by a panel of international experts.

Again, it would be useful –  and interesting to know –  which “international experts” they are consulting, and perhaps a little surprising that the peer review process does not appear to include people who might be expert in New Zealand public sector governance.  The Reserve Bank is,  after all, one government entity among many.

It would be good if we could get some clear answers from Treasury and the Minister of Finance as to when the final report, together with comments from the peer reviewers, might be available.   In his earlier comments, Steven Joyce told the Fairfax journalist that  “he expected Rennie to report back some time after May’s Budget”.   That was clearly somewhat misleading –  the original contract had a report back from Rennie by 31 March –  but even setting that aside, it is now after the Budget.    As this is an issue where the political parties differ –  Labour, the Greens, and (I think) New Zealand First already promising change –  it would be highly desirable to have this expert report, peer-reviewed by international experts, in the public domain as soon as possible.

In digging around, I stumbled across The Treasury’s 2001 advice to the then Minister of Finance on the recommendations of the Svensson inquiry into monetary policy and the Reserve Bank.  I’d seen it at the time, but long since forgotten it.  The principal author  of the paper was someone who is now a Treasury Deputy Secretary, but his boss –  also listed on the paper –  was one Iain Rennie, then deputy secretary responsible for matters macro.

Svensson had a number of sensible recommendations.  Until that time, the Governor had chaired the Reserve Bank Board, even though the Board’s main job was to monitor and hold the Governor to account.  That was clearly a nonsense, and Svensson recommended change.  That recommendation has been adopted and the law was changed accordingly.   But Svensson also recommended removing the Governor from the Board altogether –  it being, at very least, anomalous to have the Governor as a member of a body whose main purpose is to review his own performance (as distinct, say, from a business in which a Managing Director might be a member of the board, but in that case the Board has all the ultimate strategic decisionaming responsibilities).  The Police Commissioner, for example, isn’t involved in the governance of the IPCA.  Rennie and Treasury advised against making that change, even though they explicitly recognised what the role of the Board was.   Quite why is never made clear.

And then, perhaps more importantly, Svensson recommended that the law be changed to shift away from the single decisionmaker structure, in which all executive powers are vested in the Governor personally.  Even then, in 2001, it was an unusual model internationally.  Svensson proposed legislating to give an internal committee of senior Bank managers the formal decisionmaking powers.

Here was the response of Rennie’s wing of Treasury.

We believe the clear and strong accountability of the present structure has considerable merit.  The Governor is solely and clearly responsible for monetary policy performance and may be dismissed by the Minister in the event of inadequate performance.  While the Minister’s ability to dismiss a poorly performing Governor may be severely limited in practice, his ability to dismiss a poorly performing committee would be even more limited.

The formation of a decision-making committee would require extensive changes to the Reserve Bank Act.  The statutory responsibility for price stability that currently rests with the Governor, and the statutory relationship between the Minister and the Governor, would need to be amended to give effect to the responsibilities of the Committee.

The issues raised above suggest that the potential benefits of forming a formal internal decision-making committee are likely to be small.

Having taken such a stance then, one can only hope that in conducting his recent review, Rennie is rather more open to change than he was in 2001.   (I should add that I did not then, and do not now, think Svensson’s specific recommendation should have been adopted –  but there are other feasible approaches to adopting a collective decisionmaking model).  It is striking, for example, that in this Treasury advice there is no mention at all of how other government agencies in New Zealand are governed (hint: none involving policy setting involve single decisionmakers, with no rights of appeal).  It is also telling of how the Bank has changed –  by legislation and gubernatorial inclination –  that there is no discussion at all of how the financial regulatory powers of the Bank should be governed.  In many respects, the advice seems stuck in the 1980s –  when the Reserve Bank structure was first designed –  including with the emphasis on the ability of the Minister to sack an individual relative to a committee.  That was an important consideration in the late 1980s, but it isn’t one that has led us to have other government rule-making, policymaking, agencies governed by single (unelected) decisionmakers.

It is, of course, a little unfair to hold anyone to advice they offered sixteen years ago, and I’m not seriously attempting to.  Times and attitudes, and responsibilities, change. But it can be difficult at times for senior people to walk away from public stances on important issues that they have taken previously.   I hope that when we finally see the Rennie report, a willingness to approach the issue with a genuinely fresh set of eyes is evident.

Exports, as seen from the 2009 Budget

I was exchanging notes with someone earlier this afternoon about how the government has lapsed into blather and “making it up” in so many areas.  I was pointing out how doubly sad it was because when the government had first taken the office, the then Minister of Finance –  now Prime Minister –  seemed to have a real concern about some of serious underlying imbalances and indicators of underperformance.  I used to help provide material to his office in support of that.

It is hard to track down old ministerial speeches that far back.  But take the 2009 Budget speech as just one example.  The Minister of Finance said

Indeed export volumes have on average grown by less than 2 per cent annually over the past five years. It has been hard being an exporter in recent times.

noting that

in the long term New Zealand must balance its economy in favour of more investment and jobs in internationally competitive industries.

So how has New Zealand done since?

English on exports

The Minister delivered this speech in May 2009, so presumably the latest data he had available was that to December 2008 (right at the worst of the recession).  In the five years to December 2008, export volumes had indeed –  even with subsequent data revisions –  increased by a bit under 2 per cent per annum.

Export growth had certainly been falling away quite sharply over the previous few years, and those peak growth rates from the five years to 1995 (almost 8 per cent) and to 2003 (almost 6 per cent) were distant memories.  But perhaps a fairer benchmark might not be growth rates to the depth of the severe recession, but perhaps in the five years to the end of the boom.  That seems doubly so because the Minister was arguing that the boom had been severely unbalanced, an opportunity wasted etc.  In the five years to December 2007 (the last pre-recession quarter) export volumes had grown at an average annual rate of 2.7 per cent.

And how are things now?   In his Budget last week, the new Minister of Finance asserted that

Under the Government’s strong economic leadership, New Zealand is shaping globalisation to its advantage.  We’ve embraced increased trade, new technologies, innovation and investment.

In the last five years, export volumes have grown at an annual average rate of 2.83 per cent.   It is a little better than those five years to December 2007.   But if 2.7 per cent annual growth was unsatisfactory, it must be hard to regard 2.83 per cent with equanimity.   Average export growth rates have been much lower under this government than under its predecessor.    Not exactly “shaping globalisation to our advantage……embraced increased trade”.

Now, of course, exports aren’t everything, and we only export so that we can import.  But it is a pretty meagre result.  At least back in 2009, the government could face the challenges squarely (they happened on someone else’s watch).   By now, eight years on, all they seem to have left is falling back on rhetoric, and hoping no one notices the data.

As the (now) Prime Minister noted in 2009, it had been “hard to be an exporter in recent times”.  The real exchange rate had increased a lot during those boom years.    In his 2009 Budget speech the Minister was welcoming the sharp fall in the exchange rate.  Unfortunately –  given the lack of sustained productivity growth to match –  that proved rather fleeting, and it has averaged just as high in the last seven years or so, as it did in the last few years of the previous government’s term.

rer
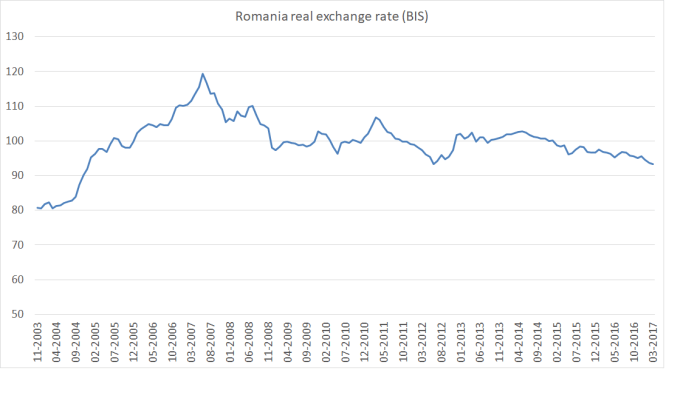
Real exchange rates aren’t things that ministers or governors directly control.  They reflect the balance of (tradables vs non-tradables) forces in the economy.  That balance here –  still –  makes it hard to manage much export volume growth from New Zealand.


A tale of two economies

I’ve never known much about Romania.  There was Olivia Manning’s Balkan TrilogyRichard Wurmbrand was one of the Christian heroes of my youth, and there were the bleak last years of Ceaucescu culminating in a firing squad on Christmas Day 1989.  But that was about it. I had occasionally used it as an example of a rare country that had managed less growth in per capita income than New Zealand over the 20th century.   The rule of law, private property, strong institutions and freedom have quite a lot to be said for them.

And then the other day, an eastern European immigrant to New Zealand was commenting here.  I was curious why an east European had chosen New Zealand, as several of the eastern European economies seemed to have pretty good prospects, perhaps even better than those of New Zealand.  I had in mind especially the Czech Republic, Slovenia and Slovakia (each now with GDP per hour worked very similar to that in New Zealand).  In our subsequent exchange, it turned out that he was Romanian.

And that prompted me to go and check out some data on Romania.  It was a pretty sobering story, for a New Zealander.

Romania had its ups and downs in the 20th century.   Just prior to World War One (when we were one of handful of richest countries in the world) Romania was doing well.   GDP per capita is estimated to have been 75 per cent of that of, say, Norway.   They did really badly for the following 30 years, and then –  on these measures –  quite well economically for the first few communist decades (large scale industrialisation etc).  As with many of the eastern bloc countries, things worsened again for them in the 1980s. Older readers may remember accounts of the “austerity policy” in which everything –  particularly citizen living standards –  was subordinated to repaying the government’s foreign debt.

Things actually got quite a lot worse for Romania (at least in bottom line economic numbers, even if they were free), as for many of the former eastern bloc countries, in the years immediately after end of communist rule (so many distortions to unwind, so many governance problems etc).  In Romania’s case things finally bottomed out –  at least relative to New Zealand – in 2000.

Absolute levels comparisons between Romania and New Zealand are a bit fraught.  Romania isn’t in the OECD, and while they are in the EU we aren’t.  Here are ratios of Romania’s GDP per capita, in purchasing power parity terms, relative to New Zealand since 1990 from (a) the IMF World Economic Outlook database, and (b) the Conference Board Total Economy database.

Romania 2

Those of you who want to be relatively more upbeat on the New Zealand story might choose to emphasise the Conference Board number, and to note that – even after ending decades of communism – on that measure Romania now isn’t much higher relative to New Zealand than it was in 1990.  Personally from all the accounts I’ve seen, I’m more than a little sceptical that Romania’s real living standards in 1990 were in fact half those of New Zealand.   Things are better measured now.

But here is the Conference Board’s real GDP per hour worked series (Romania relative to New Zealand).  The Romanian data only go back to 1995, and these days Romanian statistics are part of Eurostat (ie they won’t be perfect, but I’m not sure there is more reason to doubt statistics for them than for us).

romania 3

In absolute terms it isn’t such a stunning achievement –  since New Zealand productivity growth has lagged that of most other advanced countries over this period –  but………..one of the once-richest countries of the world is on course for having Romania, almost a byword in instability, repression etc for so many decades, catch us up.  It would take a while if current trends continue.  But not that long.  Simply extrapolating the relative performance of just the last decade (and they had a very nasty recession in 2008/09 during that time) about another 20 years.

So how we do maintain a big lead in GDP per capita?  Simply by having more people work more hours.  Here is hours worked per capita (ie per man, woman, and child of all ages).

romania 4

The next time you hear Steven Joyce, or some other minister or business cheerleader, boast that we have more people working than most countries, do try to remember that labour is a cost (to individuals, who would often do other stuff instead if they could) and that the Stakhanovite cult –  extolling the virtues of tireless labour –  was a feature of the communist system, not ours.

Of course, if people do want to work and can’t, then there is a problem.  We measure that through the unemployment statistics.  Romania’s unemployment rate is a bit higher than New Zealand, but at 5.5 per cent the difference is pretty small.  We still do a lot things better than Romania:  we score top of the Transparency International rankings, while Romania is 57th.  We top the World Bank’s ease of doing business index, and they are 36th (not bad at all given where they came from, but a long way off us).   But look at the bottom line growth and productivity performances.

Of course, sometimes what you find in countries with a run of impressive-looking fast growth is that:

  • it is built on big government deficits, or
  • big ill-founded private credit booms, reflected in
  • big current account deficits, and
  • appreciating real exchange rates, with an economy increasingly skewed towards construction and domestic demand.

Our government finances are in better shape than theirs.  The Romanian government (on IMF numbers) has a deficit of about 2 per cent of GDP, while we have a small surplus.  Gross government debt in New Zealand is about 30 per cent of GDP, and in Romania it is about 40 per cent.  But even that is pretty low by advanced country standards.   And for my friends who like to emphasise size of government, (still on IMF numbers) both revenue and expenditure as a share of GDP are a bit smaller in Romania than in New Zealand.

Romanian private credit was very rapid, and looked rather risky, in the years leading up to 2008.  But not now.  There is a chart at the link, and overall domestic credit growth has been running at under 5 per cent per annum for the last few years.

Reflecting the pre-crisis boom in private credit, the Romanian current account deficit widened sharply.    But these days, deficits in Romania are similar to the modest ones we currently have in New Zealand.

romania 5

Romanian investment has fallen back from what they experienced in the credit boom period.  Then again, it is still higher, as a share of GDP, than that in New Zealand.

romania 6

In fact, they had exactly the sort of worrying real exchange rate appreciation one might have expected in the credit-boom years.

romania 7

But after that credit boom ended, the real exchange rate fell back.

Perhaps consistent with that, firms based in Romania seem to have been doing rather well in international markets.  Exports look as though they were squeezed out during the credit boom, but the subsequent recovery and trend growth is pretty impressive.  For a country with a population of about 20 million people, it is a reasonably high foreign trade share (this is exports, but imports are equally important).  Australia, for example, is around 20 per cent of GDP.

romania 8(You will recall that New Zealand has been going backwards on this metric.)

And there was one other interesting comparison.

romania 9

Since 1990, Romania’s population has fallen by 16 per cent, and ours has risen by 40 per cent.   There are several differences.  As I showed a few weeks ago, New Zealand’s total fertility rate over recent decades has been averaging below replacement.  Romania’s has been materially lower still, currently around 1.4.   And both countries have had material outflows of their own citizens: we had a net outflow of New Zealand citizens of around half a million people since 1990.    Romania has also had big outflows but (as far as I can tell) smaller cumulatively than those from New Zealand (there is a reference here to about 2.3 million Romanians living abroad long-term).

But, of course, the other difference is non-citizen immigration.  We’ve for a long time aimed to grant residence approvals equal to around 1 per cent of the population each year.  Since 1990, those policies have given us a net inflow of around one million non-citizens.

The OECD’s International Migration Outlook recorded in 2015 that

Romania sets annual quotas for work authorisations to be issued, although historically demand has been lower than the quotas.  For both 2014 and 2015, the quotas were set at 5500, including 900 intra-corporate transfers and 900 highly-skilled migrants.

In a country of 20 million people.   Not necessarily a policy I’d recommend, but……

Subdued population growth (well, falling population actually) doesn’t seem to have been inconsistent with a pretty impressive period of productivity growth, export growth, strong investment etc etc, all in a country still with its share of governance and regulatory problems.  And that investment isn’t largely having to keep up with a rapidly rising population, it is presumably responding the incentives and opportunities firms are finding).  Perhaps the Romanians, in aggregate and in some sense, wish their population wasn’t falling –  there is still anguishing about the outflow of skilled people – but probably their best hope of reversing that (perhaps slim given the low birth rate) is to keep right on with what they’ve been doing for the last 10 years.  In time, perhaps many of the diaspora might even return –  as they started to in Ireland after they finally got their act together.

30 years ago, Bob Jones toured the country lamenting that the New Zealand economy had come to resemble a Polish shipyard, a byword for inefficiency and industrial disruption.  I do hope in 30 years time there aren’t reforming Romanian politicians campaigning, warning their fellow citizens to avoid the decline and fall of New Zealand.  Yes, for now they are still poorer and, on average, less productive than we are. But those gaps have started closing fast, and the foundations of the growth don’t look that bad at all.

UPDATE: I forgot to mention Romania’s 16 per cent company tax rate.  Not sure (whether as Baptist or economist) I quite approve of the separate regime for nightclubs and gambling operations.

(On another topic, I discovered that my name was being bandied around in Parliament’s question time the other day   –  question 2 here. Winston Peters was quoting me, and Steven Joyce was batting him away.  All good fun no doubt.     But I did notice this comment from the Minister “I appreciate that the member has been talking to Mr Reddell a bit”.  In fact, I have never met Mr Peters, I have never talked to him, never emailed him or had any contact with him whatsoever.  If he or his office appear to read my stuff at times well, of course, I welcome that, as I welcome any readers.   Specific policy proposals, that might actually make a difference, would be even more welcome.)


Thoughts prompted by the FSR

I had only a limited number of specific comments to make on the details of the Reserve Bank’s Financial Stability Report released yesterday.  But it is the last such report for the outgoing Governor Graeme Wheeler, and that itself prompts a few other thoughts.

The Bank continues to tout the line that monetary policy in much of the world is “very accommodative” –  relative to what benchmark is never clear –  and yesterday they claimed that

“a sustained period of very accommodative monetary policy has supported the long-awaited recovery in global economic activity”

That seems questionable on multiple counts.  First, the recovery or growth phase has been underway since at least 2009/10.  There have been setbacks and what felt a little like “growth pauses”, and the overall experience has been pretty underwhelming.  But there also isn’t really much sign of that changing for the better.

And since what the Bank calls “very accommodative monetary policy” has been concentrated in the advanced economies, one obvious place to look for upbeat news might be investment spending.  Lower interest rates, all else equal, make investment today more attractive than otherwise.   But here is the IMF data –  and the IMF is the Bank’s standard reference point for comment on the wider world – for investment as a share of GDP in advanced economies.

investment imf

The latest actual data –  for 2016 –  are still below the cyclical lows in the early 2000s.  And if investment isn’t picking up strongly, neither is the IMF picking a slump in savings rates to support an acceleration of demand.

Across the advanced world, there just isn’t much consistent sign of anything very different in the next few years than we’ve had in the past few.  That suggests interest rates are low for a good –  if not fully-explained –  reason, rather than just that monetary policy is “very accommodative”.

At one level, the terminology doesn’t matter very much, but coming from a central bank offering insights on financial stability, it doesn’t suggest that they really have a good sense of what is going on.   They might be in good company on that score, but it isn’t exactly reasssuring.  If you don’t have a good “model”, the prognostications might not be of much value.

I also found it rather surprising that there was almost nothing in the Financial Stability Report  – the major statutory document on financial stability issues, including the Bank’s conduct of its various regulatory responsibilities – on the recently-released report on New Zealand under the IMF’s financial sector assessment programme (FSAP).   It was a major independent report, which seems to have also involved a substantial commitment of resources by the New Zealand authorities (including the Reserve Bank), in some areas it reached conclusions quite different from current policy, and yet it is barely mentioned in the Bank’s own review.  It isn’t because they didn’t have time –  the papers were released to the public three weeks ago, and the Bank will have had them well before that.  Perhaps it isn’t yet time for a definitive responses to all the points, and some of the issues the FSAP reports raise are really for the government rather than the Bank to decide, but…the silence was deafening.   Perhaps the Bank thought the IMF report really wasn’t much use at all, and was simply being polite?   (I would have some sympathy for such a view, and will before long have my own post on some aspects of the report.)

And there was something a little odd in the box the Bank included on “Vulnerability of owner-occupiers to higher mortgage rates“, clearly softening us up for the consultation paper on debt to income ratios.  They argue that

New Zealand is particularly vulnerable to a sharp rise in mortgage rates as the banking system funds a large proportion of its mortgage credit from offshore wholesale markets. The cost of this funding can increase sharply if there is an unexpected increase in global interest rates or a change in investor risk appetite, and banks are likely to pass on the higher funding costs to customers through higher mortgage rates.


But mostly this is just untrue.  The Reserve Bank sets the OCR in New Zealand based on overall inflation pressures in New Zealand.  If funding spreads rise –  as they did in 2008/09 –  and domestic inflation pressures don’t the Reserve Bank can easily offset most or all of the potential impact on retail interest rates by lowering the OCR.    That is what happened in 2008/09.

Of course, retail interest rates can rise, quite materially.  As the Bank points out, new floating mortgages rose from “around 7 per cent to over 10 per cent between early 2004 and 2007”.  Of course, as we used to stress at the time, fixed mortgage rates rose nowhere near that much.  But, more importantly, interest rates here didn’t rise because foreign rates were rising, but because the economy was cyclically strong, unemployment was low and falling, and wage and price inflation were increasing.  Wages rose roughly 20 per cent in that period.

It is fine and good for the Reserve Bank to do these sorts of stress-testing exercises, looking at what happens if interest rates rise to 7 per cent, or 9 per cent.  But in any realistic assessment, those sorts of substantial increases are only remotely likely if the economy is doing really cyclically well.  If jobs are readily available and wages are rising, not many people will be under that much stress even if interest rates rise quite a lot.  And those that are should quite readily be able to sell their house and move on.  It might be painful for them, but it simply isn’t a financial stability event.

There was some good news in the report.  Previous stress tests conducted by the Reserve Bank with the major banks have used very severe adverse macroeconomic shocks (in some respects –  notably the critical unemployment assumptions –  beyond anything ever seen in a modern floating exchange rate country).  Banks came through those tests largely unscathed.  So this time, the Bank did something a bit different.

The most recent regulator-led exercise was a ‘reverse’ stress test completed in late 2016. This test required the largest four New Zealand banks to determine the most plausible scenario that would lead to a breach of a minimum capital requirement. The results highlight that severe risks would need to materialise before this would occur, beyond the sustained macroeconomic downturn assumed in a typical stress test.

It was another way of reaching the same conclusion the previous tests pointed to: our major banks appear to be strong, and well-managed.   The Reserve Bank is quite explicit that the regulatory regime is not a “zero-failure” one –  in a market economy, firms will fail sometimes, and that includes banks  – but with the sorts of loans the banks had on their books late last year, the latest stress test suggests (again) that it would take something almost inconceivable for one of them to fail.

Which does leave one wondering, again, quite what all the fuss has been about in the last few years, with successive rounds of LVR controls, and the forthcoming consultative document in which the Bank tries to persuade us (and more importantly the Minister of Finance) that it should be able to impose debt-to-income limits too.      When it discusses the world economy, the Bank is quite fond of invoking concerns about “policy uncertainty”, but what certainty and stability has it provided in the markets/institutions it regulates in recent years?  And to what end has all the uncertainty been?

The Bank likes to claim that its successive interventions have ‘improved the resilience of the banking system”.  In fact, they offer us no evidence on that score.   No doubt, as their data show, the number and value of high LVR loans on the books of banks have both fallen.   But high LVR loans require banks to hold higher amounts of capital, and loans that are just below some regulatory threshold, supplemented perhaps by other forms of credit (eg family support), may be only very slightly (if at all) less risky than the loans the banks would have made in an unconstrained world.     The Bank’s claim would be more convincing if (a) they directly addressed the clear and simple point that lower risk lending also lowers the amount of capital banks have to hold (so that the risks might be lower, but so are the buffers if things do turn bad), and (b) if they ever addressed the question of what banks do instead of the high LVR housing lending they are now largely barred from.  Banks’ own risk-appetite probably hasn’t changed, and neither (probably) have the return expectations of their shareholders, so have they pursued other types of risk.   FSR after FSR the Bank never engages with this fairly straightforward point.  It also never engages with the question of how direct controls, frequently revisited, better advance the efficiency of the financial system than indirect mechanisms (primarily the capital requirements for banks, which don’t interpose government regulators directly between banks and their customers).

Perhaps there are good and convincing responses to these sorts of points.  The Wheeler Bank has never even attempted to provide them.

I’m also uneasy about the Bank’s treatment of the housing market.  They have a long list of various factors that play a part at various times in influencing house prices.  I’m pleased that they quite openly state the obvious point –  well, it should be obvious if we didn’t have business think tanks and government-funded researchers arguing that opposite –  that when housing and urban land supply is less than fully elastic, strong net migration inflows can and do boost house prices.

But, for an organisation that has chosen to intervene repeatedly, and which weighs in every six months with an assessment of the risks around the stock of housing lending, they don’t seem to have anything very authoritative to offer.      They have never once noted that land use restrictions –  not just here, but in a variety of similar countries –  could make urban land prices permanently higher.    Without major changes to those laws, other interventions –  taxes, LVR restrictions, government housebuilding programmes, and even immigration restrictions –  will typically only make a modest difference for a relatively short period of time.   And there are no natural market forces that will undo those restrictions –  they aren’t like a temporary credit bubble.     When bank lending standards deteriorate rapidly, there is good reason for people who have lent to banks (and for the regulators) to worry.  When governments enable pernicious land use restrictions, there are plenty of reasons for many to worry – notably the young, who might struggle to ever get a place of their own – but it isn’t much of an issue for financial stability regulators (in that climate, higher gross credit is mostly just an endogenous response).  And yet, for all their interventions, the Reserve Bank has never been able to give us an authoritative story (“model”) on what role the various possible explanatory factors are playing now, and have played over the last 25 years.

I can imagine that the Reserve Bank is uneasy about wading into what can be a rather political debate. I can understand that.  But if you are a government agency actively intervening in a market –  itself a highly “political” choice, favouring some groups of potential buyers over others – you have an obligation to show us your robust supporting analysis.  The Reserve Bank simply hasn’t done so thus far.  Perhaps the robust cost-benefit analysis in the forthcoming consultative document will be different?

And, years on, there is still no robust analysis or research suggesting that the Reserve Bank has thought hard about what the important differences might be between countries where banks’ domestic loan books got into serious trouble and those where they did not?  In 2008/09 for example, New Zealand, Australia, Canada and the UK saw quite different things than the United States and Ireland did (and even those two latter experiences were themselves quite different). It seems like a pretty elementary line of inquiry –  and we do, as taxpayers, pay for a lot of researchers at the Reserve Bank –  but there has been just nothing.  In the meantime, people who are regulated out of credit markets pay the price.

If the Bank doesn’t know the answers to these sorts of questions, perhaps they need to be rather more agnostic about the outlook and the case for their own direct policy interventions in the market.  Focus on stress tests and capital requirements, and eschew direct interventions which have little economic foundation, and are arguably ultra vires anyway.

These are now mostly challenges for the new Governor.  Both Graeme Wheeler and his deputy (and Head of Financial Stability) Grant Spencer are leaving shortly –  Wheeler in September, and Spencer next March.  I hope the new guard takes more seriously some of these issues.  If they do, writing FSRs will be harder, but there would be a great deal more value in the resulting documents even if, in many cases, the resulting analysis leaves as many questions as answers.  That might simply reflect the limits of what we know about the world (and housing markets, housing finance, and banking risk).

Earlier in the year, the Minister of Finance intervened and instructed the Board of the Reserve Bank to stop their search for candidates for a new permanent Governor, and instead to recommend a candidate to be a temporary (acting) Governor.   Doing so avoided trespassing on conventions which restrain governments from making major permanent appointments which would take effect around the time of general elections.  Deputy Governor, Grant Spencer, was –  with what still looks like little secure legal basis –  appointed acting Governor for six months, allowing whichever government takes office after the election to make the appointment of a permanent new Governor.

You might have thought –  I did –  that such a temporary appointment was designed to leave the new government free, and also not to tie the hands of the new Governor.  An acting Governor would make the decisions that really had to be made, keep a steady hand on the tiller, and otherwise leave substantive decisions until a permanent appointee was in place next year.

But it seems that Graeme Wheeler, and the Reserve Bank’s Board –  the latter perhaps still smarting at having to end their earlier search process – didn’t quite see it that way.

With Spencer stepping up to acting Governor, and then retiring when that term ends, there was going to be a vacancy in his substantive roles.  There were two of those.  One was the fulltime day job as Head of Financial Stability (a role in which three departmental heads report to him, covering financial markets and financial stability/supervision.  And the second was the statutory position of Deputy Chief Executive.

A month or so ago, there was a press release from the Reserve Bank filling both positions.    The other current Deputy Governor, Geoff Bascand, was to transfer from his current role (oversight of the operations and admin sides of the Bank) to become Head of Financial Stability, and he was also promoted to become Deputy Chief Executive.  In addition, a search process would get underway straightaway to fill Bascand’s role (adverts have subsequently appeared, and applications have already closed).

Frankly it all seems rather odd.  For a start, even though Bascand has no background in banking, financial markets, or the regulation of those activities, there was no sign that any sort of competitive or contestible process was undertaken before he was appointed Head of Financial Stability.

But it also looks like an attempt to box in the new Governor, whoever he or she may be.  Sure, it is common for a chief executive to inherit a senior management team –  although often enough that is a prompt for a (often disruptive) restructuring etc to allow the new person to shape his or her own team.  Moreover, the qualities one might want in other members of the top team surely depend, at least in part, on the skills, experience, and other qualities of the person at the top.    A more obvious (and common elsewhere) solution would have been to have appointed an acting Head of Financial Stability and then let the new Governor make his or her own choice about the sort of structure and people they want in the roles.  For example, it might be fine to have a macroeconomist as Head of Financial Stability  –  key point of contact with senior people in the financial sector and other regulatory agencies –  if the new Governor has a strong banking background.  If not, it might be a lot more problematic, especially given how large and prominent the Reserve Bank’s regulatory role now is.   (Of course, if Bascand himself becomes Governor, that issue solves itself.)

These points are more important than usual given that talk of statutory reform of Reserve Bank decisionmaking is in the air.  Labour and the Greens are committed to change, and the government has had Iain Rennie looking at the issue.  Again, depending how those matters are resolved (including those around the Bank’s financial regulatory powers), it could easily influence the sort of person one wants in key senior management roles.   (That includes the Assistant Governor position they are filling now.  For all Graeme Wheeler’s talk of the key role of the Governing Committee in making key policy decisions in the Bank, the advert for that position, had hardly any mention of monetary policy and, from memory, none at all of financial regulation.  In many respects that makes a lot of sense –  while the Governor in law actually makes those decisions –  but perhaps not if the Act was to be changed to make a holder of this position a statutory decisionmaker on major areas of public policy.)

And then, of course, there is question of whether all of this was even lawful.   In the Reserve Bank Act,  the role of deputy chief executive is filled by the Board on the recommendation of the Governor.  But there is no vacancy in the role of deputy chief executive while Graeme Wheeler is Governor.  And, even though the press release was worded as coming from both Wheeler and Spencer, the Act does not talk of an acting Governor being able to recommend a deputy chief executive appointment.  Perhaps it is a small issue, but details matter, and the law matters.

All else equal, I happen to think that Geoff Bascand would normally be a sensible appointment for deputy chief executive.    I’m less convinced he is right for the role of Head of Financial Stability, and generally think he would be better-suited (despite his fling with LUCI) for the role of Head of Economics (a role which should have become much more important as the Governor has had to focus increasingly on the Bank’s various regulatory roles).

There is a public sector culture of generalist managers.  I’m not sure it serves particularly well.  Of course, Grant Spencer also had a background in macroeconomics but had also served as the Bank’s Head of Financial Markets, and then had almost 10 years in various relatively senior roles at ANZ in New Zealand and Australia.   It wasn’t doing credit –  perhaps the essence of banking –  but it was much more of an exposure than Bascand has had (and the Head of Financial Stability job is itself much bigger than it was when Spencer was first appointed to it).  Sure, Bascand has sat around the internal committees on regulatory issues for the last three or four years, but it really isn’t that much depth of involvement.  And I say this even though, when I also sat on those committees, Bascand’s was often more willing to challenge and questions the interventionist inclinations of staff than many of his colleagues were.  I welcomed that.

Perhaps he is the single best person in the country (or abroad) for the role.  And there is something to be said, in high-performing organisations, for promoting from within.  But the appointment has an uncomfortable feel about it, including the dimensions of Wheeler either trying to box in his successors, or give Bascand another leg up in the succession stakes.

And there is also the uncomfortable fact that, for someone soon to be charged with oversight and regulation of much of our financial system –  regulating in the interests of the wider economy, not that of the banks –  Bascand doesn’t exactly have a spotless track record.   Defensive behaviour and an attempt to close down issues, rather than open them up, seems to be his style.  There was his attempt to tar the whistleblower –  me –  last year when I alerted the Bank to what turned out to be a leak of an OCR decision and a systematic weakness in their processes.  There was the seeming inability to distinguish between his (and others) role as trustee and as Bank employee –  particular worrying to the Bank I’d have thought if a financial sector employee had a similar cavalier attitude.  There was the attempt to close down, without substantive inquiry, significant complaints from a member of the Reserve Bank superannuation fund, only to find later that a breach of the law had occurred (and various other –  still ongoing – issues identified), for which breach trustees later had to apologise to members.  And, meetings with fellow regulators might be interesting, given that there is an outstanding complaint with the Financial Markets Authority –  regulatory body responsible for superannuation schemes –  around the decisions and processes adopted by the superannuation scheme trustees under Geoff’s chairmanship.

I know we don’t have depositor protection as one of the statutory elements in New Zealand’s banking regulation, but whether as a depositor or citizen I’m not sure this sort of track record would fill me with confidence in Bascand’s ability to lead financial regulatory functions, with the drive and willingness to leave no stone unturned that, in some circumstances would surely be required.  Bankers will often be keen to close things down quickly, and paper over problems.  The last thing we need is officials who will be content, or perhaps even complicit, in letting that happen.    At very least, this was a decision the new Governor should have been left to make.


The little engine that could…and other fairy tales

“I think I can.  I …..think ….I…. can, I………… think……… I…………… can” said the little blue engine”

It was almost to the top.

“I——-think”

It was at the top.

“I ———can.”

It passed over the top of the hill and began crawling down the opposite slope.

‘I ——think——- I—— can——I—– thought——I——-could I—– thought—– I—– could. I thought I could. I thought I could.¨ I thought I could.”

And singing its triumph, it rushed on down toward the valley.

“The Little Engine That Could” is a heartwarming childhood tale, about hard work and a willingness to give anything a go.    Perhaps the Prime Minister once read the story to his kids.  But…….it is a story.   Technical capacity, not willpower, determines whether engines can pull loads, get over hills etc.   However, the Prime Minister now appears to have adopted the storybook as the basis for his latest, rather desperate, defence of his government’s immigration policy.

At his post-Cabinet press conference on Monday, the Prime Minister appeared to be –  as NBR put it –  practising his election lines.

Answering questions about New Zealand’s capacity to handle current levels of population growth caused, in part, by very high net migration, English appeared to practice attack lines for the forthcoming election campaign, saying he believed the ability to cope with these challenges was “going to be a key issue in the campaign”.

“We believe New Zealand can adjust to be a growing economy with a growing population,” he said. “Our political opponents think New Zealand isn’t up to it, it’s too hard and the solution is to shut down the growth by closing off international investment, getting out of international trade, closing down migration and settling for a kind of grey, low-growth mediocrity where the best thinking of the early (19)80s sets our political direction.”

and, from another account (which I will draw on but can’t link to)

English said that National unashamedly believes in New Zealand’s capacity to be a growing economy and that its political opponents unashamedly think New Zealand is not up to it.

Belief is one thing.  Evidence is (much) better.    Winning elections might be a different matter, but whether, and to what extent, large-scale immigration is providing long-term economic benefits to New Zealanders isn’t something to be determined by whose swagger is most convincing; who can put on the most macho stance, or who is most ready to kick sand in the face of the weedy doubters.  Wishing for benefits won’t make them happen.   Instead, it is a matter of calm balanced analysis and an assessment of the evidence of New Zealand’s experience.  We’ve had plenty of experience.   And that must be a point of some difficulty for defenders of the current large-scale non-citizen immigration policy, presumably including the Prime Minister.

After all, 100 years ago, on the best available measures, New Zealand had among the very highest material living standards anywhere.   Some combination of abundant land, a temperate climate, dramatic reductions in transport costs, and refrigerated shipping had required more people to take advantage of the new opportunities, and enabled just over 1 million people to flourish in what was, by international standards, a highly-productive economy.  There were new opportunities here, and it took new people to take earliest and greatest advantage of them.

On some measures, even as late as around 1950 we still had some of the highest material living standards around.  There hadn’t been many more new opportunities specific to New Zealand in the previous few decades.  But, on the other hand, we’d avoided wars and revolutions at home.  It wasn’t much of a surprise that we were still wealthier than almost anywhere in continental Europe.

But mostly since then we’ve been slipping down the rankings, whether measured by productivity (the better measures) or average per capita income (which can always be boosted by working ever more hours).   After World War Two, large scale immigration, actively promoted by successive governments resumed.  Even then, leading New Zealand economists were sceptical.   All manner of arguments were run for actively pursuing increased population.  There were defence arguments, there were arguments about redistributing Britain’s excess population to the land-rich Dominions, there was the apparently-reasonable argument that opportunities and incomes were just better here.

But whatever the arguments, any economic gains just seemed to keep failing to show up.  Of course, we did lots of daft things during the post-war decades.  Trade protection meant that, for example, in the early 1960s we had twenty television factories in New Zealand, and we made or assembled here all sorts of stuff that would never have passed a market test.  In the late 70s and early 80s we poured money down the drain in the absurdly expensive energy Think Big projects (while being spared Roger Douglas’s ambition for 16 state-promoted carpet factories).   But strip all that stuff away –  as we did –  and we’ve still done badly.

Productivity growth lagged that in other advanced economies in the 1950s and 60s.  Since 1970, data suggest that among advanced economies only Switzerland and, perhaps Mexico, have done worse than us.  And even since all the reforms of the late 80s and early 90s, we’ve still brought up the rear when it comes to productivity growth.  On average, we just keep slipping further behind those other advanced countries we were once so much better off than.

My friends on the right will emphasise how high taxes are, how much wasteful government spending there is, and how pervasive poor-quality regulation is.  And I have a great deal of sympathy with many of their individual points.   But the median OECD country isn’t really any better or worse than us on those scores (on some we do rather better than the median, on others quite a lot worse).   We could all do better, but the explanation for New Zealand’s continuing disappointing performance simply can’t rest in those traditional pro-market verities.

A much more plausible story is one that recognises that New Zealand’s wealth was largely built on able people, and good institutions, making the most of our natural resources.    It shouldn’t really be controversial; you can see it in our trade data.    As it always was, so it is today – the overwhelming bulk of our exports are the fruits of the land or sea (and I’ll count tourism in those numbers, since that it mostly what tourists come for).   Of course, there is small number of successful outward-oriented firms in quite different industries, but strip away the subsidised ones (export education and the film industry) and the numbers are really pretty small.

And not only are no new natural resources being made, but in New Zealand for many decades there hasn’t even been any really large new discoveries of usable natural resources that were hitherto unrecognised (or idiosyncratic shocks that strongly favoured New Zealand production from natural resources).  It is, surely, the big difference between the post World War Two experiences of New Zealand on the one hand, and Australia and Norway on the other.  The prosperity of all three countries rests largely on the natural resource products their able people, with good institutions, can sell to the rest of the world.  Norway and Australia were able to bring to market whole new resources that, while always there, were previously unknown or uneconomic to tap.  New Zealand has had nothing similar.  No new land, no new sea and –  so far –  oil/gas and mining activities that are of fairly peripheral scale.    If we’d known that difference 50 or 60 years ago, few people (if anyone) would have thought it would make a lot of sense to import lots more people to New Zealand.   Combining many more people with a key fixed factor (“land”) is simply a recipe for making it much more difficult than necessary to support top-notch living standards for the people who were already there.    And that is so even if one can get lots of productivity growth in the land-based sectors.

Of course, the standard pushback is along the lines of “but that is all old economy stuff; ideas and new technologies are the way of the future, and one can develop those industries anywhere –  all that matters is the people, the people, the people”.  Which would be fine, but the evidence seems to be against it.  When it comes making physical stuff, global value chains have become ever more important, and it is really hard for many firms located at the end of the earth to be part of such value-chains (whereas it is quite easy if you are in Slovakia or Korea).  And when it comes to ideas-based industries, counter-intuitive as it might seem, personal connections and proximity (to suppliers, markets, specialist resources, clusters of knowledge) seems to have become more important than ever.    All sorts of firms can be set up by people in New Zealand –  or in Patagonia, Port Stanley, or Windhoek.  But those firms, and those people, will usually command more value relocated nearer those global centres –  be they in Europe, North America or East Asia.   Wishing it was otherwise –  like believing I can fly –  simply doesn’t make it so.

New Zealand’s strength is its people, among the most skilled in the world, its institutions (absence of much corruption, rule of law etc) and its natural resources.    The latter are crucial –  that isn’t something of ideology, or old-school thinking, but of hard numbers –  and are, for practical purposes largely fixed.  (Add in our (self-chosen) climate change objectives and those natural resource opportunities could almost be argued to be shrinking.) But our disadvantage, and it is a severe one, is distance/location, and at least before teleportation is mastered, that disadvantage isn’t changing –  it is a land so remote that until perhaps 200 years ago, there simply was no foreign trade.

Against that backdrop, it is simply crazy to keep letting the central planners (politicians and bureaucrats) try to drive up the population.   New Zealanders know it in their own choices.   There is nothing shameful about a fairly flat population, whether in a country – plenty of rich European countries have had them for decades –  or a city.  But it seems almost heretical in New Zealand.  It makes sense that cities, or countries, grow when new opportunities abound.  The evidence to date strongly suggests they aren’t abundant here.   Some might think that a shame –  in some ways I do too –  but believing otherwise doesn’t make it happen.

Is there 100 per cent conclusive evidence?  No, in this life there hardly ever is.  But lets look at some of the straws in the wind:

  • among the very worst productivity growth in the OECD throughout the post World War Two period,
  • an export share of GDP that has stagnated and even gone backwards (in a country that once had among the very largest per capita exports anywhere),
  • a major city that has incredibly rapid population growth over decades, and yet of which even Treasury now observes “we are not seeing the agglomeration effects we would expect from Auckland’s size and scale.”

I’m for evidence-based policy.  If we’d seen more and more New Zealand firms successfully establishing themselves in international markets, and the export share of New Zealand’s GDP rising (as it typically does in successful catch-up economies), if we’d seen a decade of productivity growth materially outstripping that of the other OECD countries so that we were finally catching up, if we are seeing evidence that GDP per growth in Auckland was consistently far-outstripping that in the rest of the country (as we find in many other countries centred on knowledge-based industries) then (a) we could all celebrate, and (b) it might make sense to think about whether we should open our doors to lots of migrants.   As it is, we see none of those things.  And that with one of the largest (per capita) legal immigration programmes anywhere in the world.   It is madness; ideology (“big New Zealand” more than theoretical arguments typically) over experience.

But the Prime Minister and the National Party still “believe” apparently.  Perhaps they could show us their evidence?

I don’t like to make too much of the last few years’ experience.  Apart from anything else, data revisions could mean that stories that look good today eventually disappear like the morning mist.     But, for what it is worth, the last few years don’t do much to instill confidence.

There is the dysfunctional housing and land supply market for example.  Sure, you can argue that it really has nothing to do with immigration policy, but if you can’t or won’t fix up the land supply market –  and neither this government nor its predecessors have –  don’t give us the nonsense that New Zealand can cope with his immigration policy.   Even if there aren’t large productivity costs from those land-use restrictions (I’m open-minded on that in New Zealand) the distortion to real house prices, that makes purchasing a home more and more difficult in our cities is a standing reproach to our leaders.

And then there is productivity.  I’ve repeatedly showed charts of real GDP per hour worked in New Zealand, where the data suggest we’ve had no growth at all in the last five years (even though the dogma suggests large immigration should be generating positive productivity spillovers).  It is often hard to get timely cross-country comparisons, but earlier this month the Conference Board released their latest annual estimates of real GDP per hour worked.    Here is how New Zealand has compared over the last five years (2011 to 2016) with a sample of 40 or so other advanced countries (the group I often use –  EU members, OECD members, plus Singapore and Taiwan).

2011 to 2016 growth in real gdp phw

And it isn’t just because those other countries were recovering from deeper recessions.  Our labour productivity growth also lags behind the median of these countries for the whole period since 2007 (just before the recession).  It is just the same old story of underperformance.   Are there mitigating factors?  Probably always to some extent.   The Canterbury rebuild inevitably dragged resources away from other uses.  On the other hand, relative to our worst decade of economic underperformance –  the 1970s –  the terms of trade have mostly been pretty good this decade.

With the export share of GDP drifting further backwards, it looks more and more like an economy that exists on building for each other.  Nothing wrong with that in one sense –  people need houses, offices, roads etc –  but it isn’t how economies successfully catch-up with those richer and more productive than them.  That typically involves finding more and better things to successfully take to world markets.

In his post-Cabinet news conference, the Prime Minister was also making much of the contribution to the net migration numbers of the decline in the outflow of New Zealanders to Australia.    That, he claimed. “was a vote of confidence in New Zealand”.   Perhaps it sounds good politically to say it, but lets face reality.  New Zealanders have gone to Australia is fewer numbers mostly because the Australian labour market is tough – the unemployment rate and underemployment rates linger high, and there is increasing awareness of how much on their own New Zealanders are in Australia if things don’t work out well.     And even though the labour market is tough, look at Australia’s productivity growth (from a much higher starting point) relative to ours in the previous chart.  It isn’t so much a vote of confidence, as an unexpected loss of an escape valve.   That makes things even tougher for New Zealand, especially when the government keeps on bringing in much the same number of non-New Zealanders as ever.   In the short-term it gives the economy a boost –  demand effects exceed supply effects in the short-term –  but in the longer-term it just keeps worsening New Zealand’s relative performance on the sorts of economic measures that matter.

The Prime Minister was also at pains to stress that he believed New Zealand –  government and private sector – could and would invest enough to handle the rapid growth in the population.  The evidence has long been against him on that one.  Despite having had one of the faster population growth rates in the OECD, we’ve long had one of the lower rates of business investment among OECD countries.   In a well-functioning economy with high productivity growth etc you’d expect it to be the other way round –  more people should need more investment, of all sorts.

My arguments are generally specifically focused on New Zealand –  opportunities in Ireland or Belgium may well be different than in, say, New Zealand, Tasmania or Nebraska.   But for what it is worth, here is a scatter plot, using IMF data, of population growth rates and investment as a share of GDP for the countries the IMF classifies as advanced.  I’ve used data since 1995, simply because that is the period for which the IMF has data for all countries.   Recall that one really should expect investment as a share of GDP to be higher in countries with faster population growth than in those with lower population growth, all else equal.

But

IMF scatter plot

There is almost no relationship at all – and certainly not the expected upward-sloping line.  If anything, the relationship is slightly negative.  And New Zealand –  the red dot above 30 on the horizontal axis –  doesn’t stand out from the pack.  Since people do have to live somewhere, it looks a lot like rapid increases in population tend to crowd out (rather more price sensitive) business investment.    Perhaps it isn’t surprising then that many of the advanced countries with the strongest growth rates in productivity also have flat, or even falling, populations?  But, whatever the wider story, there isn’t much reason in the international data to believe the Prime Minister’s wishful thinking that enough will be invested and all will be fine.  And when your country already has some of highest real interest rates, and a persistently overvalued exchange rate, it is probably safer to believe that all won’t be just fine.

I could go one, but I just wanted to make two final brief points:

  • in his comments quoted earlier the Prime Minister suggested that somehow the alternative to continuing very high immigration targets involved “settling for a kind of grey, low-growth mediocrity where the best thinking of the early (19)80s sets our political direction”.   Personally, I’d say the very best thinking from the early 80s –  that of reformers at Treasury and Reserve Bank for example –  was very much to the point.  But even setting that to one side, the Prime Minister’s attempted slur might well rebound.  I checked out productivity growth for the nine years to 2016, compared to the nine years to 1984.  In those 9 years of Sir Robert Muldoon’s stewardship, growth in real GDP per hour worked was (according to the OECD) 9.0 per cent.   Not great.  But on the Treasury’s preferred measure of real GDP per hour worked (and even correcting for the break in the series last year), productivity growth from 2007 to 2016, totalled about 5.5 per cent.    The Prime Minister was Minister of Finance for most of that period.   (Yes, sure there were plenty of other imbalances, bad choices etc then, as well as terrible terms of trade….but they still achieved faster productivity growth).
  • I could commend to the Prime Minister a column in The Australian yesterday from Australian labour economist Judith Sloan (there are extracts and commentary on it here).   Notwithstanding Australia’s stronger productivity growth, and overall higher incomes, she slams the Australian government’s substantial immigration target (just slightly smaller, in per capita terms, than New Zealand’s), noting in particular the ‘cynical charade’ in professing concern about house prices while doing nothing about immigration (land supply –  a major problem in Australia too –  isn’t under federal government law).  Sloan isn’t just any economist.  She led the Australian Productivity Commission 2006 inquiry into Australian immigration.  And in many respects, she is about as “right-wing” as they come (to the extent such slogans have meaning), so much so that she was nominated by ACT and the Business Roundtable, and then appointed by the government, to serve on our own 2025 Taskforce a few years ago, where she was instrumental in ensuring that that Taskforce did not champion New Zealand’s immigration policy.   She doesn’t write about New Zealand these days, but it would be surprising if her conclusions about our policy were les stridently expressed than those about Australia’s

The Prime Minister can “believe” all he wants. He can attack Opposition parties all he wants (and we have yet to see specifics of what either Labour or NZ First propose), he can diss a former leading figure of the business and economic establishment, Kerry McDonald, he can ignore the counsel of someone as able in this area as Judith Sloan.  But what he seems unable to do is offer any evidence that his immigration is, or ever will, work for the benefit of New Zealanders.

Treasury on immigration, productivity and real wages

I’m still under the weather with the after effects of a bad cold, so this won’t be a long post.

Treausry has long been a champion of New Zealand’s large scale non-citizen immigration programme, going all the way back to when the system was opened up in the earlier 1990s.   But more recently, there have signs of some differences of view even within the organisation.  in 2014, they published (consultant) Julie Fry’s working paper on migration and macroeconomic performance in New Zealand, which was a pretty sceptical, but careful, assessment of whether there had been any material gains to New Zealanders.  Fry’s conclusion was that any gains had been “modest”.     There was, I gather, quite a difference of view within the organisation as to whether the paper should even be published.

Treasury has also been on record as having some concerns about possible adverse labour market outcomes for lower-skilled New Zealanders from, for example, the big increase in the number of working holiday schemes New Zealand has signed up to.  They noted, in a presentation released last year,

Our key judgment is that migrant labour is increasingly likely to be a substitute for local low -skill labour, and this is an impact that we should try and mitigate.

But they have remain upbeat about the potential contribution from genuinely highly-skilled immigrants.

And at the top of the organisation, the public view on New Zealand’s immigration from the Secretary to the Treasury, in a succession of speeches and interviews, has been relentlessly positive –  and equally relentlessly devoid of evidence.

In the Treasury’s Long-Term Fiscal Statement released late last year they were apparently torn between creedal statements, and a grudging engagement with the evidence, notably a recognition that “we are not seeing the agglomeration effects we would expect from Auckland’s size and scale”.

So I was interested to see that in the Budget Economic and Fiscal Update last week, Treasury looked at a scenario in which the overall net migration inflows stay even larger for longer than Treasury’s central projection.   As it is, their central projection numbers are already high: after growth in working age population of 2.4 per cent in the year to June 2016, they expect to have seen growth of 2.7 per cent in the year to this June, and 2.4 and 2.1 per cent increases for the next two years.

The scenario is as follows

This scenario illustrates the impact of higher migration on the economic and fiscal outlook when capacity constraints arise. In this scenario, net migration is assumed to remain around its current level of 70,000 per annum through to the end of the forecast period.

The results include

In this scenario, stronger population growth drives faster growth in household consumption, residential investment and business investment. Stronger domestic demand is reflected in faster employment growth. However, in the construction sector, it becomes increasingly difficult to access labour and materials. As a consequence, there is additional upward price pressure on construction costs, which leads to higher headline inflation. The policy interest rate rises earlier and the exchange rate is higher as monetary policy seeks to stabilise inflation.

So far, so conventional in many ways.  This is the standard experience in New Zealand when there are large migration inflows.  There is nothing here of the lines the Reserve Bank has been running for the last year or so, in which increased net migration somehow eases overall inflation pressures.

But what really caught my eye was the next sentence

Reflecting these conditions, growth in labour productivity, real wages and real GDP per capita is more moderate than in the main forecast.

They didn’t need to include that observation at all.  The scenario would have made perfect sense without it.  But here is the government’s premier economic advisory telling them –  and us –  that if net migration remains at current levels it would be expected to have detrimental effects on productivity (and wages).      I wonder what the Secretary to the Treasury makes of that?

After all, it is not as if there has been much productivity growth for the last few years.  Treasury uses a measure of GDP per hour worked that simply uses production GDP (I usually use an average of the two GDP measures in charts here).  Here is what their measure looks like.

tsy productivity measure

No growth in labour productivity at all for the last five years (the last year’s drop is largely just a series break in the HLFS hours worked, consequent on survey question changes).

Perhaps coincidentally, that happens to have been the period over which we’ve had big increases in, and persistent very high levels of, net PLT migration (much of it a reduction in the annual outflow of New Zealanders).    And, as I noted, the other day, on Treasury’s own estimates, there have been no economywide capacity constraints at play in that period –  the output gap is estimated to have been (and still to be) negative.  For enthusiasts for large scale migration, it should have been a good time for seeing lots of productivity growth.

For some reason, in their central forecasts Treasury expects quite an increase in productivity growth from about now.  They never explain what (about the economy or policy) is changing that will end now the run of five years of zero productivity growth.  These are their central forecasts (on page 6 here) for labour productivity growth.

Forecast annual growth in labour productivity,

June years

2018 1.3
2019 1.9
2020 1.1
2021 1.1

Perhaps as puzzling, are their real wage forecasts.  Even though Treasury expects the unemployment rate to fall, and the rate of productivity growth to accelerate, these are the real wage growth forecasts.

Forecast annual growth in real wages, June years
2017 (est) 0.0
2018 0.7
2019 0.6
2020 0.0
2021 0.0

Five years and a forecast growth in total real wages of  only 1.3 per cent.  It is enough to make one glad not to be in the paid workforce.   Workers will surely be hoping that Treasury’s alternative immigration scenario –  with those adverse productivity and real wage effects they talked about –  don’t come to pass.    (And I am a little surprised that no Opposition party seems to have pointed out how bleak the outlook for workers’ incomes is under the central Treasury forecasts.)

It would be interesting to have an updated honest and considered assessment from Treasury as to what our immigration policy is doing for New Zealanders.  I suspect there is still a tension between the textbooks and the “ideology”, and the growing accumulation of reasons to doubt that, in these remote islands, in an age when personal connections matter more than ever, simply piling up more people here –  many of the newcomers not even being that highly-skilled –  is making us better off, not worse off.   It is a strategy that is great for owners of business in the non-tradables sectors –  more people means more demand –  but not for the economy as a whole.  Our living standards depend heavily on the ability of firms here to find ever more ways of successfully selling stuff to the rest of the world.  That simply hasn’t been happening on anything like the necessary scale, and the absence of aggregate productivity growth is just one reflection of that.