Rebalancing the economy was a big theme when the current government came to office.
In a brief post on Friday afternoon, I looked back to Bill English’s 2009 Budget speech, shortly after the current government had taken office, and compared his complaints then about the weak export performance in recent years, with the record over the term of the current government.
Of course, exports weren’t the only indicator the then Minister made quite a bit of in his early speeches. I found three such speeches, the 2009 Budget speech, a speech in October 2009 to the Institute of Chartered Accountants (the link to which was working on Friday but not this morning), and the 2010 Budget speech.
There was also a concern about productivity. In the 2009 Budget
Further, New Zealand’s productivity performance has been poor over the past decade. Ultimately, better productivity growth is the only way to create jobs and sustain high living standards.
And in the NZICA speech
“since 2003, our productivity has sunk to a 25-year low”
and the 2010 Budget referred to
“negative productivity growth between 2000 and 2009”
And there was concern about a lagging tradables sector. In the 2009 Budget
The common elements to each of these imbalances are excessive growth of the domestic and consumption sectors of the economy. Meanwhile there has been insufficient growth and investment in those parts of the economy that either export or compete with foreign producers.
To NZICA a few months later
…the tradables sector – that’s exporters or industries competing with imports – has actually been in recession for five years, contracting by about 10 per cent in that time.
Even more staggering, there have been almost no net jobs created in the tradeables side of the economy for the past 10 years. By contrast, the non-tradeables sector – domestic industries not competing with exports, including the Government – has grown by 15 per cent in the past five years.
And in the 2010 Budget
By contrast, output from exporters and import-competing industries had been in decline since 2005. These include sectors such as agriculture, horticulture, mining and resources, forestry, fishing, food manufacturing and tourism, all areas where New Zealand should be benefiting from its natural advantages.
And, of course, there was a lot about the shift from fiscal surpluses to fiscal deficits, and about the large current account deficits in the years immediately prior to the recession.
How then have things gone under the watch of the current government?
Before bombarding you with numbers and charts, I would stress that while most of these variables are influenced by government policy choices few are under the direct control of governments, almost all government policies work with a lag, many comparisons also ideally need to take account of what is going on elsewhere in the world, and so on. So while I will show various comparisons of how some of these economic indicators have done under the National government in the 1990s, the Labour-led government from 1999 to 2008, and the National-led government since then, using averages over the specific terms in office, no one is going to seriously claim that, say, Helen Clark or John Key coming to office in late 1999 or late 2008 materially altered economic performance in the subsequent quarter or two. The recession of 2008/09 would have happened, and been more or less as severe as it was, whenever in 2008 or 2009 a New Zealand election had been held. Fortunately, all three governments held office for prolonged periods, and the use of annual average growth rates also makes comparative growth rates at least a starting point for an informed comparison of the various governments. Events, good and ill, outside government control all complicate the matter. To take the current government’s terms as an example, earthquakes were a severe adverse shock, and on the other hand the terms of trade have averaged higher than for many decades. Neither was, in the slightest, something governments controlled.
What about exports? Here I’m using annual totals (so the first number is the average growth rate in total per capita annual export volumes from the year to December 1990 to the year to December 1999).
| Export volumes (per capita) – annual average growth rate (%) | |
| Bolger-Shipley government term | 4.7 |
| Clark government term | 2.1 |
| Key-English government term | 1.5 |
| 2007q4 to now | 1.1 |
I’d probably focus most on the final line – the growth rate since just before the recession – even though it doesn’t cleanly line up with one government or the other.
What about the relative performance of the tradables and non-tradables sector. I’ve used this indicator a lot, but, as I’ve noted previously, the then Minister had been quite keen on it. This was more or less the chart the Minister would have had in mind in mid 2009 (there have been subsequent data revisions, but they don’t affect the story much).
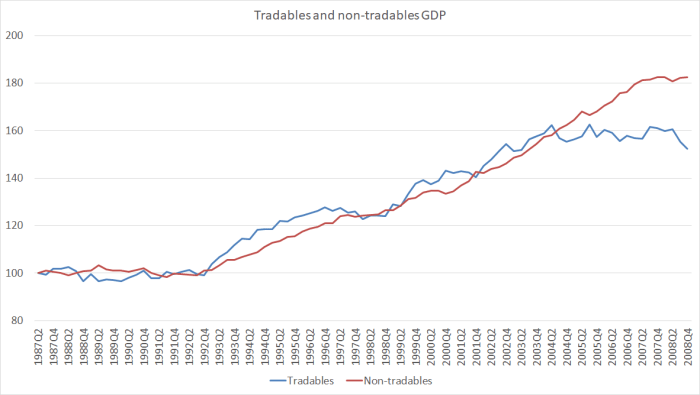
The dip in the blue line right at the end was the recession, but tradables sector output appeared to have been stagnating for some years.
And here is how the same chart appears now.
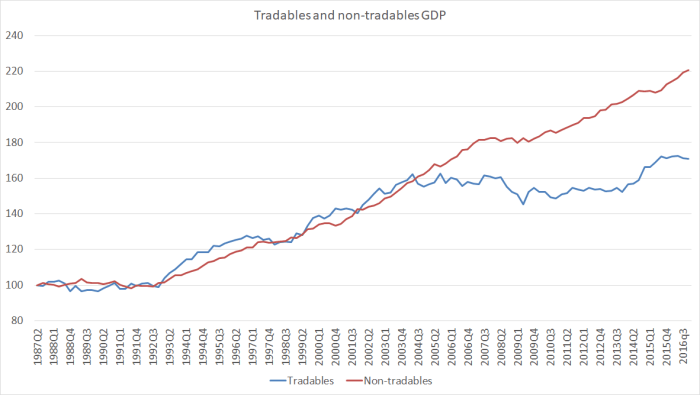
If you were worried about this indicator in mid 2009 (and not everyone was), things don’t look any better now (this is particularly apparent in the per capita version of this chart here ).
Here are the average annual per capita growth rates for the tradables and non-tradables GDP components.
| Tradables | Non-tradables | |
| Annual average per capita growth rate | ||
| Bolger-Shipley | 2.3 | 1.7 |
| Clark | -0.1 | 2.5 |
| Key-English | 1.4 | 1.1 |
| 2007q4 to now | -0.6 | 0.9 |
An impartial observer would suggest not much change under the current government. Tradables output appears to have grown faster, but that appears to be only because the government changed at the very bottom of the recession. Date the comparison from just prior to the recession, and performance on this indicator – which new Minister of Finance Bill English seemed to quite like – hasn’t been particularly encouraging.In those quotes I cited earlier, there was reference to employment growth in the tradables and non-tradables sector. There is no easy way I’m aware of to make that calculation, in a way that lines up with the split in the GDP numbers. I recall being involved in some discussions at the time about a possible tradables vs non-tradables employment indicator, but can’t now shed any further light.What about productivity?I’m not sure where the Minister got his numbers in 2009 supporting the claim that productivity growth had been negative in the previous few years. It may have been SNZ’s multi-factor productivity indicator (for the “measured sector”.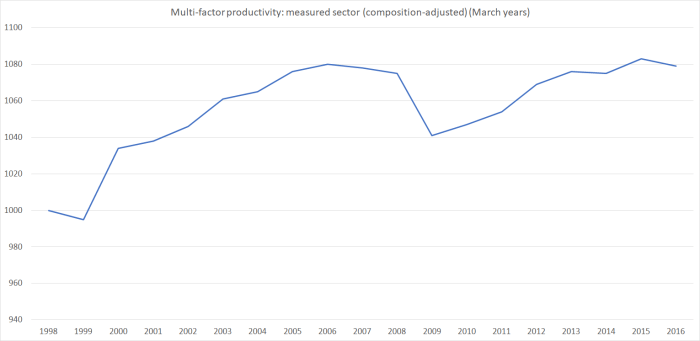 MFP measures are quite cyclical – if plant lies idle in a recession measured MFP will fall – but unfortunately the latest observations are only around the same levels reached a decade ago. There was no MFP growth late in the previous boom. There has been none since.
Labour productivity measures are more widely cited. I tend to use (and do so here) GDP per hour worked calculated by averaging the two real GDP measures and dividing them by HLFS hours worked. Treasury uses a production GDP based measure. It doesn’t materially affect these comparisons (if anything, my measure is slightly more favourable over the last eight years).It would be remiss of me not to remind readers that global productivity growth has also been weak over the last decade, but as I’ve illustrated in various posts, New Zealand has continued do worse than the typical advanced country average over recent years, and our sharp productivity slowdown really seems to date from around 2012.Of course, there is another side of the picture. There is no doubt credit due for the effort that has gone in to close the fiscal deficit. In the course of that period, the government accounts have been buffeted, on the one hand by the impact of the earthquakes, and on the other by the record high average terms of trade New Zealand has been enjoying.Interestingly, for those who do want to emphasise the role of fiscal policy in exacerbating or easing pressure on the real exchange rate, here is a chart of government consumption spending (on actual goods and services, not just cash transfers) as a share of GDP.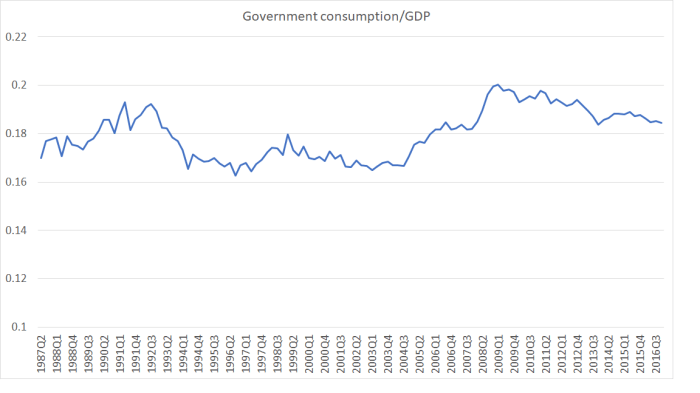
| Real GDP per hour worked | |
| Annual average growth rate | |
| Bolger-Shipley | 1.1 |
| Clark | 1.3 |
| Key-English | 0.6 |
| 2007q4 to now | 0.5 |
It is a certainly a smaller share of the economy than it was during the recession – that peak was a combination of rising government spending and the way that relatively stable government spending tends to rise as a share of GDP in every recession (you can see it even in the early 1990s). As of now, government consumption spending as a share of GDP is still almost two full percentage points higher than the share it averaged – under two different governments – from the mid 1990s to the mid 2000s. Whatever the merits of such spending, it won’t have facilitated any sort of rebalancing of the economy.
We now expect New Zealand governments to run balanced budgets, or even surpluses. All three governments since 1990 have. That is no small achievement, but there isn’t much to differentiate one government from the others.
What about the current account deficit? It certainly is smaller than we had experienced in the years running up to the recession – but those years look exceptional.

In fact, the current account deficit at present (2.7 per cent of GDP) isn’t much different from the average over the period 1988 to 2004 (3.1 per cent). And that despite two things largely outside New Zealand’s control:
- the interest rate on our quite large accumulated stock of foreign debt is much lower than it was (most of the debt is hedged back to NZD, and New Zealand short-term interest rates in the last four years of the boom averaged 6 per cent or more (the OCR peaked at 8.25 per cent). The OCR now is 1.75 per cent. The gap is smaller at longer maturities, but there was a quite unexpected windfall in the reduction in interest rates,
- the very high average level of the terms of trade (almost 10 per cent higher in the last three years than in the last years of the previous boom).
Another way of expressing the current account balance is the difference between savings and investment. Government investment as a share of GDP is now much as it was during the pre-recession boom years. Other investment – despite all the construction activiity – is not.
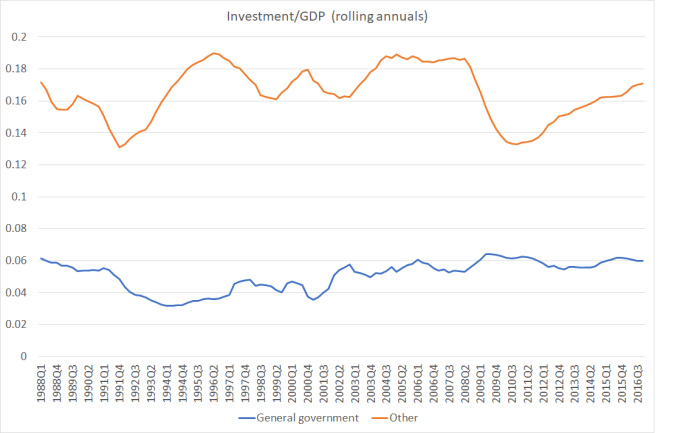
Despite all the population growth the non-government sector as a whole appears not to have been finding the scale of remunerative investment opportunities that they were voluntarily undertaking – wisely or not – in the pre-recession period. Not quite the sort of rebalancing that the 2009 Minister of Finance appeared to have in mind.
Perhaps the subdued investment isn’t too surprising given that, on Treasury’s estimates, New Zealand has had a negative output gap – unemployed excess resources – for getting on for 10 years now.
And what of saving? We don’t have a quarterly national savings series, but the other side of savings is spending – consumption. An earlier chart showed that government consumption was still running higher than we’d seen previously. Here is total consumption as a share of GDP.

The latest observation is just a little below the average of the history of the series (consistent with the annual national saving rate data, which is just slightly above the average of the history of the series).
What to make of all this? New Zealand’s productivity performance has been pretty poor, as has the overall performance of its tradable sector. Consistent with the continuing excess capacity, and perhaps with the weak productivity performance, non-housing private investment has remained pretty subdued, and that is reflected in the smaller current account deficit than we’d seen for some time. Economic outcomes are never fully the result of government choices. But as the current incumbents approach the voters a few months from now, on the sorts of indicators they incumbents were citing, with legitiimate concern, when they came to office, the story doesn’t look like a particularly favourable one, of corners turned, new and better trajectories set out on. And that without even mentioning house prices.

There are technical points in this article that are somewhat beyond me (my fault). In summary you appear to be saying the last 9 years have not been a great success and neither were the 9 years before that. As an intermittent observer of NZ politics I can’t remember any opposition party making a forceful case for a change in direction which would have improved these figures; as usual opposition parties have asked for more money to be spent on things like law and order, ecology, education, health, etc which although good in themselves would not have made the economy stronger or persuaded exporters to increase investment.
Is there be any truth in this assertion? When I worked in London during the early ’80s Kiwis on OE were taking low paid jobs (eg. an accountant working as a cycle messenger) so their OE was expected to be a break even financially whereas now they may be working abroad to earn the money needed to return to live contentedly in NZ. In other words incomes relative to other countries have declined.
Todays front page of the Herald’s Business news: “Golden days for primary sector”. So nothing to worry about.
LikeLike
Sorry if I wasn’t as clear as I might have been.
On what Opposition parties have promised, I think it is rather than both the incoming Labour govt (99)and the incoming National govt (08) talked of serious aspirations to something better. But, broadly speaking, neither did much of anything about it – bits of corporate welfare/subsidies (film industry etc) and not much else.
On your second para, I’m hesitant. My own experience of overseas jobs while youngish was that the money was a big part of the appeal even then. But house price inflation has become such a problem for the young that it wouldn’t surprise me if there was truth in your description. Having said that, my impression is that the UK in 1983 (when i started work) wasn’t seen as any sort of glamour destination. Over the subseqeunt 25 years, the UK economy did much better, but also wage differentials in the UK itself widened out dramatically, so that the highly paid opportunities were more available.
But my generation is well past OEs, and my kids’ generation are too young.
LikeLike
Ever since arriving in NZ 30 years ago, my early impression was that successive RB governors have been stricken with a ideology of high intervention and engineered recessions consistently obsessed with keeping interest rates higher than global averages and hellbent on destroying NZ industries.
LikeLike
FWIW I have a pet theory about where productivity comes from. It is expressed in a formula (1+ K) * (1 + IP) * (1 + B) * (1 + D).
K stands for capital, IP for IP, B for brand and D for distribution. So businesses which are strong on all 4 experience very high revenue per worker. I think this describes a lot of Fortune 500 companies and that is why the US is so wealthy. Obviously there are exceptions like the resource extraction, public sector and internally facing service companies but to my way of thinking it’s the large external-facing corporates that drive the overall productivity of a modern advanced economy.
LikeLike
Internet Protocol or Intellectual Property?
If Productivity is what Germany had and Britain lost after the war then is it honest determination?
LikeLike
USA Fortune 500 companies – they keep changing – is that the secret?
LikeLike
“economists exclusively look at only one half of the productivity equation( the denominator) — literally not figuratively. That impedes their ability to understand what is really going on with productivity in the modern economy.
The numerator is entirely ignored as if the value of the output was fixed and immutable. However, as any student of strategy knows very well, the dollar value-added that a firm generates is directly proportional to what it can charge in the marketplace for its products or services. And that price is, in turn, highly sensitive to the competitive dynamics of the firm’s industry and the strategic decisions it makes. Given the basic dynamics of a quotient, changes to the numerator are equally important to results as changes to the denominator.
Take Apple. An iPhone 6, with largely the same physical properties, sells for two times a HTC Desire because Apple has created a user experience and brand that causes consumers to pay whatever it decides to charge. As a result, Apple has sky-high productivity versus HTC — which is struggling to make ends meet in the smartphone business. It is simply and clearly a function of a strategic choices influencing the numerator, not the size of the denominator.”
https://hbr.org/2015/09/what-economists-get-wrong-about-measuring-productivity
LikeLike
Just off the cuff, wonder if NZ is having a muted private ‘balance sheet recession’: the household debt burden combined with low income growth is constraining consumption and dampening business investment activity. Still, and per comments, NZ does rate well re ease of doing business, institutional quality etc. so perhaps the distance issue matters more these days?? Take my hat off to anyone who believes in an idea, risks all to develop it and succeds internationally – maybe that process is also harder with all that has gone on in the world post crisis…..
LikeLiked by 1 person
I think there was an element of that (“balance sheet recession”) to the story, altho if it was the bulk of the story we should have seen a lower exchange rate and a rebalancing from domestic demand to external demand.
Re distance, yes I think there is good reason to think it matters more than it did (not just in the last 7 or 8 years) but over at least the last 25 years. As I’ve noted previously, the rise of global value chains – in which NZ firms are just too remote to participate much in many of – is an example of this. But so too is the pre-eminence of big cities – people clusfering in places like LOndon or San Francisco (even if housing supply restrictions to some extent impede that process).
LikeLike
Distance has not mattered to the 3.5 million tourists and the 125k international students spending $15 to $20 billion in the NZ economy which in turn has driven an expansion in the NZ domestic sector with almost a 100% spillover of that $20 billion into domestic GDP. That service based export GDP spillover into domestic GDP is definitely significantly more potent than the 30% spillover from Dairy, meat, wine, and other economic sectors into the local communities.
LikeLike
Can you please explain this
quote:- The 2010 Budget referred to “negative productivity growth between 2000 and 2009″
Ambiguous psycho-babble – shades of Neuro-Linguistic Programming
LikeLike
As i said in the post, I”m not sure what they were referring to, but it may have been the MFP numbers – so the chart in the post for one version of that sort of measure.
LikeLike
The economy has surely been rebalanced towards service based businesses associated with Tourism and international students. Previously a 50% decline in milk prices would have driven GDP negative but NZ continues to grow at 3% positive GDP in the face of a 50% decline in milk prices. That’s a massive shift in economic resilience.
There is nothing wrong with lower productivity and increasing population. It shows a successful community. Can’t see the joy of robots doing all the work and humans poor and with no work and no pay. I believe it is time we tax highly efficient and productive industries that have dehumanised their workplace with too many robots.
It is about time Labour Party acted on behalf of workers rights instead of spitting out all this nonsense about economic productivity. That’s the worst thing that could happen to any human workforce is the massive job losses and layoffs as AI robots replace humans.
LikeLike
And we should tax all the firms that adopted machines in the manufacturing process, rather than having people laboriously making things by hand?
(There has been a shift within the economy from one export sector to another, but overall there has been a shift away from internationally-oriented industries. And even exports of services are smaller, as a share of GDP, than they were 15 years ago – having been down and back up in the meantime).
LikeLike
What manufacturing is left in NZ is not really worth mentioning and even with robots no one manufactures in NZ any longer. The latest shutdown of course is the Cadbury Factory in Dunedin. Population is just too small to justify the investment in higher and higher productivity.
“The decision spells the end for some 350 jobs at the factory, which was a major employer in the South Island city, and Mondelez said it will support relocating as many as possible for roles in Australia and the region. The company plans to keep the Cadbury World tourism venture, which employs 36 people, and is considering redeveloping the site.”
http://www.nzherald.co.nz/business/news/article.cfm?c_id=3&objectid=11820102
Note that they are keeping the Cadbury tourism venture open. It is mainly the hand crafted human industry that has a high margin and a niche market that thrives in NZ, servicing tourists, jade and wood carvings, food and beverage products etc. Also the DIY industry keeping the old houses in tip top condition for sale to the 4% foreign buyers in NZ property. 4% foreign buying is equal to $3 billion in foreign cash injection each year.
But now we are talking about AI robots that basically replaces lawyers, computer programmers, accountants and we are seeing robot chefs, robot front desk reception, robot waiters etc. Sure does not leave much for us humans. Perhaps you should be worrying about whether the young one, even have a job to look forward to as a teacher when AI robots also start to do that job.
The problem with robots is they just return wealth to a few shareholders with higher and higher returns and higher productivity. There is very little in terms of trickle down to local GDP. Robots do not eat or sleep or drink beer or need any entertainment which humans do but we need to be paid to be able to do those things, therefore the logical next step is to tax AI robots as they replace human jobs.
LikeLike