Sources of inflation

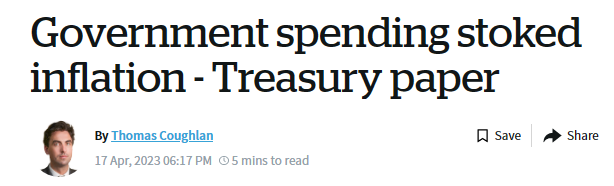
I was on Newstalk ZB this morning to talk about the ASB recession forecasts and this article on the Herald reporting some recent statistical analysis from Treasury staff that attempted to provide another perspective on what has caused New Zealand’s high inflation rate.

I don’t want to add anything on the ASB forecasts other than to say that (a) their story and numbers seem quite plausible, but (b) macroeconomic forecasting is a mug’s game with huge margins of uncertainty and error, so not much weight should be put on anyone’s specific forecast ever (with the possible exception of a central bank’s forecast, which may be no more accurate than anyone else’s but on which they may nonetheless act, with consequences for the rest of us).

The Treasury staff analysis was published a couple of weeks ago as a 2.5 pages Special Topic in their latest Fortnightly Economic Update. You can tell from the Herald headline why one of their political journalists might have latched onto this really rather geeky piece

But there is less to the analysis than the headline suggests. The term “government spending” doesn’t appear in the Treasury note at all (I think “fiscal policy” gets one mention). The focus of the paper is an attempt to better understand the relative contributions of demand and supply factors to explaining inflation, and while fiscal policy is one (at times significant) source of demand shocks and pressures, there is no effort in the paper to distinguish the relative roles of fiscal and monetary policy (or indeed, to distinguish either of those policy influences from other sources of demand pressures). That isn’t a criticism of the paper. The technique staff used, introduced for those purposes a few months ago by a Fed researcher (his paper is here), isn’t designed for that purpose.

Loosely speaking, the technique uses time series modelling techniques to look at both prices and volumes for (most of) the items included in the CPI. When there are surprises with the same sign for both a price and the corresponding volume that is (in their words) suggestive of a demand shock (increased demand tends to lift prices and volumes) and when the surprises have opposite signs this is taken as suggesting a supply shocks (disruptions in supply tend to see lower volumes and higher prices go together). It is a neat argument in principle.

But it doesn’t look to be a very good model in practice. Here is The Treasury’s summary chart. the source of the line that (on this analysis) demand and supply shocks may have contributed roughly equal amounts to inflation over the last year, and that demand shocks were more important back in the early stages of the surge).

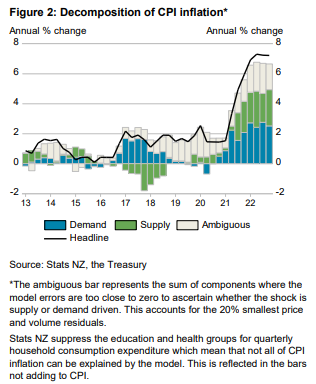
Not only is a large chunk of recent inflation not able to be ascribed to either demand or supply shocks, but there have been periods even in the quite short span shown here when the identified demand and supply shocks don’t explain any of the then-current inflation at all (eg 2019).

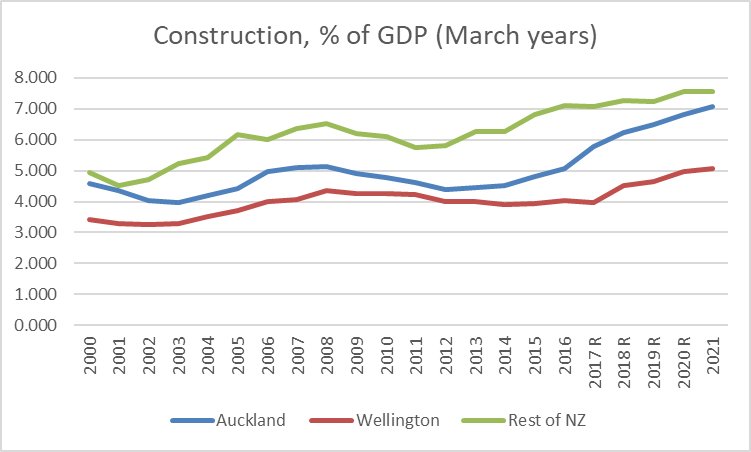
This is even more evident with some of the sub-groups they show results for. Thus, home ownership (which in the CPI is mostly construction costs)

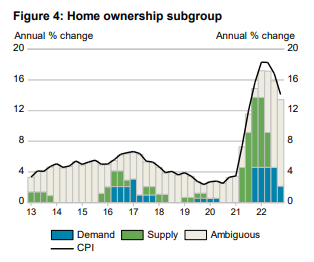
For most of the decade, neither (identified) demand or supply shocks explain the inflation, and that is so again in the most recent data. And if the model suggests that sharp rises in construction cost inflation in recent times have little to do with demand at a time when house-building has been running at the highest share of GDP in decades, so much the worse for the model.

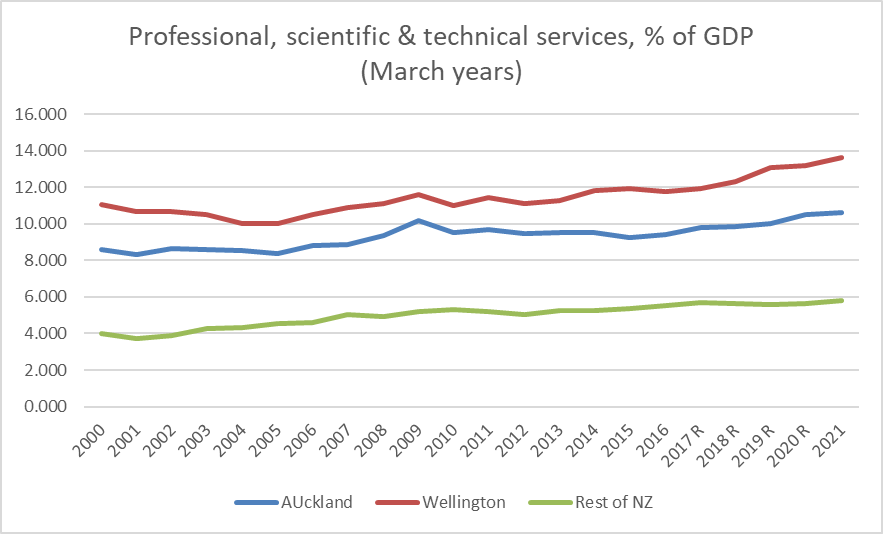
Services make up a large chunk of the economy, and a fair chunk of the CPI too. Here is the chart for that group

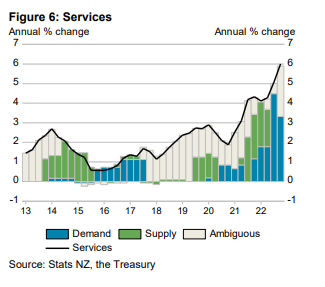
Not only are there periods when neither demand or supply shocks (as identified by the model) explain any of services inflation, but how much common-sense intuition is there is the idea (which the chart suggests) that for most of the period what services inflation can be explained is all either supply shocks or demand shocks and not some combination.

The Treasury paper notes some overseas comparisons, in particular that for the US

The results for New Zealand show lower supply-side contributions to inflation than estimates for the US and Australia. In the US, supply-side drivers account for about 60% of the annual change of the PCE deflator that the model can explain (Figure 7).4

(the footnote is to the original Fed paper)

and they show this US chart which I assume comes from the same model

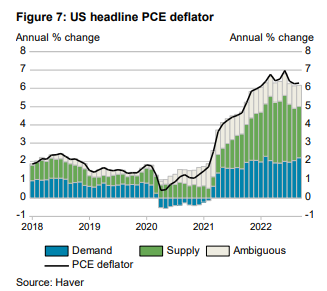
Note, first, that the PCE deflator has a materially different treatment of home ownership – using imputed rents – than either the NZ or US CPIs.

But perhaps more importantly, in the original Fed paper there is this line

And here is a relevant chart from the same paper (grey-ed periods are NBER recessions)

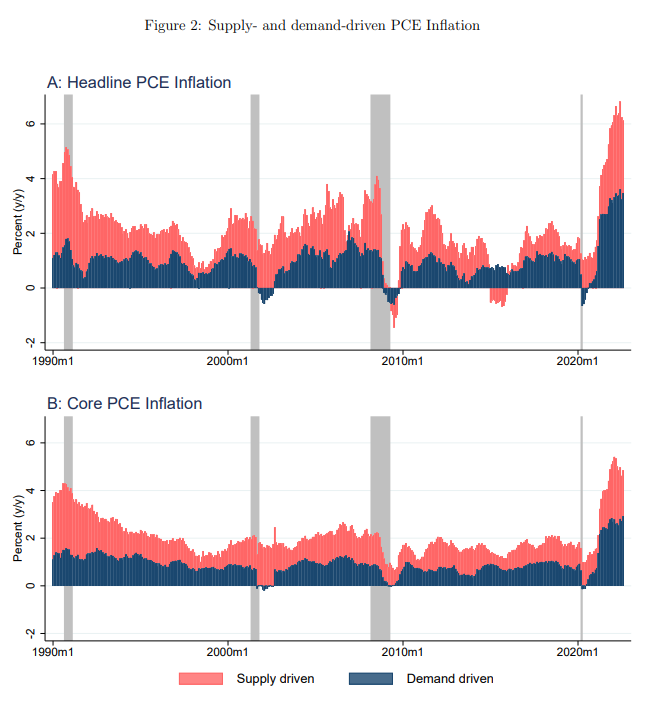
Not only does it show the entire period since 1990 (one of my uneases about the New Zealand work by Treasury is showing only the last 10 years), but it also illustrates that, as defined for the purposes of these models, both supply and demand factors are large influences, almost always positive, over the entire 30+ years. In other words, if there is anything unusual about the current situation it is not the relative contributions of supply and demand influences but simply that inflation is high (both demand and supply influence). It simply doesn’t seem to add much value in making sense of why things unfolded as they did over the last couple of years. (Although it is interesting how different the last 10 years of the chart look for the US, as opposed to New Zealand in the first chart above.)

What these US charts also illustrate is that supply and demand shocks/drivers here don’t mean the same as they typically do when thinking about monetary policy. Monetary policymakers will (rightly) talk in terms of generally wanting to “look through” supply shocks – the classic example being spikes in world oil prices, which not only flow through to the CPI almost instantly (faster than monetary policy could react) but also make us poorer. The focus instead is on whether these headline effects flow through into generalised inflation expectations and price-setting more broadly. Climate-induced temporary food price shocks (from storms or droughts) are seen in the same vein.

Those sorts of shocks are generally thought of as being as likely to be negative influences on headline inflation as positive ones. Oil prices go all over the place, up and down. Much the same goes for fruit and vegetable prices. These are the two main things excluded in that simplest of core inflation measures, ex food and energy. Some of the Covid-related disruptions are probably more one-sided: there aren’t really obvious favourable counterpoints to severe supply disruptions (even if such disruptions themselves generally unwind over time). But even taken altogether they aren’t the sorts of things that will produce positive influence on core inflation over single year for over 30 years (as in the US core inflation chart immediately above).

When macroeconomists think of inflation they often do so with a mental model in their heads in which this period’s inflation is a function of inflation expectations, some influence from the output/employment gap, and then any residual (supply shock) types of items. Those supply shocks can run in one direction for a couple of years in succession (and probably did in the last couple) but the expected value over long periods of time is generally thought to be pretty close to zero. Monetary policy determines core inflation – monetary policy shapes expectations and influences and responds to developments in the output (or employment) gap. Of course, monetary policy takes account of trend supply developments – adverse shocks may not only raise headline inflation, and risk raising inflation expectations, but can lower both actual and potential output (many positive supply shocks work in the opposite manner).

I don’t want to be particularly critical of The Treasury. We should welcome the fact that their analysts are trying out interesting different approaches and keeping an eye on emerging literature, and even that they are making available some of that work in generally low-profile publications. That said, Treasury is not some political babe in the woods, and I’d have thought there should have been some onus on them to have provided a bit more context and interpretation in their write-up. For example, whereas the US is often treated as a closed economy, New Zealand clearly isn’t. I don’t have a good sense as to how general imported inflation – or that reflecting exchange rate changes – is going to affect this sort of decomposition. If, as I believe, a wide range of central banks made very similar policy mistakes, we’ll be seeing more inflation from abroad (if our Reserve Bank takes no steps to counter it) not tied to demand pressures in particular domestic sectors. I’m also not really clear how the lift in inflation expectations that we observe in multiple surveys fits into this sort of decomposition exercise.

Oh, and it was perhaps convenient that of the CPI groups Treasury showed, motor fuels was not one of them. Headline inflation currently is held down quite a bit by the NZ Cabinet shock – holding down petrol excise taxes etc.

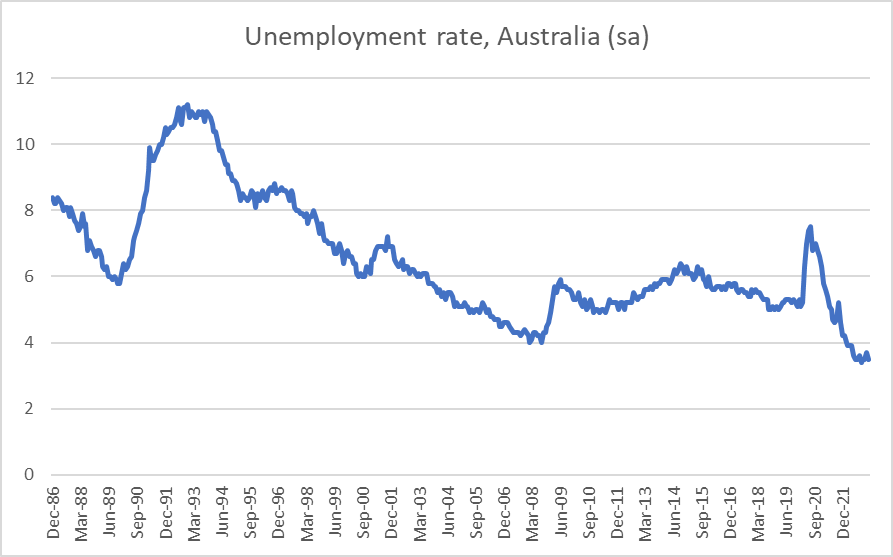
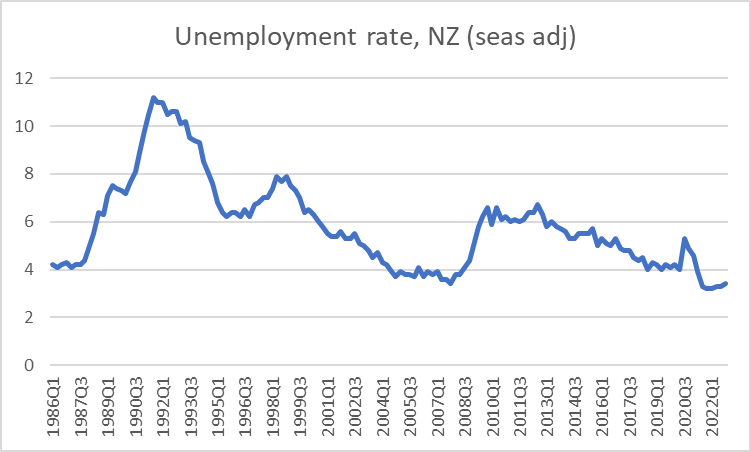
My own approach to the question of where the responsibility lies for core inflation (and note that Treasury focuses on headline not core) tends to be simpler. When this century the unemployment rate has dropped below about 4 per cent core inflation has tended to become quite a serious problem (mid-late 00s and now). The Reserve Bank itself has been quite clear in its view that employment is running above the “maximum sustainable employment” (itself determined by other government policies), and thus, by implication, the unemployment rate – at near-record lows is below sustainable levels. That is a function of excess demand relative to the ability of the economy to supply. Core inflation – the bits we should most worry about, because we could usefully do something about them – is an excess demand story, risking spilling over into embedded higher inflation expectations.

And when ZB’s interviewer asked me this morning whether Mr Robertson or Mr Orr was to blame (fiscal or monetary policy), I was quite clear that the answer was monetary policy (Orr and the MPC). That isn’t because monetary policy loosenings in 2020 were necessarily the biggest source of stimulus to demand, but because the model is one in which (a) fiscal policy is transparent, and (b) monetary policy moves last, with the responsibility to keep core inflation at/near target. You might think (I certainly do) that less should have been done with fiscal policy, but it isn’t up to the MPC to take a view on that, it is their job simply to have a good understanding of how the whole economy, and the inflation process in particular, works, and to adjust monetary policy accordingly. In extremis, fiscal policy can overwhelm the best efforts of central banks, but that wasn’t an issue or a risk here, or most other countries, in recent years. Central banks simply got things wrong. (They had company in their mistake, but they were/are paid to get these things right.)

Understanding LSAP losses

There was an article on Business Desk yesterday that led with the suggestion that the LSAP losses now totalled almost $20 billion.

As soon as the article appeared I emailed the author and pointed out that the two numbers she was using could not be added together and that the best estimate of the direct fiscal losses were still around $10 billion. We had a few email exchanges and a telephone conversation, by which point she accepted that her number was wrong, but didn’t fully understand why she was wrong (apparently several other journalists were also confused), and indicated that there would be a further article forthcoming, using quotes I (and others?) had provided. I didn’t have the time for anything in depth yesterday but suggested I might write a post today that attempted a fuller and more intuitive explanation.

Unfortunately I didn’t print off the original piece and the article online has now been changed. The original opening has been modified to remove the explicit $20 billion assertion (it is still in the heading but with a question mark) and this note has been added at the start.

As it stands, the article now begins

But it isn’t “before” it at all. Instead, the number labelled as the mark-to-market losses on the LSAP portfolio is just, in effect, a subset of the Treasury estimate referred to in the first paragraph.

Note that everything in this post, in Jenny Ruth’s article, and in the Treasury papers referred to, deals only with the direct fiscal losses to the taxpayer from the LSAP programme. It does not deal with any possible offsetting savings by lowering general Treasury issuance costs or with possible macroeconomic benefits (or costs), not because either of these might not be important, but simply because the issue at hand is about the direct fiscal costs only.

Jenny Ruth’s article drew on the Treasury paper to the Minister of Finance, dated 6 December 2022, which I discussed (together with a follow up note from the Reserve Bank) in this recent post on the idea of tiering returns on the current very large level of settlement cash balances. The paper itself is included in the huge recent OIA release from the Minister of Finance, hosted on Treasury’s website. So too is one other Treasury paper I will draw from.

Here is the $10.5 billion number from the Treasury paper Ruth draws on

Note that there is a footnote at the end of that sentence. Here is the footnote, some of which was withheld

This, on its own, really should have been enough to suggest to any reader that the two numbers were approximating to the same thing, and thus could not be added together. (All that said, this paper was about tiering and so did not go into any great depth on how the various LSAP loss numbers were derived.)

But here it is worth taking a step back.

For the last 18 months or more I have been banging on about the rising scale of the direct fiscal losses associated with the LSAP. To illustrate that point I regularly used, both here and on Twitter, a chart of the line item on the Reserve Bank’s monthly published balance sheet of the Bank’s claim under the Crown indemnity the Minister of Finance has given them for any LSAP losses. I used that because (a) it was available monthly, and it was an official number and (b) because, while there were no realisations (bonds sold off again) it was a reasonable best estimate (the market price) at the time of what the actual direct fiscal losses were.

But, as I have pointed out, and as The Treasury itself has frequently pointed out, the indemnity claim itself does not represent the cost to the wider Crown finances. The indemnity claim is just a transfer from the Treasury to the Reserve Bank. Had the indemnity not been given, the Reserve Bank could still have done the LSAP. Instead of a large claim on The Treasury for the indemnity it would instead be showing large losses itself and deeply negative equity (as is the situation with the RBA, which did large scale bond buying, without an indemnity). Either way, taxpayers are worse off but they are worse off because of the LSAP (and subsequent movement in market prices for bonds) not because of the indemnity. The Reserve Bank balance sheet is consolidated into the Crown accounts, and transfers among entities included in that consolidation don’t make us taxpayers any worse (or better) off. They are really just intra-group transfers.

It is also worth noting – as many early sceptics did in their responses – that if the LSAP bonds were to be held to maturity by the Reserve Bank no indemnity claim would have been payable at all. The market price of the bonds approaching matiruty would have tended towards the face value of the bonds.

But that is not the same as saying there would have been no direct fiscal losses from the decision to do the LSAP.

What matters in assessing the direct fiscal costs is not the flows between the Reserve Bank and the Treasury (intra-group transfers) but the flows between the government as a whole (here, Treasury and Reserve Bank combined) and the private sector. The LSAP changed the private sector’s lending to the government from bond holdings to settlement cash balances at the Reserve Bank. This is the story I’ve been telling for ages that the LSAP is just a big asset swap. Treasury says the same thing (from that same 6 December paper)

In what follows, I’m treating the Reseve Bank and Treasury as one consolidated entity (whole-of-Crown). In decision making terms it doesn’t work that way (the RB MPC made independent decisions to do the LSAP), but I think the substance may be clearer if I do.

Take a very simplified example in which these are the only transactions whole-of-Crown does:

Step 1

  • the government issues $50 billion of long-term bonds to the private sector to finance $50 billion of spending,
  • the net effect of those two transactions is no change to the level of settlement cash balances (spending boosts settlement cash, but issuing bonds drains those balances)
  • in this scenario, the government now has $50 billion of long-term debt outstanding and no extra (RB) settlement cash balances outstanding

Step 2 (the LSAP)

  • the Reserve Bank (branch of government) buys back the $50 billions of bonds on the open market,
  • paying for its purchases boosts the total level of settlement cash by the full purchase price (for simplicity, assume also $50 billion)
  • having done this, the government (whole of Crown) now has a) no long-term debt outstanding (one division might have issued the debt while another has repurchased it, but they net to zero) and (b) $50 billion of extra settlement cash liabilities outstanding.

The government could have financed that $50 billion at the market interest rate on the long-term bonds.  Instead, it is now financing itself with settlement cash balances (in economic substance, borrowing from banks) on which its Reserve Bank arm pays the full OCR interest rate, reviewed every six weeks or so.

The direct fiscal cost of the decision to do the LSAP is the difference in the debt servicing costs in these two scenarios (how much whole-of-Crown pays the private sector).   Transfers between the government and the Reserve Bank themselves don’t add to or subtract from those numbers at all.

When the LSAP was underway, the Reserve Bank was probably buying back the bonds at yields to maturity of around 1 per cent.   In other words, the Crown was giving up, say, 1 per cent fixed rate financing and replacing it with variable rate financing.  Had the OCR averaged below that (approximate) 1 per cent over the remaining life of the bonds, there would have been a net direct fiscal saving.   If that seemed unlikely even in 2020, it wasn’t impossible (for the first year or more the OCR was 0.25 per cent).

But it hasn’t happened (or, to be strictly accurate, since we do not know what disasters might lie just around the corner, it now seems most unlikely to happen).  The OCR is now 5.25 per cent.  From here, in its latest OCR review the Reserve Bank indicated it isn’t sure where the OCR will go next.   The market is looking towards rate cuts at some point, but the market does not expect anything like an average of 1 per cent or less.  There will, almost certainly, be substantial net direct fiscal costs from the LSAP programme.   

That number was what The Treasury was estimating (reporting in early December) at about $10.5 billion.  Bond yields, changing from day to day, encapsulate implicit market expectations of future short-term rates, including the future path of the OCR over the remaining life of the relevant bond.  Thus, the mark-to-market value of a bond position is going to approximate to the estimated net direct fiscal losses from a decision to purchase those bonds (as Treasury notes in the first quote above).  They are two ways of looking at the same thing, not different losses that can be added together.

Current market bond yields are a little below those at the end of October, so Treasury’s best estimate now of the net direct fiscal losses would probably be a little lower.   Since we don’t know exactly the date as at which they came up with the $10.5 billion or the precise details of their methodology we can’t be quite sure how much lower, but $10 billion or perhaps a touch below look to be about right.  Those estimates too will, in principle, change every day.

As Jenny Ruth’s article notes, the Reserve Bank balance sheet for 31 March will be published on Tuesday, and we will get an update on the Bank’s claim on the Treasury under the indemnity.   However, the claim under the indemnity no longer approximates the total expected net fiscal direct losses (or the Reserve Bank’s own losses).  That is (mostly) because some of the LSAP bonds have been sold (back to Treasury), under a steady announced monthly programme, crystallising some of the Reserve Bank’s losses, and triggering payments from the government to the Reserve Bank under the indemnity (some of the shorter-term bonds have also been held to maturity).   I am not aware of where we might find an up-to-date time series of these payments, but in that big Treasury OIA release there is a 24 November 2022 paper to the Minister of Finance on monthly indemnity payments.  It includes a table of actual indemnity payments to date

indemnity 1


and one of expected payments over the followng year (on market rates prevailing when the estimates were done)

indemnity 2

Jenny Ruth reported (correctly) the Bank’s outstanding indemnity claim as at the end of February of around $8.75bn. But to get the total Reserve Bank losses under the indemnity one would have to add to that (a) the $438 million of known indemnity payments already made, and (b) any other indemnity payments between November and February, estimated in the Treasury papers then at another $1.1bn or so. In other words, a total a bit over $10 billion. Note that the entire interest rate yield curve for medium to long term bonds is lower now than it was in Oct/Nov (or in February) so accurate estimates now would be a bit lower – probably a touch below $10 billion.

If I think back to yesterday’s conversation I think one issue that may be playing on people’s mind is “yes, we know about the settlement cash payments you describe, but…..surely there are still those mark to market losses showing on the RB balance sheet”.

And that is true, but if the Treasury were to engage in full mark to market accounting of the value of its debts (which few entities do, or are required to be accounting standards, but which is nonetheless the economic substance), what would have happened to the market value of the debt Treasury had issued? It would have increased massively – low interest outstandings are very valuable when the market rate is so much higher. In fact, the market value of the increased value of the Treasury’s liability in respect of the LSAP bonds would be equal to the reduced market value of the Reserve Bank’s holdings of those LSAP bonds. The two net out – reverting to my oversimplified scenario it is as if the whole-of-Crown no longer has that debt outstanding at all.

The indemnity (claim and payments) matters a lot to the Reserve Bank. It doesn’t much matter to us, or to the Treasury. We face whatever gains (or losses) the LSAP gives rise to whether or not there was an indemnity. The remaining claim – latest estimate out on Tuesday – is (from our perspective) little more than an intra-group memo item. But as taxpayers we don’t care much about either the RB or the Treasury finances individually, but about the consolidated financial position, which is what determines the losses we ultimately have to bear.

Finally, because some LSAP bonds are being held to maturity (and there are losses arising from them, albeit often smaller) there will never be a single government accounts line item capturing the full net direct fiscal costs of the LSAP programme.

I hope this post has made things a bit clearer. I’m happy to engage with anyone on the points in it, or any that are relevant that I may have missed.

UPDATE (17/4): Jenny Ruth’s follow-up story written on Friday is here. Note that this line she was given by Treasury is wrong or at best misleading.

If the Reserve Bank sold the LSAP bonds on-market that would certainly and automatically drain settlement cash levels. If the Reserve Bank sold the bonds back to the Treasury that transaction alone would not affect banks’ settlement account balances at all (it would just deplete the government’s account at the RB). The effect on settlement cash would arise only as and when the Treasury issued new bonds on-market to replenish the government’s account and (in effect) replace the bonds the RB had sold back to them.

It is a small point, but since the Treasury line is now on the public record and there is evident lack of clarity in some quarters about the LSAP issues it is worth being as clear as possible. As per the post above, transfers/flows between the RB and Treasurydo not directly affect banks or the wider public. For many purposes (but not all) there are just intra-group transfers among branches of whole-of-government.

Reading the regional GDP data

A few weeks ago SNZ published the annual regional GDP data. These data don’t tend to get much coverage, partly because of the (probably inevitable) long publication lags (the headline data are for the year to March 2022, the sectoral data by region for the year to March 2021) and partly because the numbers are for nominal GDP only. One might also have feared that Covid lockdown and border closure effects would further muddy anything that could be taken from the last couple of years of data.

But the data are worth persevering with, and there are all sorts of interesting snippets one can find.

First, here is how the regional shares of GDP have changed this century to date (the first data available are for the year to March 2000). Bay of Plenty’s share of total national GDP has increased from 5.2 per cent in 2000 to 6.0 per cent in the year to March 2022.

The high placings of Waikato and Bay of Plenty weren’t a surprise, but I hadn’t expected to see three South Island regional council areas in the top six places, or that the South Island’s share of the national economy has actually increased this century. Most of the laggards are in the bottom half of the North Island, perhaps most notably Wellington – an area not only sustained by government spending and employment, but with local authorities and related lobby groups who’d like you to believe that Wellington was some sort of cool tech hub, and thus well-positioned for the 21st century.

(Eyeballing the data, Covid didn’t seem to have affected the rankings materially – numbers to March 2022 being much the same as those to March 2020).

Wellington’s decline has been fairly unbroken

On the other hand, here are a couple of idiosyncratic stories: big temporary lifts for Taranaki (Tui oil) and Canterbury (earthquakes make you poorer but generate a lot of (gross) new activity in the repaid and rebuild phase).

What about population shares?

Here, a positive number means population in that region has grown faster than the national average (eg Auckland’s population has grown from 31.0 per cent of the total to 33.2 per cent). Almost all the above-average growth has been in the North Island, with some contribution from Tasman/Nelson, and Canterbury more or less holding its own. The bottom half of the North Island has again lagged behind. (At a regional council level, no area has had a fall in population over the century to date).

Of the bigger urban areas, Wellington has had the slowest rate of population growth (behind even Otago).

What of GDP per capita? The good news is that all the places that had GDP per capita above the national average in 2000 (Auckland, Wellington, Taranaki) were closer to the national average by 2022. and apart from Northland and Hawke’s Bay all the region with average GDP per capita in 2000 were at least a bit closer to average by 2022. Southland, which includes Queenstown, now has GDP per capita just a bit above the national average. Convergence…..it isn’t really that common these days. But it has happened here.

The biggest, by far, chunk of the population is in Auckland. Here is what has happened to average GDP per capita in Auckland this century relative to the national average.

My story on this data is that (a) it is quite heavily influenced by construction cycles (a smaller boom in the mid-00s and rising to record levels of construction now), but that (b) if anything the underlying trend is downwards. That second strand might seem a bold claim, but construction really has been at unprecedented levels in the last few years and GDP per capita relative to national average still isn’t back to 2000 levels. It will be fascinating to see what happens to this series over the next few years.

(More generally, and I have written on this before, the margin between GDP per capita in Auckland and the rest of the country is very small compared to what we see in almost all European countries’ biggest cities, and in places like New York and San Francisco in the US. All that talk of “one global city” etc simply isn’t reflected in the economic outcomes).

But if the Auckland story is underwhelming – not much sign of leading edge productivity growth etc – here is the same chart for Wellington

Yes, average GDP per capita is higher than in Auckland (now just), but look at the magnitude and sustained nature of the decline of the century. And a big chunk of Wellington’s GDP isn’t really subject to market tests.

The sectoral GDP data by region lag by a year and the latest data are for the March 2021 year. But here is a time series chart for a couple of key sectors, and one other.

Wellington has become more dependent on core government functions this century, and the category where you might expect to find all those high-tech industries (included the taxpayer subsidised film industry) has shrunk quite considerably as a share of regional GDP (almost as much of a shrinkage as in the share of manufacturing).

That tech-y looking sector has been shrinking as a share of GDP everywhere, and it is still a larger share in Wellington than in Auckland or the rest of the country, but it doesn’t seem like the sort of story the Wellington boosters would like to tell.

And if Wellington is more of a professional services sort of place than Auckland or the rest of New Zealand (lots of public sector consultancy services being sold?) nothing much about the experience this century stands out either.

And for those interested, here is the construction sector share of (nominal) GDP

There aren’t any big messages from this post (mostly just the fruit of fossicking in the data) except perhaps the continuation of the regional economic story of this century, the unbroken relative decline in Wellington – whether population, GDP, or GDP per capita, all accompanied by increasingly unaffordable housing, and all despite things like film subsidies and an increasing size of government. Without those twin subsidies, would Wellington have anything more going for it than Dunedin?

How much attention was paid to this?

I obviously haven’t seen, or read, the best advice expert commentators have been providing to their wholesale market clients over the last 24 hours but in what I have heard and read I’ve been struck by how little attention seems to have been paid in the more popular/accessible part of the market to this from the MPC’s statement (emphasis added). Looking at some of the changes in market prices, it isn’t clear how much weight markets have put on it.

Below, by contrast, are the “bias statements” (comments about what might happen next) from the OCR decisions back to August 2021. Yesterday’s statement – for all the gung-ho 50 basis point move – ends on a very different note. They seem genuinely open minded on whether the next move might be up or down, and whether any such move might be soon or far away. The MPC are no better at forecasting than anyone much else, but since they get to set rates what they think might happen next, and what they do next (whether with hindsight those are the right views or calls) matters. It is a curious change of direction, without a full set of forecasts, and with no real idea what has happened to inflation or unemployment more recently than as at mid-November. But a change of direction it appears to be.

The statutory provisions governing MPC members

Now that was a boring title wasn’t it?

There was a mistake in Monday’s post about the Reserve Bank’s MPC external member Caroline Saunders’ term (and I am grateful to Brad Olsen of Infometrics, on Twitter, for pointing me back in the right direction).

Saunders’ 4 year term, from 1 April 2019, expired last Friday. She is eligible to be appointed for one more term (the law sensibly limits external members to no more than two four-year terms) but she has not, it appears, been reappointed (by contrast, the other two externals were reappointed when their first terms expired this time last year).

As I noted in Monday’s post, the Minister of Finance has the ability to extend the term of an MPC member (each of the clauses referred to here are from Schedule 3 of the Reserve Bank Act)

Any such extension to a first term sensibly counts against the total time a member can be appointed to a second term for (so extensions can’t be used to lengthen the total time a first term MPC member is appointed for).

Any such extension has to be notified in the Gazette and given the significance of the MPC you might expect either or both the Reserve Bank and the Minister to put out a press release informing people, including markets, of any such extension.

The extension provisions make a lot of sense in principle, especially when elections roll round quite frequently and the convention is that new permanent appointments should not be made close to, or to commence even after the time of the election. (Interestingly, given that MPC members can only be people nominated by the Bank’s Board, there seems to be no requirement for the Minister to consult the Board – perhaps reasonable since only a maximum of a six month extension seems to be envisaged.)

There is no sign that Saunders’ term has been officially extended either (I checked again just now and there is still no mention of an extension on the Bank’s page detailing all the MPC members and their terms).

And so I assumed that Saunders would not be able to participate in yesterday’s OCR decision. And that is where I was wrong. She could, and she did. On did

And on could

In other words, having put in the law an explicit provision for formal notified (ie transparent) temporary extensions, deliberately designed not to add to the total term if the member is latter formally reappointed, they also slipped in a clause a bit further down the Schedule that lets the Minister of Finance leave in place any MPC member indefinitely (in the case of internal members only as long as they remain Reserve Bank employees – clause 21), with no formal actions, no consultation with the Board, no transparency, and at best greatly diminished accountability. It seriously undermines the idea of fixed terms or term limits (both of which were sensible innovations adopted by this very same Minister of Finance). It is also corrodes the role of the Board – not something I’m opposed to either in principle or (with current membership) in practice, but it was this Minister who decided to retain the central role of the Board in determining membership of the MPC.

There is simply no need for this provision once a formal temporary extension provision was in place, and its use undermines just a bit more any confidence in the MPC regime.

A fair bit of the way the New Zealand MPC model was designed (strengths and weaknesses) was taken from the Bank of England model. That isn’t too surprising and the Bank of England model is, I think, generally regarded as one of the better models around (the main weakness in it, replicated here, is the in-built majority for Bank of England staff, although the appointment processes in the UK mean that is less troublesome and risky than here). But the Reserve Bank version – law and practice – is a pale shadow of the British model, from designers who liked the form of the Bank of England and the substance of the RBA.

Recall that the Governor, Board chair and Minister here have got together to blackball as potential externals anyone with current or potential future research and analytical excellence in macroeconomics and monetary policy.

Recall too the practice under which the externals neither record their views in the minutes nor – except on the rarest, hardly seen at all, occasion – give speeches or interviews.

By contrast the Bank of England has had many able, informed, energetic, active, and open expert external MPC members, whom we hear from.

In the UK, external MPC members front up at the relevant (Treasury) select committee and are expected to answer questions on their views. As importantly, although the select committee has no veto rights, MPC members are expected to appear before the Treasury select committee for a pre-commencement hearing before their term starts. In at least one case such a hearing resulted in an appointee not taking up their position.

In New Zealand, nothing is heard at all from these not-very-expert – in one case appointed mostly because of her sex – external members at any point ever. We know nothing of their views, nothing of their contribution, little or nothing of their capability for and in the role. And whereas the UK goes through a pretty open selection process, with the Chancellor advised by The Treasury making the final calls, in New Zealand there is little sign Treasury has any substantive involvement (OIA evidence suggested none when reappointments were done last year) and the formal power largely rests with the Reserve Bank Board – a bunch of lightweight non-experts apparently appointed mostly to meet diversity criteria.

But at least, or so it appeared, when their term was up they’d be gone – or formally reappointed with appropriate paper trail. After eight years at worst, we could be sure they were gone (unless, say, promoted to Governor). That is how the UK legislation works.

From the relevant schedule of the Bank of England Act 1998

In the UK, members are limited to two three year terms. I don’t have too much problem with New Zealand’s two four-year terms approach – at least if we were going to have actual expert external MPC members – given the smaller pool of potential people here (although three year terms here would minimise election year reappointment issues).

Note also that in the UK legislation – clearly the model for New Zealand – the Chancellor is explicitly restricted to extending a term for a particular individual only once. That seems a prudent restriction – otherwise the Chancellor could extend a person indefinitely (six months at a time, all the while holding a whip hand over the individual to vote the way the Chancellor might prefer). But that restriction has not been carried over to the New Zealand law (see above), and one is left wondering if read strictly the New Zealand law may actually allow repeated six month extensions, I’m no lawyer, but might a court interpreting the New Zealand law look to the UK model and suggest that ministers and Parliament made a conscious choice not to impose such a prudent restraint?

And there is no suggestion anywhere else in the Schedule that any member can just remain in office indefinitely so long as the Chancellor does nothing. As you would expect, because in a well-run system there is no need – officials and ministers get on with making permanent appointments and if for some rare reason, eg election timing, it isn’t appropriate or possible to make an appointment immediately there is a tightly-limited and transparent provision for one time-limited extension.

It isn’t clear what was going on here when the law was drafted. Was it an oversight to have both formal and transparent time-limited extension provisions and a default non-transparent indefinite right to remain provisions. Perhaps, but if it was a deliberate choice, what possible good reason did the Minister and his advisers have?

It also isn’t clear quite what is going on now. There is no obvious reason why a proper appointment – or reappointment of Saunders – could not have been made (they managed it last year). There is no obvious reason why, if some spanner got in the bureaucratic works, Saunders could not have been formally extended for six months (it is entirely in the Minister’s power). And there is no evident reason for letting her simply remain indefinitely, with no notice or transparency (and it seems particularly odd in the current context, drifting ever closer to a tight election where the Minister may lose his ability to appoint a permanent MPC member). There must be an answer – for a position involving on paper a major macro policy decisionmaker at a time when monetary policy is rightly under a lot of scrutiny – but none of the public are favoured with the facts.

(I idly speculated that perhaps there had been some run-in with the Minister’s appointees on the Board. Perhaps they want someone, or some type (race/sex/whatever) of person, and the Minister doesn’t? But even if there was something to that there is still nothing to stop the Minster having given Saunders a formal extension for up to six months.)

Neither the law nor the practice are very satisfactory at all. This MPC member has exercised considerable power (at least on paper) through several years of serious monetary policy mistakes, and not only has there been no public or parliamentary accountability at all, but now we find that the Minister can, by doing nothing, just leave her in place indefinitely, with no transparency, no accountability, and no end date at all. The same option exists for Peter Harris’s second term which expires on 30 September. There should be some clarity from the Minister as to whether – in view of the proximity then of the election – he proposes to extend Harris (the appropriate option in the circumstances) or simply do nothing and let him stay in office.

It is yet another example of how the New Zealand MPC model – law and working practice – needs overhauling, and should be a matter of some focus for any incoming Minister of Finance. Yes, there are always going to be more pressing issues, but getting the governance of monetary policy right isn’t a trivial or unimportant matter either.

(For those wondering about the Governor – and taking some heart from the fact that he is term-limited and, having begun his second term last week, now has less than five years to run in office – his term as Governor can be extended for six months (same provision as for MPC members) BUT I can’t see any provision allowing him to remain in office by default if the then Minister takes no action to appoint a new Governor.)

Two countries

The Reserve Bank of Australia yesterday left its policy rate unchanged at 3.6 per cent. The Reserve Bank of New Zealand’s MPC is generally expected to today raise its OCR by another 25 basis points to 5 per cent.

In the broad sweep of decades it isn’t an unusually large gap. Most of the time, New Zealand short-term nominal interest rates are at least a bit higher than those in Australia (Australia’s inflation target is a little lower than New Zealand so the real interest differential tends to be a bit larger).

Sometimes economic circumstances in the two countries are very different. Thus, that period a decade or so ago when the RBA cash rate was higher than the RBNZ OCR coincided with the later stages of the Australian mining investment boom, for which there was nothing comparable in New Zealand.

But over the last two or three years, the similarities have seemed more evident. Both countries of course went through Covid, with overall quite similar virus/restrictions experiences. Prolonged closed borders affected both countries, notably the important tourism and export education sectors. Both had very expansionary macro policies. In the scheme of thing, both opened up at about the same time. Both have been characterised by labour shortages and very low rates of unemployment. And both have seen inflation sky-rocket, whether on headline or core measures.

There are differences of course. Take commodity prices as an example. If world prices have recently been falling for both countries, relative to levels just a couple of years back Australian incomes are still being supported much more by the high level of commodity prices.

What of the respective unemployment rates? Both are very low, but if anything Australia’s seems lower relative to (a) history and (b) likely NAIRU. Australia’s current unemployment rate is a half percentage point lower than the previous cyclical low, and has not yet shown any sign of lifting.

New Zealand’s unemployment rate (quarterly only) seems already to be off its trough and is now about the same as the unsustainably low level reached late in the 00s boom.

One can’t make much of that difference – and the unemployment rate isn’t the only relevant labour market indicator – but the comparison doesn’t obviously point to the RBA needing to do less than the RBNZ. As far as I can see, business survey measures suggest that difficulty of finding labour may have been easing a bit more in New Zealand than is yet apparent in Australia.

What about (core) inflation measures themselves? Bear in mind that the Australian inflation target is centred on 2.5 per cent and the New Zealand one is centred on 2 per cent.

Here is the annual trimmed mean measure of core CPI inflation for the two countries

And here are the annual weighted median measures

Core inflation started higher in New Zealand than in Australia (the RBA had been badly undershooting the target in the late 10s) but on both annual measures (a) New Zealand annual core inflation appears to have levelled out and (b) Australian core CPI annual inflation now appears to be higher than that in New Zealand. The differences between the two countries core inflation rates in the most recent quarter are more or less in line with the differences in the respective inflation target.

What about the quarterly measures? Here there is some difficulty because the ABS produces seasonally adjusted measures and SNZ does not. Eyeballing the New Zealand series there appears to be some seasonality, although not terribly strong.

Here are the quarterly trimmed mean inflation rates

and here are the weighted medians

The latest observations for the two series for Australia are quite similar (1.6 and 1.7) but there is quite a divergence in the two NZ series (0.9 and 1.3). But in both series there are signs the NZ peak has passed (if you worry about seasonality, even the latest quarterly observations are lower than those a year earlier), while there is no such sign in the Australian quarterly data. And while one can’t meaningfully annualise these data, the differences in the quarterly inflation rates look like more than is really consistent with the differences in the respective inflation data.

I’m not here running a strong view on whether one of these two central banks is right and the other wrong. But it remains a challenge to see how both can be right at present. The two central banks tend to articulate somewhat different models (I’m always surprised at the weight the RBA appears to continue to place on wage inflation, in rhetoric that sometimes seems misplaced from the 1980s), central banks are shaped by their past (the RBA was badly undershooting the inflation target pre-Covid), the political climates are now different (the RBA Governor’s term expires shortly, and governance reforms are in the wind) and there are other material differences in the demand pressures in the two economies that I’ve not touched on here (eg New Zealand has had a bigger housebuilding boom and may be exposed to a deeper bust).

Neither central bank has handled the last three years particularly well – or we wouldn’t have that unacceptably high core inflation – and I am far from being the RBNZ’s biggest fan, but for now my sense is that they are probably closer to right than the RBA is. That may, of course, mean that the near-inevitable recession is nearer at hand here than in Australia.

MPC members

The Reserve Bank’s Monetary Policy Committee is the (statutory) group and forum that makes OCR decisions. On paper at least, it is a powerful committee, for good and ill. The mistakes of that committee over 2020 to 2022 have given us high core inflation, well outside the target range. Fixing those mistakes – getting inflation back near the centre of the target range (where they are required by ministerial remit to focus – is likely to put the New Zealand economy into recession, and many people at least temporarily out of a job. It is still quite a new institution, having come into effect just four years ago on Saturday (Grant Robertson’s 2019 April Fool?) and with macroeconomic circumstances being as they are you’d have thought the powers that be would be focused on ensuring looming vacancies are filled in a timely manner. The new – glaringly inadequate – Reserve Bank Board has a big say in who gets appointed to the MPC (the Minister can reject a nominee they propose but can’t substitute his own – any MPC member has to have been nominated by the Board, a Board which itself has next to no expertise in such matters.

As a reminder, the MPC has four internal (staff) members and three part-time external members. That was the wrong balance to start with. but any hopes for the Committee were further eroded with (a) giving the Board notional control while appointing high school board of trustees quality board members, (b) requiring that the Governor be consulted on who should be appointed (the two taken together give the Governor an effective veto on anyone who might make life awkward for him or his managers), (c) when the Minister, Governor, and Board chair got together and agreed that no one with any current or likely future serious interest in macroeconomic analysis or research would be allowed as an external member of the MPC, and (d) when external members were not required, indeed were strongly discouraged, from putting their views or analysis on record, whether in the minutes or in speeches/interviews. And if the internal members were supposed to provide the serious expertise, any such claim appeared all the more risible when first the foundation chief economist never said a word in public, and then a new deputy chief executive (Assistant Governor) responsible for macro/monetary policy and analysis was appointed, with not a shred of qualification, experience, or credibility in the field. External MPC membership seems to be mostly cosmetic – a moderately well-paid late career or early-retirement gig for comfortable establishment figures. No doubt they do a little more than turn up to eat their lunch, perhaps it is even an interesting experience for appointees, but there is no sign (literally no evidence at all) of any of the externals having added any value whatever.

The first three external MPC members were appointed to staggered terms. The initial terms of Bob Buckle and Peter Harris expired this time last year, and they were reappointed (evidence suggests with no serious scrutiny of their record or contribution, but no doubt they made no trouble), Buckle for a further three years and Harris for a further 18 months. By law, in both cases these are their final terms. I’ll come back to Harris a bit later.

The third external MPC member, Caroline Saunders, was always the most egregious of the initial MPC appointments. It was pretty clear from OIAs done at the time that her primary qualification at the time was that she was a woman – come what may, Robertson was determined to have a woman on the MPC. Saunders is a Phd economist (as it happens, the only one on the MPC), professor at Lincoln University. This is her bio (from her university page)

She seems to publish quite a lot. These are just the most recent papers she lists

Potentially really interesting, possibly even valuable. But of course none of it suggests any capability relevant to setting New Zealand monetary policy.

There is a range of views about quite how an MPC should be made up. I’m not one of those who think that all seven members should be macroeconomics researchers, or even come equipped with a PhD – these days a prerequisite for academe, but not for most other policy and policy advice roles. But especially when the internal members are so weak analytically in these areas (read their rare speeches if you doubt me), it seems extraordinary to have someone like Saunders on the MPC.

As it is, it appears that as of Saturday she no longer is. The Reserve Bank website still lists her as a member

but the initial press release appointing her was clear that the appointment was from 1 April 2019 and was for four years (the maximum initial term allowed by law).

By law, the Minister of Finance can extend a term (without reappointing her) for up to six months – a provision that seems most likely to be useful around general elections – but (a) there has been no sign of such an extension (and nothing on the RB website) and (b) it would seem particularly inappropriate to be doing a short extension right now, which could only take a substantive decision on appointment or replacement closer to the election (itself now 6 months and two weeks away). From this government’s perspective, it would have seemed much more appropriate to either reappoint Saunders for several years, or to make a new multi-year permanent appointment.

So (unless there is something out of Cabinet today) it appears that Saunders is not an MPC member and should not be participating in this week’s OCR review decision.

What isn’t clear is what is going on and why. It isn’t as if the Board and Minister have had no notice – not only have they had four years’ notice (four year term) but they managed smoothly enough last year the end of the terms of Bob Buckle and Peter Harris. Even the new Board has been in place since 1 July, and they managed to reappoint the Governor months ago.

Whatever is going on seems far from best practice. If Saunders was to be reappointed, it could and should have been done months ago. If she wasn’t to be reappointed, one might have hoped for an open and transparent process, in which the coming vacancy was advertised, relevant skills identified etc. But thus far, we’ve had nothing at all.

In other countries, there might be some focus. After all, in the US, or UK, or Sweden we’d have some sense of the views, and mental models, of the outgoing member, and in a fairly small MPC a departure, and a vacancy, could shift the balance of the committee. Here, no one supposes the external members matter, and probably Saunders least of all (Buckle and Harris have each made one or two (unrevealing) public comments during their term, but from Saunders not a word at all). But it really is quite a bad look for one of the flagship aspects of the first wave of the legislative overhaul of the Reserve Bank.

I’ve noted before that Peter Harris was given a second term of only 18 months, expiring on 30 September this year. It was puzzling at the time, since it was always likely the general election would be in the last few months of 2023. No explanation was given as to why, say, Harris was not given a two-year term, which would have carried him through to March 2024 when a new government (old or new) could have made a new permanent appointment (Harris cannot be reappointed again). As it is, with election day now scheduled for 14 October, the Harris term should also be getting some focus. Harris presumably can have his term extended for six months (but the issue should never have arisen, as there is no great surprise about the election date), and the Minister of Finance should be making it clear soon that that is the approach he will take. It wouldn’t be desirable to leave a vacancy on the MPC – especially at such a turbulent time – and it should of course be out of the question for the current government to make a new permanent appointment with a commencement date just two weeks from election date.

The New Zealand MPC model was moribund almost from its creation, and no doubt that suited both the Governor (especially) and the Minister quite well (gain the appearance of substantive change without the substance). It is a salutary lesson for those championing reform in Australia, where the door is now open for real substantive change but where the incumbents may have strong incentives to protect their patch. On this side of the Tasman, I hope that real and substantive reform of the RBA governance model will put pressure on for revisiting that damp squib Orr and Robertson created here. For all the statutory limitations, a lot could be done here even within the current law by a Minister who was serious about a much stronger institution, and the foundations for better and more accountable policy over the medium term. A good start could be made by appointing much more able people – expert, fearless, open-minded, engaging – to the two current and forthcoming MPC vacancies.

UPDATE (5/4)

A reader draws my attention to this clause, which I had not previously noticed. It does allow Saunders to continue to serve, without the formal ministerial extension powers being exercised. It seems a quite unfortunate provision, since on its face it allows the Minister to let any MPC member continue in office indefinitely (with not even the accountability of a certain exit date) even though the Act has explicit term limits (two for external MPC members, with even formal extensions counting against the time any member can serve for a second term.

Interesting that the Minister of Finance asked for advice

In September last year, former Bank of England Deputy Governor Sir Paul Tucker published a substantial discussion paper suggesting paying a sub-market, or zero, interest rate on some portion of the huge increase in bank deposits at the central bank that had resulted (primarily) for the large-scale asset purchase programmes central banks had been running (in the Bank of England’s case since the 2008/09 recession, but in some countries – including New Zealand and Australia – just since 2020).

In late October, I wrote about Tucker’s paper, and you will get the gist of my view from the title of that post, “A Bad Idea”. The Herald’s Jenee Tibshraeny picked up on that post and the following day ran an article on the Tucker tiering proposal, with sceptical quotes from several people including me. There was a difference of view in those quotes. As in my post, I argued that such an approach could be adopted without impeding the fight against inflation but should not be adopted, while others (as eminent as the former Deputy Governor, Grant Spencer) suggested that not only that it should not be done, but could not (ie would tend to undermine the drive to lower inflation).

The essence of my “it could be done” line was the same as Tucker’s: monetary policy operates at the margin, and so what matters for anti-inflationary purposes is that the marginal settlement cash balances receive the market rate, not that all of them do. There was precedent, in reverse, in several (but not all) countries that ran negative policy rates, where the central bank applied the negative rate only to marginal balances, while continuing to pay a higher rate on the bulk of balances (thus supporting bank profits, although the argument made at the time was that doing so would help support the monetary transmission mechanism).

So far, so geeky. But it turns out that after Tibshraeny’s first article, the Minister of Finance sought advice on the Tucker proposal, not just once but twice (first from The Treasury and then later from the Reserve Bank). In yesterday’s Herald, she reports on the two documents she got back from an Official Information Act request to the Minister. She was kind enough to provide me with a copy of the material she obtained.

The Treasury advice, dated 6 December 2022, does not explicitly say that it was in response to a request from the Minister, but it seems almost certain that it was. Treasury is unlikely to have put up advice off its own bat on a matter that is squarely a Reserve Bank operational responsibility without formally consulting with the Reserve Bank and including some report of the Reserve Bank’s views in its advice. We can assume the Minister asked Treasury for some thoughts, and Treasury responded a few weeks later with four substantive pages.

I don’t have too much problem with The Treasury’s advice on a line-by-line basis. Their “tentative” view was that some sort of tiering arrangement could be introduced without undermining the effectiveness of monetary policy.

There were a couple of interesting things in the note nonetheless. For example, it was good to have this in writing

and it was also interesting to read that “in previous discussions with the Bank they have indicated that they would consider introducing a zero-interest tier if the OCR were negative”.

Treasury highlighted that a zero-interest tier in the current environment (large settlement cash balances, fairly high OCR) would be in effect a tax on banks with settlement accounts.

but strangely never engage with the question as to whether it would be appropriate for the Reserve Bank to impose such a tax (or whether they had in mind special legislation to override the Reserve Bank on this point).

They also note some potential reputational issues

but could have added that these might be particularly an issue if New Zealand was to adopt such an approach in isolation (they neither mention, and nor have I seen, any indication any other authorities have seriously considered this option).

The Treasury note ends recommending not that the issue be closed down and taken no further, but that if the Minister wanted to “pursue this option” he should seek advice from the Reserve Bank and they offered to help draft a request for advice.

And so the Minister turned to the Reserve Bank for further advice, and on 2 February 2023 they provided him four pages of analysis (plus a full page Executive Summary which is more black and white than the substantive paper itself). The Bank seems pretty staunchly opposed to the tiering idea, but on occasions seems to overstate its case. And, remarkably, they never even attempt to engage on the question as to whether the market-rate remuneration of the large settlement cash balances created by their LSAP (and Funding for Lending) programmes are any sort of windfall gain to the banks (a key element of Tucker’s argument).

But much of what they say is reasonable. From the full paper

There is no real doubt that it can be done, and they draw comparisons between regimes in some other countries, more common in the past, where some (legally) required reserves were not remunerated at all.

I largely agree with them on this

departing from them on that final sentence of paragraph 25 (any tier could, and sensibly would, be set on the basis on typical balances held prior to any announcement or consultation document), and in the first sentence of paragraph 26 (since, from the Bank’s perspective, benefits from the LSAP are supposed to be a good thing – the Governor repeatedly champions them – not bad).

The Bank attempts to play down the amounts at stake, suggesting any potential gains to the Crown (and thus, presumably, costs to those subject to the “tax) would be modest. But they include this

I guess when your MPC has thrown away $10bn of taxpayers’ money, $900m over four years doesn’t seem very much (and these calculations are materially biased to the low end of what could be raised without adversely affecting monetary policy) but…..$900m over four years buys a lot of operations, or teacher aids, or whatever things governments like spending money on.

It is also a bit surprising that although the Bank notes that such a tiering tax would be likely to be passed through to customers, they provide no substantive analysis as to how or to what extent, and thus what the likely incidence of such a tax would be. It isn’t that I disagree with the Bank, but the analysis isn’t likely to be very convincing to readers not already having the same view as them (tiering is a bad idea).

They make some other fair and important points, notably that hold a settlement account with the Reserve Bank would be likely to be less attractive if doing so was taxed, in turning providing an advantage to non-settlement account financial institutions (broader settlement account membership is generally a good thing, conducive to competition and efficiency). But then they over-egg the pudding. This line is from the Executive Summary – and draws on nothing in the body, so has the feel of something a senior person inserted at the last minute

One of the points commentators on central banks often have to make to less-specialist observers is that banks themselves have no control over the aggregate level of settlement cash balances. Individual bank choices – to lend or borrow more/less aggressively – affect an individual bank’s holdings but not the aggregate balances in the system. And thus banks cannot materially impede future LSAP-type operations since there is no reason why the Reserve Bank’s purchases need to be constrained only to entities that already hold settlement accounts at the Bank. If the Reserve Bank buys a billion dollars of NZ government bonds at premium prices from overseas investors/holders, the proceeeds will end up in NZ bank settlement accounts whether the local banks like it or not. Same goes for, say, large fiscal operations like the wage subsidy. What might be more accurate – and I made this point in my original post – is that a tiering model carried into the future might motivate local banks to lobby harder against renewed LSAPs. From a taxpayers’ perspective that would probably be a net benefit, but one can see why the Reserve Bank might have a different view.

While I don’t really disagree with the thrust of either the Reserve Bank or Treasury advice neither could really be considered incisive or decisive pieces. Perhaps the Bank’s piece was enough to persuade the Minister (although there is no indication in the OIA material or in Tibshraeny’s article that the Minister has abandoned interest). A tiering regime of the sort discussed in the RB/Tsy advice would be an opportunistic revenue grab, representing either an abuse of Reserve Bank power or a legislative override of monetary policy operational independence, with truly terrible signalling and precedent angles. It could be done – so could many many bad things – but it shouldn’t.

(If you want a typically-passionate opposing view, try Bernard Hickey’s column yesterday, from which I gather he has removed the paywall.)

Big mistakes were made. The LSAP was unnecessary, ill-considered, risky, and (as it turns out) very expensive. The Funding for Lending programme continued all the way through last year was almost incomprehensible (if cheaper and less risky). Mistakes have consequences and they need to be recognised and borne, not pave the way for still-worse compensatory fresh interventions.

I’m going to end repeating the last couple of paragraphs from my original post

It is, perhaps, a little surprising that neither set of official advice shows any sign of engaging with Tucker’s paper itself, or with the author, a very well-regarded and experienced figure.

RB chief economist on inflation

It was something of a (perhaps minor) landmark event last Thursday when the Reserve Bank’s chief economist Paul Conway gave an on-the-record speech on inflation. It was only Conway’s second on-the-record speech (the first was on housing, something the Bank has little or no responsibility for) and thus only the second speech from a Reserve Bank chief economist for almost five years. Five years in which chief economists have become statutory decisionmakers (members of the MPC), in which monetary policymakers have dealt with a huge and expensive shock, and in which inflation – prime focus of central bank monetary policy – has been let run amok in ways never seen previously (arguably never envisaged) in the first 30 years of inflation targeting. And when (a) external MPC members are barred from research/analysis, and (b) barred from speaking or disinclined to do so, and (c) the chief economist’s own boss has no qualifications/background in economics or monetary policy, we should be able to look to the Bank’s chief economist for incisive and insightful analysis and perspectives on the macroeconomic dimensions of the Bank’s responsibilities. If not him then who?

Sadly, the answer to that seems to be no one at all.

There have been worse things from the Reserve Bank on monetary policy in recent years. The most egregious have been the (apparently) unscripted one-liners from the Governor. One could think of his claims – never backed by any analysis at all – that the economic gains from the LSAP programme were “multiples” of the $10.5bn (Treasury estimate) direct fiscal loss from the LSAP, or the preposterous spin he tried on Parliament’s Finance and Expenditure Committee just a few months ago

Not even arguable, just false.

There is nothing quite so egregious in Conway, mercifully (he is a more earnest, less flamboyant – or worse – character).

But what is there in his speech is far from the sort of standard we should expect from a senior policymaker addressing the biggest monetary policy failure in decades. And it is not as if his speech was delivered to a bunch of high schoolers or the Gisborne U3A (no offence to either) but to an (at least) expert-adjacent group at the ANZ-KangaNews New Zealand Capital Markets Forum.

The Bank’s PR people billed the speech this way

Item 3 is easy. The only thing the Bank can do is raise the OCR and hold it higher for long enough. Although Conway never acknowledges this, it is hard to be very confident in their view (or anyone else’s) on how high or how long might be required, not just because there are always new shocks, but because neither the MPC nor others really yet have a compelling story for why core inflation went so high so quickly.

So much of the speech is made up of plaintive pleas to the public to believe the MPC when they say they are serious, and to act accordingly, without giving us any basis to believe the MPC really knows what it is doing. After all, not much more than 18 months ago Conway’s predecessor was telling the Reserve Bank’s Board there was no hurry and no real need to worry, and their published forecasts were telling us they expected inflation would be almost bang in the middle of the target range by now. It would have been a bad (and costly) idea for people to have based their plans on those forecasts and the contemporaneous rhetoric. You might have hoped that if he really wanted to jawbone us, and have people take seriously his rhetoric, that the Bank’s chief economist (of all people) would be presenting persuasive analysis that they understand what they got wrong and reasons to think they are better now. But there is none of that in the speech, and it refers us to no serious supporting analysis or research either.

Instead there is lots of spin.

One of the most striking things in the speech was something that wasn’t there. Central bankers often, and rightly, pay a lot of attention to measures of core inflation. But in a major (rare) speech about inflation, there is but one (passing) mention of the term (or cognate terms), simply noting in the final few sentences that core inflation is about middle of the pack among OECD countries/economies.

Instead, we get a great deal about “the pandemic, the war, and floods”, which seems to be a slightly more sophisticated attempt at distraction than his boss’s claims quoted above.

No doubt, as Conway notes, the floods will put some pressure on resources over the next few years (particularly to the extent losses are covered by offshore reinsurers, as distinct from being net NZ wealth losses), as the 2010/11 and 2016 events did, and may result in some direct price pressures (some fruit and vegetable prices) in the next couple of quarters. But, thanks to New Zealand’s infrequent and badly lagging CPI, none of that is in the published inflation numbers yet.

What of the pandemic? It is clear that here Conway is not talking about the (with hindsight) gross macroeconomic mismanagement (the RB MPC being the last mover, and thus primarily responsible) that delivered us, several years on, really high core inflation, but the direct price effects of pandemic-driven supply chain disruptions several years ago. Some of those effects may have been material contributors to headline inflation back in 2020 and 2021, but it is now 2023, and if we could do a good decomposition (a good topic for some RB analysis) it seems likely that if anything the unwinding of those disruptions is probably holding headline inflation down a little now (eg global freight costs have fallen a lot). Perhaps he has in mind airfares – where capacity has been slow to return – but that is a good reason to look at, and cite, analytical core inflation measures.

And then there is “the war”. At the Reserve Bank, they are very keen on “the war” as distraction and cover.

We all know world oil prices shot up quite a bit in the immediate wake of Russian’s invasion last February. But not only are world oil prices now lower than they were (real and nominal terms) prior to the invasion, but New Zealand headline annual CPI inflation is still held down artificially at present by the kneejerk petrol excise “temporary” remission put on last March and still in place (strangely, Conway never mentions this). Where else might we find these “war” effects in New Zealand inflation? Wheat prices also rocketed upwards initially, but again they are lower now than they were at the start of last year. I guess fertiliser prices are still higher than they were, but it hardly seems likely to add up to much in NZ CPI inflation. Especially when we know – although Conway never mentions – that core inflation had already risen a lot, to quite unacceptably high levels, well before the invasion.

Conway does acknowledge that monetary policy should have started to tighten earlier (and doesn’t even fall back on the silly line he and Orr have previously used, that a slight difference in timing would have made only a slight difference to inflation – well of course, but the real problem, with hindsight, was not “slight” differences in timing), but engages in a fairly sustained effort to leave readers thinking there really was not an evident problem in 2021, just a few “one-offs”. But this is where analytical measures of core inflation come in. Trimmed mean and weighted median measures are pretty standard parts of many monetary policy analysts’ toolkits.

The big increase in quarterly core inflation took place in 2021.

The sectoral core factor model, like all models of its class, has end-point issues and estimates prone to revision, but the best guess now is that core inflation had already doubled (to in excess of 4 per cent) by the end of 2021.

But none of this mentioned at all in the speech. Nor is the fact that by late 2021 the unemployment rate – best simple measure of changes in excess capacity – was dropping rapidly to below levels anyone regarded as sustainable.

Many of these events took the Reserve Bank (and others by surprise), but they are the ones paid to get these things right. We live with the consequences when they don’t. But nowhere in the speech is there any acceptance of responsibility.

We also get attempts to suggest there is nothing the MPC can do about inflation sourced from abroad…….in a speech where the exchange rate gets no substantive (and only one formal) mention at all.

There is a chart in the speech which purports to illustrate the problem, showing tradables inflation as a share of headline inflation, without any acknowledgement that if tradables tend to average 0% and non-tradables 2.5 per cent (loosely the case pre-Covid) and then tradables average 2% and non-tradables 4.5% tradables would make up a larger share of headline inflation even though nothing about the relationship between tradables and non-tradables had changed at all. Yes, tradables inflation has increased relative to non-tradables but if we look at the core components of each the recent change isn’t unprecedented, tradables didn’t lead non-tradables, and (in any case) the Reserve Bank’s own past analysis has tradables as a typically fairly small component in the overall sectoral core inflation measure.

If – as happened – other countries run high inflation, the job of the Reserve Bank of New Zealand is to tighten monetary policy here to lean against importing that inflation. That will generally occur through a higher-than-otherwise nominal exchange rate.

I’m not going to spend any more time on the jawboning rhetoric. No doubt it feels good inside a central bank – I’ve run plenty of it in my time, in writing and in speeches – but it is really a distraction from the core issues (MPC responsibilities) and less persuasive now – when, with the best will in the world, the central bank has just messed up badly – than perhaps it might have been decades ago when we first trying to transition from high inflation to low inflation, with a newly-independent central bank.

Conway’s speech was made just a month on from the latest Monetary Policy Statement. In that flagship MPC document, there was a substantial four page section on “The International Dimension of Non-Tradables Inflation”. No doubt, the analysis in that section came from Conway’s own Economics Department. But in a flagship speech on inflation just a few weeks later there is no mention, not even a reference, to that analysis at all. In my MPS commentary (last few paras) I briefly identified a number of apparent weaknesses in the analysis. Perhaps on reflection Conway accepted the issues I had raised, but whatever the explanation it seems odd to have such analysis feature prominently one month and simply disappear from consideration the next.

These were two of the last three paragraphs of the speech (emphasis added)

At one level, it is hard to argue. It all sounds good. Except….where is the substance to back up the words? The Bank’s own published research output has slowed to a trickle, there is no serious analysis or insight in the speech, and we know that the Minister of Finance has reaffirmed only last year his commitment (in league with Orr and Quigley) to ban anyone with an active or even future interest in serious research or analysis from serving as external MPC members. Oh, and the Reserve Bank has the least-qualified deputy chief executive responsible for macroeconomic and monetary policy of any advanced country central bank (and probably most emerging and many developing countries as well). Nothing we’ve seen so far suggests any particular reason to treat these words as anything other than spin.

I was mildly hopeful (prone to naive optimism perhaps) when Conway was appointed. Perhaps things are about to change. There is, after all, a position on the MPC that comes vacant next week, currently held by someone who has no relevant subject expertise, who has never explained her views on monetary policy in four years in the job, and who was (so the papers confirm) pretty clearly appointed mostly because she was a woman. Replacing her with a more serious appointee, and overhauling the protocols in a way that encouraged or compelled externals to be individually accountable, would be a small start in the right direction. If Orr, Robertson, and Quigley were serious. I am not, however, holding my breath.

The contrast between Conway’s speech and those of his peers in other advanced central banks once again leaves the New Zealand institution looking well off the pace. Just the slides published for an ECB Board member’s talk yesterday have considerably more substance than Conway’s full speech (and she speaks often). I’ll leave you with this chart, inspired by one of Schnabel’s slides

Terms of trade fluctuations – “direct price effects of the war and the pandemic” – just aren’t a big macroeconomic issue in New Zealand.

New Zealand’s monetary policy mess

The New Zealand Initiative has a new report out this morning, written by Bryce Wilkinson, under the heading “Made by Government: New Zealand’s Monetary Policy Mess”. (Full disclosure: I provided fairly extensive detailed comments on an earlier draft.)

It is a curious report. There is a lot of detail that I agree with (and the report draws quite extensively on various criticisms I have made in recent years) but it ends up having the feel of a bit of a muddle.

(It is perhaps not helped by the Foreword from an Otago academic who seems wedded to a fiscal theory of the price level that doesn’t exactly command widespread support anywhere, and which would appear on the face of it to have predicted that New Zealand would have had one of the lowest inflation rates anywhere. His approach appears to absolve the Reserve Bank of responsibility for the high inflation: “the key reason why we have high inflation rates is fiscal policy and not monetary policy” and “even if the RBNZ had not made mistakes, I doubt that it could have avoided high inflation”.)

The title of the report is clearly supposed to suggest that what has gone on is primarily the government’s responsibility (and specifically that of the Minister of Finance). And there are plenty of things one might reasonably blame the Minister for:

  • changing the Bank’s statutory mandate (if you think this was a mistake, or mattered to macro outcomes, which I don’t)
  • reappointing Orr despite the opposition of the two main opposition political parties, having himself changed the law to explicitly require prior consultation with other parties in Parliament,
  • going along with the Orr/Quigley preference to prevent experts from serving as external MPC members (which still seems incredible, no matter how times one writes it),
  • appointing a weak Board with barely any subject expertise, the same board being primarily responsible for Governor and MPC appointments and for holding the MPC to account,
  • being indifferent to serious conflicts of interest in people he was appointing to the board,
  • prioritising a person’s sex in making key appointments,
  • for bloating the Bank’s budget, and
  • never once have shown any sign of unease about the massive losses the MPC-driven LSAP has run up, about the Orr operating style, or any urgency around better understanding what has gone on (you will search letters of expectation in vain for any suggestions from the Minister that, for example, more/better research capability and output might be appropriate, or that speeches more of the quality seen from other advanced country central banks might be appropriate)

and so on.  Robertson has been both an active and passive party in the serious decline in the quality of our central bank over recent years, and given that Orr has been reappointed and seems disinclined to acknowledge the validity of any criticisms, only the Minister of Finance –  current or future –  can make a start on fixing the institution.  Institutional decline –  and it isn’t just the Reserve Bank –  has been a growing problem in New Zealand, and the current government’s indifference has only seen the situation worsen: one might think too of the Productivity Commission.

But, for better or worse, when most people think of a “monetary mess” at present they probably primarily have in mind inflation.  And the way the report is structured it would seem that both the author and the Foreword writer also put a lot of emphasis on the bad inflation outcomes.  No doubt rightly so.

But there simply isn’t any compelling evidence, or really even any sustained argumentation that would stand scrutiny, that any or all of the many things one can criticise Robertson for really go anywhere towards explaining how badly things have gone with inflation (or even with the massive losses on the LSAP).  I’m not, of course, one of those who believe the Bank should escape blame –  that somehow for example (as per one of the Governor’s ludicrous attempts at distraction) we can blame it all instead on Putin or “supply chain disruptions”, as if they somehow explain the most overheated economy and labour market in decades.

But how confident can we really be that a better Reserve Bank –  on the sorts of dimensions the NZI report rightly draws attention to –  really would have made much macroeconomic difference?   As just a small example (and from a country with a similar pandemic experience) the report rightly draws attention to the better academic qualifications of the Governor and senior figures at the Reserve Bank of Australia.  But nothing about Australian inflation outcomes –  or LSAP losses for that matter –  suggests that the RBA has done even slightly better than the RBNZ in recent years.  If anything, I (the Bank’s “most persistent and prolific” critic, as the report puts it) reckon the RBA has done a little worse, even if there is a better class of people and some more thoughtful speeches.    One could extend the comparisons.  As I’ve highlighted here, New Zealand’s core inflation outcomes have been bad, but about middle of the pack among OECD countries/regions.   Fed Governors do lots of good speeches, the institution does lots of interesting research, experts are allowed to be decisionmakers, but…..core inflation outcomes are little or no better and the Fed was even slower than the RB to get started with serious tightening.  And so on, around most of the OECD.

There is –  as the report notes –  no absolute defence for Orr and the MPC in other countries’ inflation records. We have a floating exchange rate to allow us to set our own path on inflation, and just because other countries’ policymakers messed up should not absolve ours of responsibility.    But to me the evidence very strongly suggests that what happened over the last two to three years was that (a) central banks badly misunderstood what was going on around the macroeconomics of Covid, (b) so did almost all other forecasters, here and abroad, and (c) there isn’t much sign that central banks with better qualified more focused people or more open and contested policy processes did even slightly discernibly better than the others.   I wish it wasn’t so.  With all the many faults in the RBNZ system and personnel, it would be deeply satisfying to be able to tie bad outcomes to those choices (active and passive).  But I just don’t think one really can.    All those governance and style matters etc matter in their own right –  we want well-run, expert, open, engaged, accountable, learning institutions, especially ones so powerful.  And weak institutions are likely over time to produce worse outcomes in some episodes.  But there is little sign yet that this is one of those episodes.

And it is clear when one gets to his conclusion that Wilkinson more or less knows this, as he struggles to connect the very real concerns about the Bank, and what Robertson has initiated or abetted, with the most unfortunate macroeconomic/inflation outcomes.

I was going to say that it isn’t really clear either who the report is written for.  But in fact I think that is wrong, and that the primary intended audience is Nicola Willis, her boss, and her colleagues/advisers.    Thus we find this

Bryce 5

Talk about deferential and accommodating.

And the entire report ends this way

bryce 6

In terms of fixing the institution that seems largely right. It could be fixed, but it will need ministers/governments that care and that are willing to devote sustained attention to using the levers they have to gradually right the ship. As Bryce notes, many of these changes can’t be effected quickly, but mostly because the laws are deliberately (and appropriately) written to make it not easy for new governments of either stripe to make sudden or marked changes. That is helpful when the institution is working well, but quite an obstacle otherwise, and may – if a new government were to care enough – need legislative change.

(I wrote a post here last year with some thoughts on what a new government could and could not do.)

As you watch the interactions between Orr and Nicola Willis at FEC – in which Orr is routinely scornful and dismissive – you wonder how in decency he could possibly continue to serve under a National-led government, But perhaps if he were that sort of person – staying in his lane, acknowledging mistakes, open and engaging etc – the concerns would not exist in the first place. As it is, it would be hard (all but impossible under current law I’d say) to get him out if he wants to stay, and so reform efforts will need to go around him, including progressively replacing the Board with able people and ensuring that the external MPC members are both able and expected to be individually and publicly accountable for their own views and analysis. But do all that and we – and other countries – will still be at risk of really bad macro forecasting errors, and central banks unable to live up to their rhetoric, albeit we might hope for no repeats for another generation or two.