Reading the regional GDP data

A few weeks ago SNZ published the annual regional GDP data. These data don’t tend to get much coverage, partly because of the (probably inevitable) long publication lags (the headline data are for the year to March 2022, the sectoral data by region for the year to March 2021) and partly because the numbers are for nominal GDP only. One might also have feared that Covid lockdown and border closure effects would further muddy anything that could be taken from the last couple of years of data.

But the data are worth persevering with, and there are all sorts of interesting snippets one can find.

First, here is how the regional shares of GDP have changed this century to date (the first data available are for the year to March 2000). Bay of Plenty’s share of total national GDP has increased from 5.2 per cent in 2000 to 6.0 per cent in the year to March 2022.

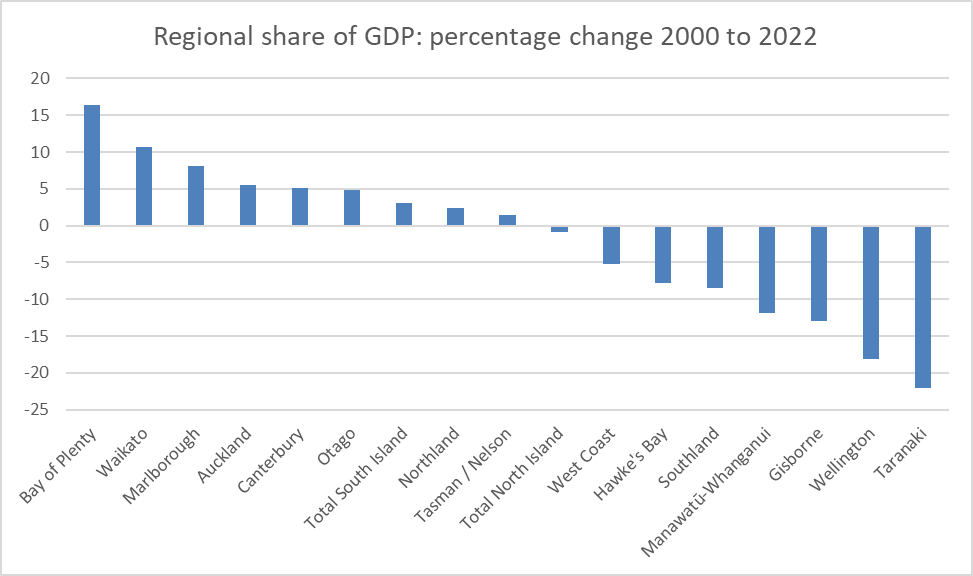
The high placings of Waikato and Bay of Plenty weren’t a surprise, but I hadn’t expected to see three South Island regional council areas in the top six places, or that the South Island’s share of the national economy has actually increased this century. Most of the laggards are in the bottom half of the North Island, perhaps most notably Wellington – an area not only sustained by government spending and employment, but with local authorities and related lobby groups who’d like you to believe that Wellington was some sort of cool tech hub, and thus well-positioned for the 21st century.

(Eyeballing the data, Covid didn’t seem to have affected the rankings materially – numbers to March 2022 being much the same as those to March 2020).

Wellington’s decline has been fairly unbroken

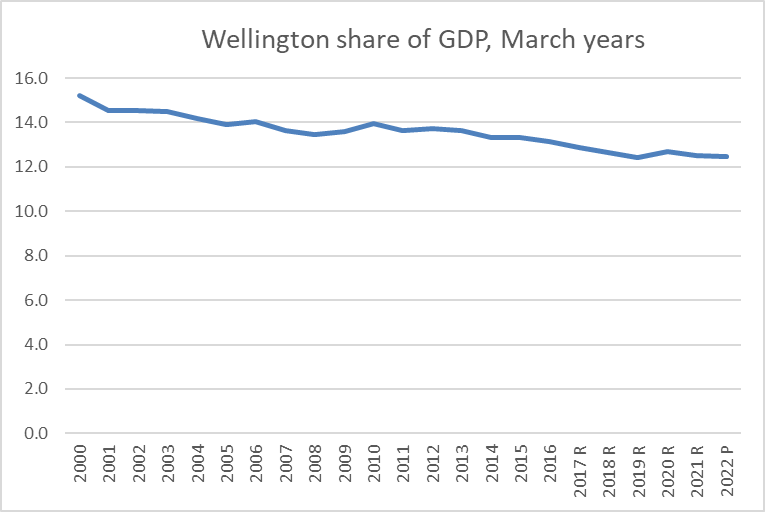
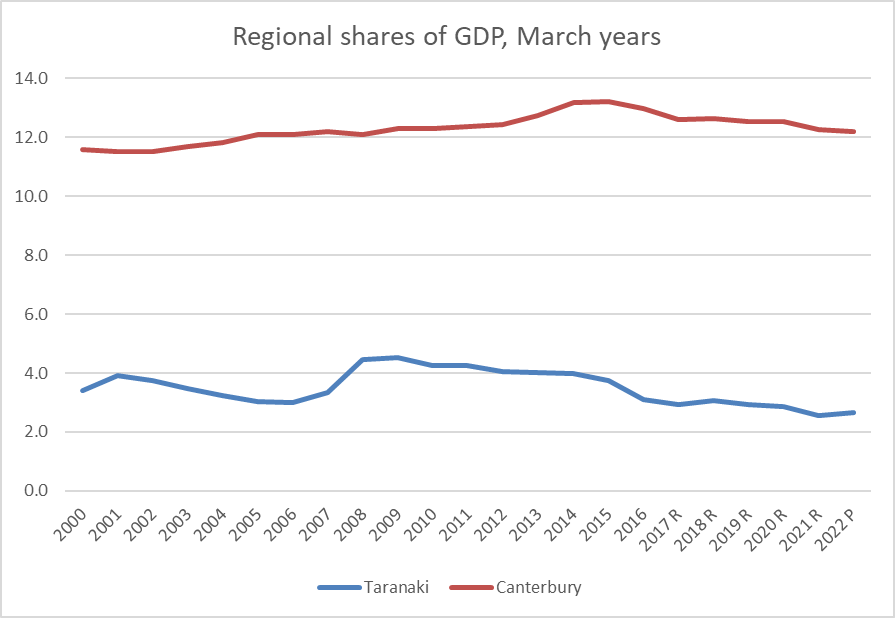
On the other hand, here are a couple of idiosyncratic stories: big temporary lifts for Taranaki (Tui oil) and Canterbury (earthquakes make you poorer but generate a lot of (gross) new activity in the repaid and rebuild phase).

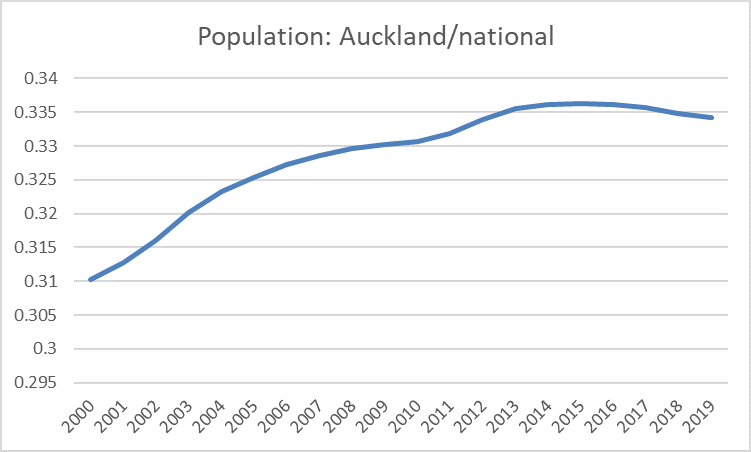
What about population shares?

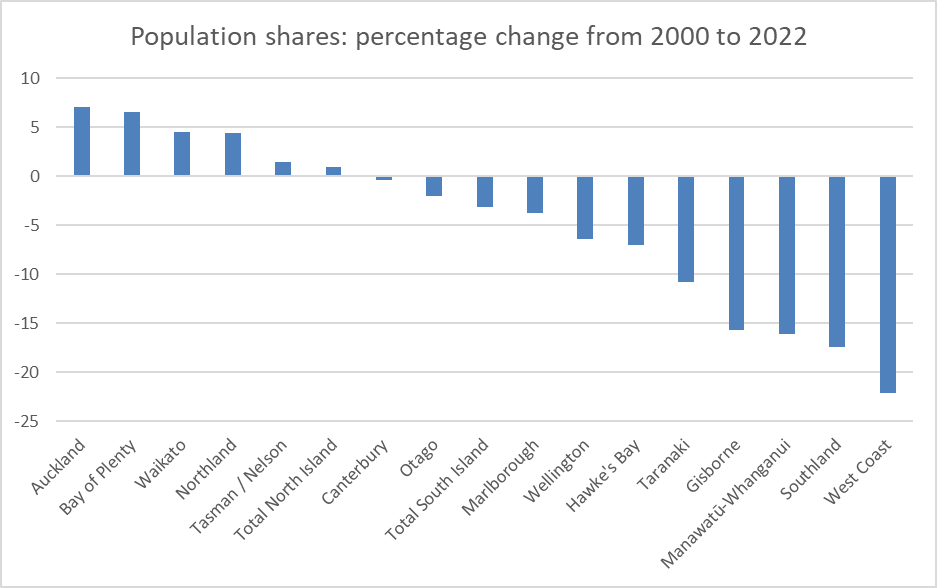
Here, a positive number means population in that region has grown faster than the national average (eg Auckland’s population has grown from 31.0 per cent of the total to 33.2 per cent). Almost all the above-average growth has been in the North Island, with some contribution from Tasman/Nelson, and Canterbury more or less holding its own. The bottom half of the North Island has again lagged behind. (At a regional council level, no area has had a fall in population over the century to date).

Of the bigger urban areas, Wellington has had the slowest rate of population growth (behind even Otago).

What of GDP per capita? The good news is that all the places that had GDP per capita above the national average in 2000 (Auckland, Wellington, Taranaki) were closer to the national average by 2022. and apart from Northland and Hawke’s Bay all the region with average GDP per capita in 2000 were at least a bit closer to average by 2022. Southland, which includes Queenstown, now has GDP per capita just a bit above the national average. Convergence…..it isn’t really that common these days. But it has happened here.

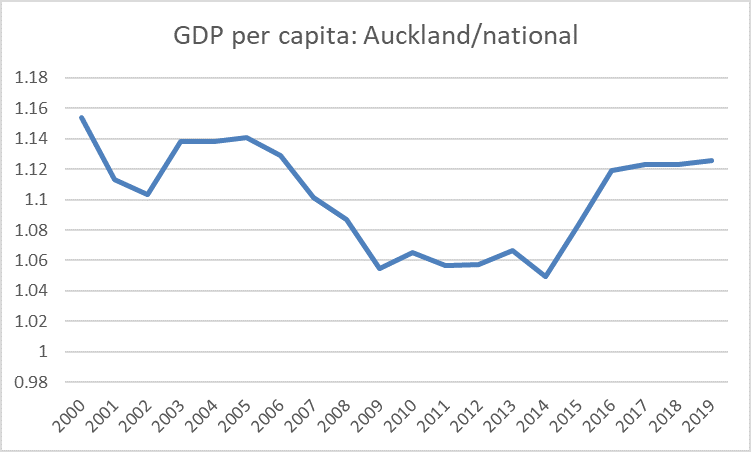
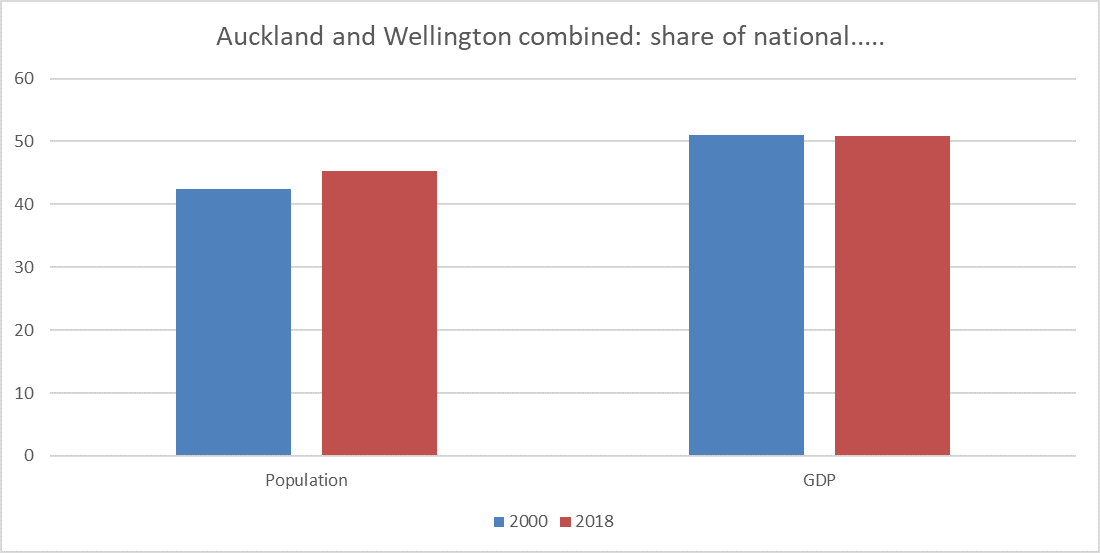
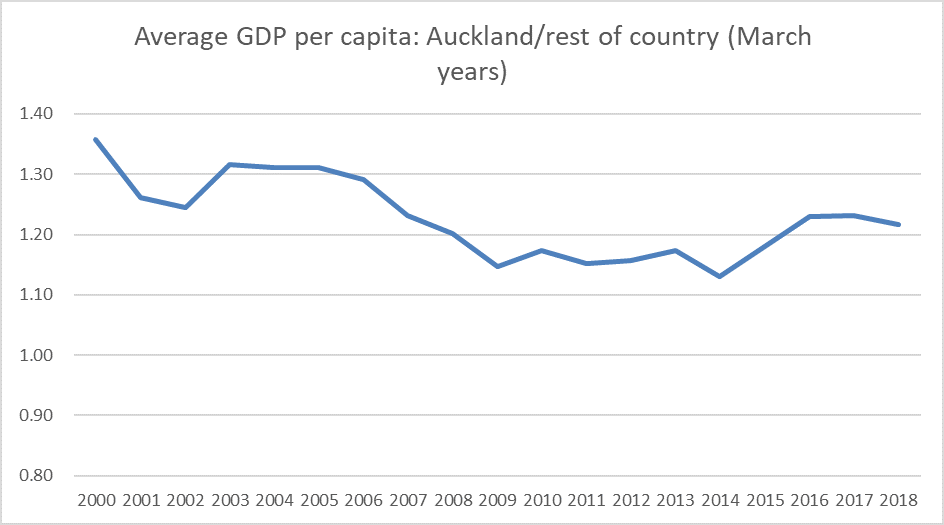
The biggest, by far, chunk of the population is in Auckland. Here is what has happened to average GDP per capita in Auckland this century relative to the national average.

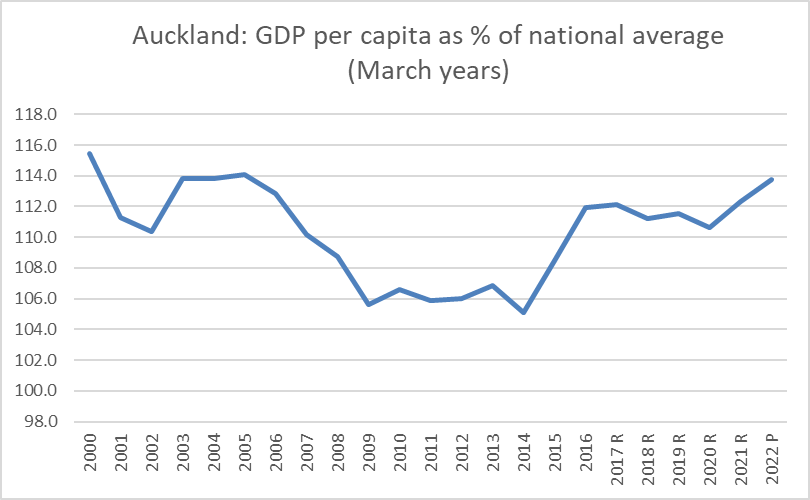
My story on this data is that (a) it is quite heavily influenced by construction cycles (a smaller boom in the mid-00s and rising to record levels of construction now), but that (b) if anything the underlying trend is downwards. That second strand might seem a bold claim, but construction really has been at unprecedented levels in the last few years and GDP per capita relative to national average still isn’t back to 2000 levels. It will be fascinating to see what happens to this series over the next few years.

(More generally, and I have written on this before, the margin between GDP per capita in Auckland and the rest of the country is very small compared to what we see in almost all European countries’ biggest cities, and in places like New York and San Francisco in the US. All that talk of “one global city” etc simply isn’t reflected in the economic outcomes).

But if the Auckland story is underwhelming – not much sign of leading edge productivity growth etc – here is the same chart for Wellington

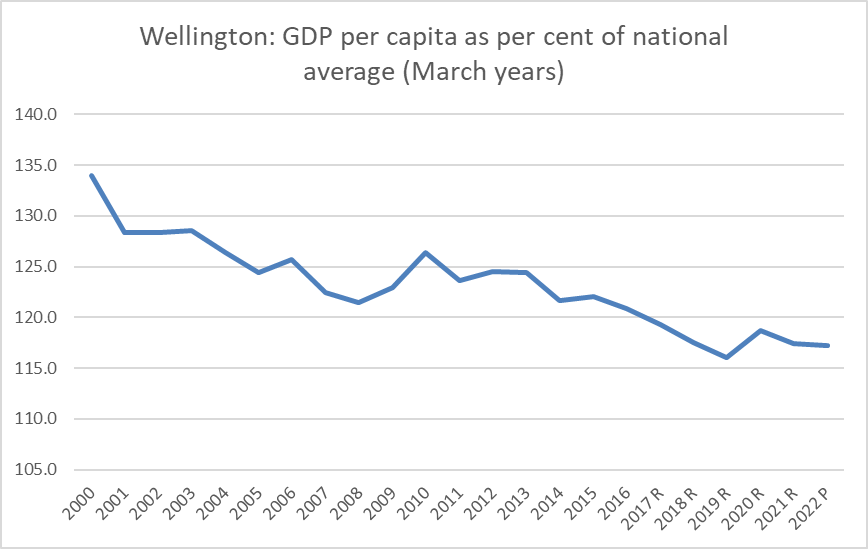
Yes, average GDP per capita is higher than in Auckland (now just), but look at the magnitude and sustained nature of the decline of the century. And a big chunk of Wellington’s GDP isn’t really subject to market tests.

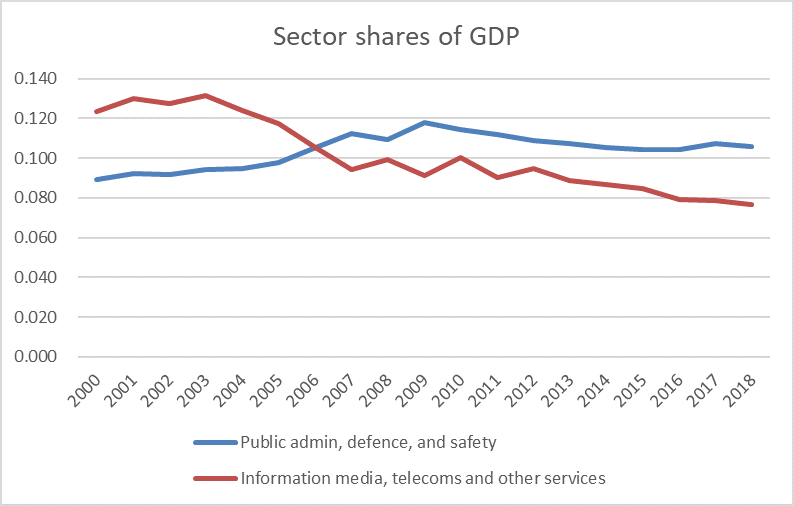
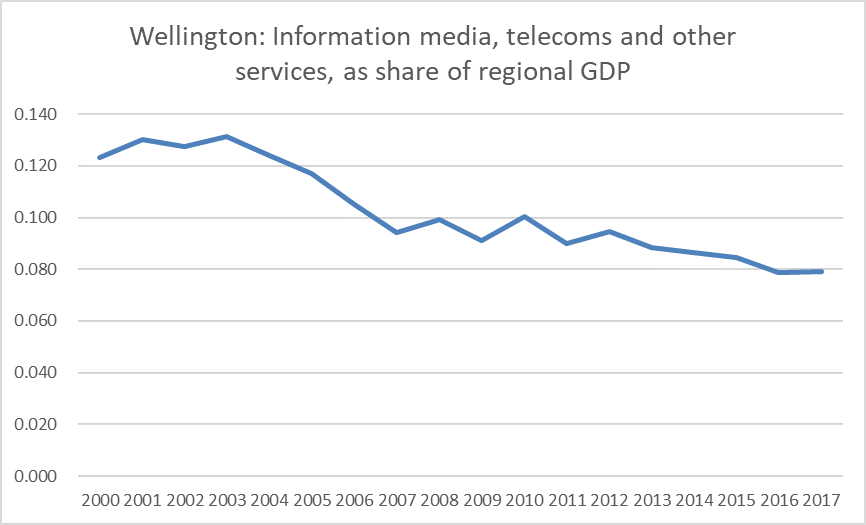
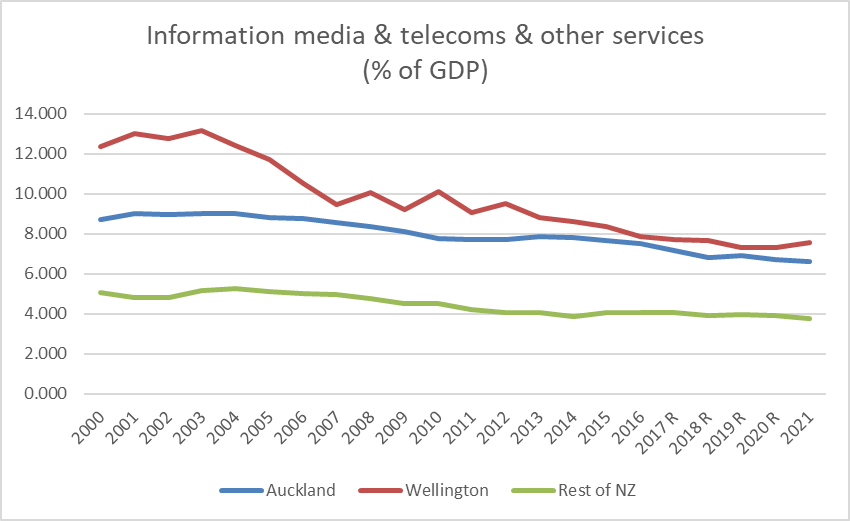
The sectoral GDP data by region lag by a year and the latest data are for the March 2021 year. But here is a time series chart for a couple of key sectors, and one other.

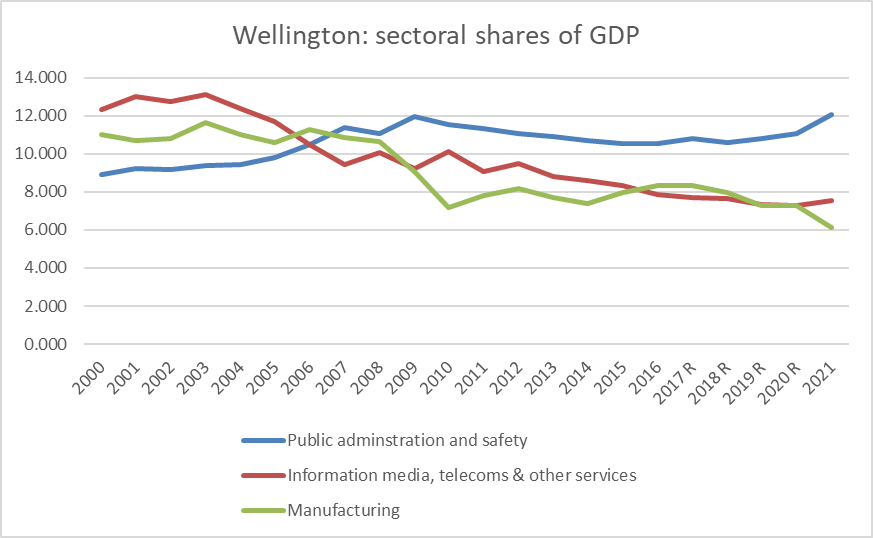
Wellington has become more dependent on core government functions this century, and the category where you might expect to find all those high-tech industries (included the taxpayer subsidised film industry) has shrunk quite considerably as a share of regional GDP (almost as much of a shrinkage as in the share of manufacturing).

That tech-y looking sector has been shrinking as a share of GDP everywhere, and it is still a larger share in Wellington than in Auckland or the rest of the country, but it doesn’t seem like the sort of story the Wellington boosters would like to tell.

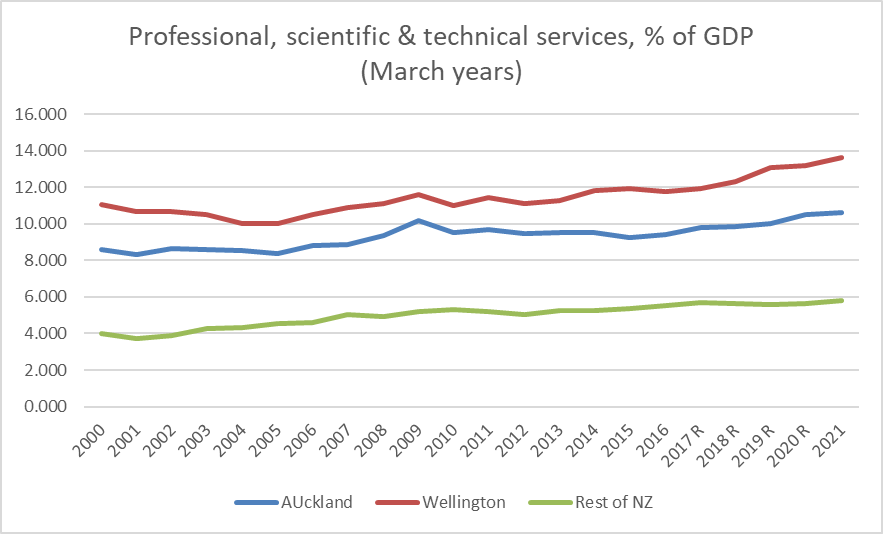
And if Wellington is more of a professional services sort of place than Auckland or the rest of New Zealand (lots of public sector consultancy services being sold?) nothing much about the experience this century stands out either.

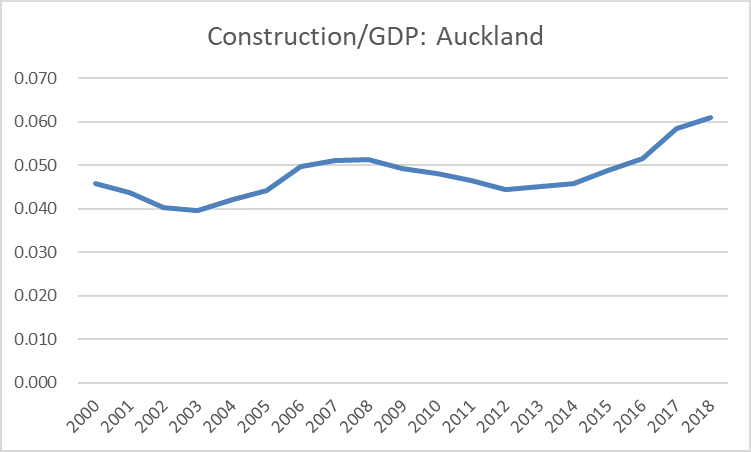
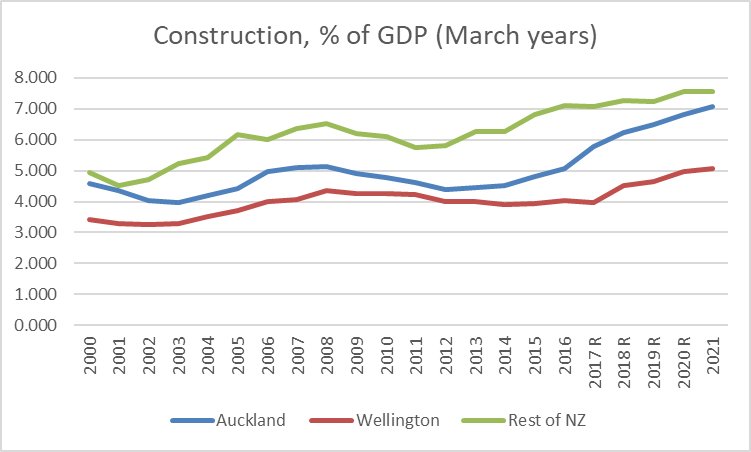
And for those interested, here is the construction sector share of (nominal) GDP

There aren’t any big messages from this post (mostly just the fruit of fossicking in the data) except perhaps the continuation of the regional economic story of this century, the unbroken relative decline in Wellington – whether population, GDP, or GDP per capita, all accompanied by increasingly unaffordable housing, and all despite things like film subsidies and an increasing size of government. Without those twin subsidies, would Wellington have anything more going for it than Dunedin?

Regional economies

Some months ago, when all was coronavirus, Statistics New Zealand released their regional GDP data for the year to March 2019.  I didn’t even open the spreadsheet at the time, but went looking for some data the other day and remembered I hadn’t written about the regional GDP numbers this year.

SNZ has been publishing the regional GDP data, by regional council area, for some time now.  The first data are for the year to March 2000, meaning that we now have 20 annual observations.

Here is how per capita (nominal) GDP for each of the regions relative to national (nominal) GDP per capita has changed since 2000.

regional GDP 20 yrs

I suppose it is convergence of sorts.  Even in the very poorest region –  Northland – per capita GDP has increased very slightly relative to the national average, while the three highest GDP regions (Auckland, Taranaki, and Wellington) have all dropped back relative to the national average.    The gap between the South Island and the North Island has more than halved and –  if one is to believe the numbers –  GDP per capita in Marlborough now isn’t much behind that in Auckland.

I’ve discussed previously the relative underperformance of Auckland.   There aren’t many OECD economies where the biggest city has per capita GDP only about 12 per cent above the national average (let alone where that gap has narrowed this century).  But it is only fair to note that Auckland had been staging something of a recovery. Here is the time series chart of Auckland’s per capita GDP relative to the national average.

auckland GDP

Population surges and associated building tend to be good for Auckland –  but there is no sign of productivity leadership, when per capita incomes in Auckland are still a bit lower (relatively) than they were 20 years ago.  I think it was the economist Andrew Coleman who suggested, only slightly tongue in cheek, that the business of Auckland was building Auckland.  Here is construction as a share of GDP for Auckland (these data lag another year behind).

auckland construction

Having said that, I was a little surprised to stumble on this chart.

akld popn

Of course, if the Auckland economic performance this century has been underwhelming –  especially relative to the rhetoric and political capital invested in talk of our “one global city” (the one just a bit smaller than Columbus, Ohio) it is as nothing compared to the relative decline of Wellington, despite all the puffery from the Wellington City Council, its “economic development” agencies, and the like.  Here is GDP per capita for the Wellington Regional Council area (largely greater Wellington).

Wellington GDP

Recessions might be good for Wellington’s relative position –  not many public servants get laid off in downturns (including the current one) – but otherwise it is a pretty stark and consistent decline.   Wellington’s share of the national population has also been falling steadily – albeit perhaps more slowly than the decline in per capita GDP might suggest was warranted.

At least if you live in Wellington, one often hears talk of the Wellington IT sector and, of course, the heavily-subsidised Wellington film industry.  The regional GDP breakdowns don’t show either directly, but the red line in this chart remains somewhat sobering.

wgtn sectoral

Last year SNZ decided to discontinue its annual screen industry statistics –  claiming (no doubt fairly) budgetary pressures, although it must have been convenient for the government (this one, like its predecessors) keen to talk about the alleged economic benefits of their massive subsidies to the film sector, even as what evidence there is rarely offers much support for their claims.     The last such data came out a year ago for the 2017/18 year.  Here is a snippet from the gross revenue table, by region.

gross film revenue

And here is the same snippet for 2012 and 2013.

gross film rev 2012

So gross revenues of Wellington production and post-production facilities/services –  mostly feature films (unlike Auckland) in the most recent year were not even three-quarters of what they’d been in 2012.

(There is a longer series of earnings for jobs in the total production and post-production sector – including the domestic-oriented bits – of the screen industry: relative to GDP it was no higher at the end of the period than when the series started in 2005. And estimated number of jobs in the sector has gone from 20400 to 20300 over the same longer period.   It looks like a classic infant industry  –  remaining infant and kept going by massive subsidies that keep the rest of us poorer.)

All this is, of course, against a backdrop in which national-level productivity growth remained very weak, and New Zealand continued to drift behind more and more countries that, not too long ago, we never even thought of as relevant comparators.

queen 4


Governing well, or just slowly making us poorer?

I noticed in the Herald this morning Audrey Young’s article running the line that (a) it had been a good  –  in fact, exceptional – week for the government, which had (she claimed) been governing well, and (b) that one example of this was yesterday’s reopening of the Wairoa-Napier railway line.   There was a celebratory article on the reopening in this morning’s Dominion-Post, which might better have been labelled as advertorial, and could easily have been taken straight from Shane Jones’s press secretaries.  It was, after all, only reopened with the (as yet) rather small amount of the Provincial Growth Fund that has actually been spent.  For this particular project, $6.2 million of taxpayers’ money, given to a loss-making SOE that, even running losses, had not itself considered the project viable.

This project was first announced in February 2018 and then I wrote a post about it, under the heading “The boondoggle”.   Here I’m repeating the bulk of that post.

Earlier this week, Kiwirail released its most recent half-yearly financial result. Once again, the taxpayer was poorer for their operations. They make great play of a modest “operating surplus” but I rather liked this summary table from their latest Annual Report

kiwirail1

In other words, no returns to shareholders at all; in fact, losses in one year of a third of the (periodically replenished) shareholders’ funds

Last year, they had operating revenues of $595 million, and an overall loss of $197 million (much the same as the year before). So roughly a quarter of their overall costs are not covered by income. As an organisation – and with all due respect to the energies of individual employees (including the five earning in excess of $500000 per annum) – it has all the appearance of being a sinkhole, absorbing more of the scarce resources of taxpayers each year.

And before people start objecting that roads don’t make a profit, it is worth remembering that airlines do and coastal shipping operations do – and, if they don’t, they usually go out of business.

An organisation that operates such large losses (acquiesced in by successive shareholder governments) clearly isn’t one that applies the most demanding tests possible to the question of whether individual lines should be opened or closed. Occasionally people attempt to justify government intervention in this or that activity on (questionable) grounds that the private sector is applying too high a cost of capital. But in this case, the state operator’s average return on capital (ie over all its operations) is substantially negative, and it has no expectation of changing that.

A few years ago, Kiwirail closed the Gisborne to Napier line. Rail volumes had been low and falling – some trivial portion of the volume that Kiwirail estimated would have been required to make the line viable. But ever since, there have been people hankering for the line to be reopened.

And yesterday, as part of the first wave of projects approved under the new Provincial Growth Fund, the Minister of Regional Development announced that

“We’re also providing $5 million to Kiwirail to reopen the Wairoa-Napier line for logging trains, taking more than 5700 trucks off the road each year.”

In the more detailed material released with the announcement there is a suggestion that the Hawkes Bay Regional Council may also be putting in money.

There is no sign of any cost-benefit analysis of this proposal having been released at all. But we can assume that the proposal wouldn’t pass any standard (weak) Kiwirail commercial test since otherwise Kiwirail would have reopened the line without taxpayers’ having to chip in more money directly.

There used to be some logs/timber carried on the Gisborne-Napier line, but a reader pointed me to the numbers: in the final full three years of operation, a total of 327 tonnes of it. There are, apparently, going to be a lot more logs to move in the coming years. In the Minister’s words

“The wall of wood is expected to reach peak harvest by 2032 so reopening this line will get logging trucks off the road and give those exporting timber options that they currently do not have,” Mr Jones says.
“It makes sense to consolidate that timber in Wairoa and use rail to take it to the Port of Napier.

Except that apparently officials and Kiwrail had already looked at this option a few years ago. In a report released only a few year ago it was noted that

“We note that Kiwirail was not convinced this would be finanically viable for users given the relatively short distance involved and the need to double-handle the logs. Industry feedback has also indicated that transport of logs on rail across the study area was unlikely to be economic.”

Perhaps the economics has suddenly changed? But, if so, where is evidence? None was published yesterday. We aren’t even told what assumptions are being made about how much of the logging business will be captured.

The Minister’s release also argued that there were climate change benefits from this move

“It will also mean 1,292 fewer tonnes of carbon dioxide released into the atmosphere each year.”

Even if this were relevant – don’t we have an ETS supposed to deal directly with pricing emissions? – and accurate (what assumptions are being made, including about the carbon costs of the double-handling?), it sound doesn’t terribly impressive. A single 747 flying to London and back once apparently emits 1100 tonnes of carbon dioxide.

This is just one of the numerous projects the government is going to spend money on in the next few years.

A couple of weeks ago, I commented on the Minister of Finance’s underwhelming exposition of what the government was going to do to transform the productivity outlook in New Zealand. The Minister noted

A major example of this is the Provincial Growth Fund developed as part of our coalition agreement with New Zealand First. This will see significant investments in the regions of New Zealand to grow sustainable and productive job opportunities.

To which my response was

If it ends up less bad than a boondoggle we should probably be grateful. It isn’t the sort of policy that has a great track record, and it is hard to be optimistic that one new minister – with a vote base to maintain – is going to transform the sort of flabby thinking around regional development presented at Treasury late last year.

Sometimes economic policy in this country seems almost designed to defy reason and evidence in an effort to make us poorer, to hold back national productivity prospects. Spraying around $5m here and $5m there – $3 billion over three years, in some scheme reminscent of congressional earmarks in the United States – not backed, it seems, by any robust supporting analysis, seems just another step along that path.

But at least one senior journalist thinks this is an example of governing exceptionally well, making us poorer one earmark and subsidy after another.

There was an interesting range of comments on the earlier post, including some from champions of rail.  Not one attempted to defend the economics of the Wairoa-Napier line, and to anticipate some similar comments this time round here was my response to one commenter, focusing on my key points.

My specific point was two-fold:

1. Even allowing for arguments about the extent to which road use isn’t fully priced (on average – it clearly isn’t fully priced at the margins) other competing transport operators successfully meet the market test (air, coastal shipping). It isn’t immediately obvious why rail freight (the issue here) shouldn’t be held to the same standard

2. Successive govts have been happy for Kiwirail to operate in very low (negative) returns to shareholders – perhaps partly to reflect presumptions around road pricing etc – but even by that undemanding standard, Napier-Wairoa doesn’t appear to be have been viable.

There are various interesting comments to my post. But I haven’t seen any that suggest Napier-Wairoa is an economic proposition. It is still possible, of course, that in fact it is, but then one might have hoped for a cost-benefit analysis to have been (a) done, and (b) published.

And don’t suppose this is the end: in that Dominion-Post article we read this

On whether there was a possibility of extending the line to Gisborne, Jones said any business case would be pushing on an open door.

That might rival light-rail in Wellington for the most uneconomic transport proposal the government could fund.

Looking at the regional GDP numbers

Under this government money from the Provincial Growth Fund has been being flung round like confetti (this was last week’s example), with very little sign of any rigorous evaluation.  It isn’t clear to me whether things are worse under this government than they were before (recall the 13 bridges Simon Bridges was promising in Northland as Minister of Transport, to try to win a by-election) or whether this lot are just “better”
at the branding.   “Regional development” –  with no disciplined sense of what actually shapes economic performance – has certainly been a cause dear to the heart of all recent governments (and their MBIE bureaucrats).

SNZ yesterday released the annual regional GDP numbers.   As ever, these  numbers aren’t perfect –  nominal not real, and prone to revisions for several years –  but they are lot better than nothing, which is what we had until almost 20 years ago.

The Provincial Growth Fund seems to have been particularly concentrating its confetti in Northland, Gisborne, and the West Coast.  The Northland and Gisborne regions are estimated to have the lowest average GDP per capita in New Zealand (at about 70 per cent of the national figure).  As it happens, the West Coast doesn’t do too badly, with average GDP per capita 84 per cent of the national average in the year to March 2018.  Manawatu-Wanganui and Hawke’s Bay round out the bottom five regions (with average GDP per capita less than that on the West Coast).

The regional GDP data have been available since the year to March 2000.  Over the period since then, three of those five regions have had faster growth in per capita GDP than the national average (and by very substantial margins in Northland and the West Coast).  All five have recorded faster growth than Auckland and Wellington.  And if one goes back to 2000, one of the poorest five regions then was the Bay of Plenty, but it has recorded such fast (per capita) growth since 2000 that it has overtaken not just Hawke’s Bay but also Tasman-Nelson.

The picture is a bit less positive if one takes just the last decade, but even over that period growth in per capita incomes is estimated to have been stronger in Hawke’s Bay and Gisborne than in the country as a whole.

As a matter of interest, I also had a look at the unemployment data.  The regional data from the HLFS arem’t reported for the same groupings as the regional GDP data, but here is one chart I constructed.

regional U rates

Even at its worst this decade, the gap between the two lines wasn’t as large as it was 20 years ago.  Last year, it was almost as low as it has ever been.  Involuntary unemployment is a blight on lives wherever it is found, but these particular regions don’t seem to have been doing too badly.

Meanwhile, any guesses as to which regions had the slowest growth in average GDP per capita over the entire period from 2000 to 2018?

Wellington was worst, followed by Auckland as second-worst.

akld wgtn shares

The two regions combined have recorded a material increase in their share of national population, and yet their share of total GDP is unchanged (actually down very marginally).

What about Auckland alone?  If the picture is less dramatic than for Wellington, Auckland matters much more, due to sheer size (and population growth, actual and projected) Here is the latest version of a chart I’ve shown in previous years.

akld gdp pc to 18

It certainly isn’t monotonic.  There are reasonably good phases (which look to coincide with building booms in Auckland) and really bad ones, but there is no sign of the longer-term trend reversing.   An even-greater share of the population is in Auckland, and average output per person in Auckland is growing more slowly than in most of the rest of the country.  In high-performing economies –  at least those relying on something other than really abundant mineral resources –  the picture is typically the other way round.  Big city GDP per capita is typically much higher than in the rest of the country, and in most cases that margin is widening.  But not in Auckland.

Any why is Auckland’s population growing so rapidly when its economic performance has been unimpressive (to say the least).  That’s down to immigration policy.  That isn’t really a debateable point: the data show that (net) New Zealanders have been moving away from Auckland.  This chart was taken from a Treasury working paper I wrote about last year.

tsy akld popn

Our large-scale non-citizen immigration policy –  with targets not exceeded in per capita terms in any other OECD country –  is a practical centrepiece of the economic strategy of successive New Zealand governments.   You don’t hear the phrase now, but it is only a few years ago that MBIE openly talked of the policy as a “critical economic enabler“.  With the best will in the world no doubt, “critical economic disabler” would be a fairer description of the role immigration has played for decades (probably going back all the way to the post World War Two period).  It isn’t the fault of the immigrants –  simply looking for the best for themselves and their families –  but of successive governments and their officials.  They are particularly culpable as the evidence has mounted that their strategy simply is not producing the desired economic results.

The story in Wellington is different of course, but probably no less telling.  Here, local government likes to talk up the idea of a city built on high tech industries.   Central government likes that talk, and also throws (lots of) money at the film industry.    The information in the regional GDP tables doesn’t give a full picture, but there is a line for the component of GDP labelled “Information, media and telecommunications and other services”.  Here is the share of that sector in Wellington’s GDP.

wgtn ICT

Even in Auckland, the share of that sector has been falling –  so there may be something structural around, say, the falling real price of telecommunications going on  –  but nothing like as steep as that fall in Wellington.

New Zealand does macro policy reasonably well –  fiscal policy and (for all my various criticisms at the margin) monetary policy – but our structural policies are set for failure, and in delivering continued underperformance, are doing just that.    The immigration policies pursued by successive governments simply take no account of either our experience (70 years of ongoing relative decline) or our most unpropitious location.   If –  as I noted yesterday –  this is a bad place for basing outward-oriented business (and revealed preference suggests that is so), it is a bad place for governments to engage in “population planning”, importing large numbers of people.  One of the fastest population growth rates in the OECD combined with one of the poorest economic performances should be telling anyone with ears to hear (not our politicians) something important.  The specific relative failure of Auckland just makes that message more stark.


Another champion of regional development policy

Yesterday the Productivity Commission hosted a seminar at which the Maxim Institute’s Julian Wood presented his ideas on regional development policy.  The Maxim Institute is a policy think-tank, often seen as towards the conservative end of the spectrum, based in Auckland, and over recent months they have published a couple of papers on related issues.  The second of these Taking the Right Risks: Working Together to Revitalise our Regionswas the focus of yesterday’s presentation.

(The seminar ran under Chatham House rules, which means I can’t name the person who championed the success of planning in Auckland, and lamented that we don’t yet have such a plan in Wellington.)

Wood –  a former Department of Labour researcher and policy analyst –  began his presentation with this chart from the first of the two papers.

wood popn

The first panel highlights the TLAs where population has been static or is estimated to have fallen between 2013 and 2018, and the second panel is the projections in 25 years time (2038 to 2043) from the SNZ subnational population projections.  On those numbers, the national population will still be growing quite a bit, but most TLAs would be seeing flat or falling populations.   These numbers apparently excite a lot of interest in provincial New Zealand –  or at least in the local authorities and local “economic development” agencies.  There is, we are told, much gnashing of teeth.

It isn’t entirely clear why.  In most cases, the places with (projected) flat or falling population 25 years hence, “flat” is more accurate a description than falling, and most of the projected falls are pretty small (eg a couple of per cent over five years).   Taking the full 30 year period, from 2013 to 2043, TLAs that have currently less than 5 per cent of New Zealand’s population are expected to shrink in population over the 30 year horizon.  And given that New Zealand fertility rates are now well below replacement (about 1.81 children per woman), a future of fairly flat or falling populations seems like one that New Zealanders individually are happy to contemplate.  It is, after all, the situation now in much of the advanced world.   There is a handful of TLAs where the population falls projected do look quite stark – eg Kawerau, Opotiki, South Waikato –  and there may be some specific issues for local authorities in those area (especially dealing with central government infrastructure mandates), but it hardly looks like a case for widespread concern.  And it isn’t as if isolated substantial falls in population are a new phenomenon: Taihape’s population now is about half what it was in the 1960s;  Hokitika’s population is not much more than half what it was in the 1860s.

Not only is population decline not a new phenomenon –  even in New Zealand –  but we can, when we look abroad, see that it also isn’t inconsistent with productivity growth and improved material living standards.  Most eastern and central Europe countries have flat or falling populations, and those countries are typically doing rather well economically (Japan’s population is also flat or slightly falling, and South Korea’s is rapidly getting to that point, both countries that continue to rack up productivity growth.)

It also wasn’t clear whether Wood was framing his proposed policy responses around the prospect of falling populations in some of these areas or around some perception of poor economic outcomes in some regions at present.   And the two don’t seem well-aligned.  Thus, if we look at the regional GDP numbers, the regional councils with the lowest average per capita GDPs are Northland and Gisborne.  And yet on the SNZ projections, the population of Northland is expected to be 20 per cent higher in 2043 than it was in 2013, and the population of Gisborne is expected to be 6 per cent higher (although falling a bit by the end of the period).  Whatever the issues in those two regions, population doesn’t seem set to be one of them (unless, arguably, too little outward migration to regions offering better opportunities).

But whatever the precise motivation, –  and some of it simply seems to be the advent of Provincial Growth Fund and a dedicated Minister of Regional Development –  Wood (and Maxim) seem keen on the potential of regional development policy (or “customised regional development pathways” harnessing “the great potential benefits of spatial policy tools”).   I came away from the seminar –  and from reading their paper –  no more convinced than I was by the evangelical spiel offered up by a former MBIE staffer at a Treasury lecture on this stuff last year.

There was, as far as I could see, no analysis at all of what the market failures were, and why then there might be a role for active targeted measures, whether taken by central or local government.  And even though one of his key themes was that locations matter, it was striking that the overwhelming bulk of the hundreds of studies he drew from were of experiences in Europe.  Thus, featuring prominently in the paper was a table described as a checklist of indicators of regional growth and decline, explicitly stated as being drawn from European experience.  Among the items on the “indicators of decline” were “an economic base founded on resource exploitation and/or the primary processing of this exploited resource”.   Not only does that substantially describe New Zealand (and Australia) as a whole, but it also specifically describes Taranaki –  the region with the highest average GDP per capita in New Zealand –  and Western Australia (highest GDP per capita in Australia) and Alberta (highest GDP per capita in Canada).   Marlborough –  without oil or coal – had much the same average GDP per capita as Auckland last year (the sort of relative performance one doesn’t see in any EU country).

The author has been around long enough to have a certain scepticism.  As he notes

Spatial policy introduces “serious risks” like “misallocating resources, creating a dependency culture and favouring rent-seekers over innovators.” Even the Minister of Regional Economic Development has outlined that the new Provincial Growth Fund is a “bloody big risk…”

But in any rational calculus, big risks require a reasonable prospect of big rewards to make the punt worthwhile.   And nothing in the report suggests any real basis for confidence that such rewards are in prospect, no matter how well targeted, designed, and governed the interventions are.   The author knows the pitfalls –  and so he can write sensibly about the need for clear and explicit goals, for a heavy investment in evaluation, for a governance model that blends top-down and bottom-up perspectives, and also about the need to recognise that any experimentation involves allowing for the possibility of individual failures.

But as I listened to him talk, and as I read the paper later, I was still at a loss to know what he really favoured.  There was enthusiastic talk of R&D tax credits –  including by reference to Israel, a country with as poor a productivity performance as our own –  but nothing to indicate why such a measure was particularly suited to regional development (let alone any analysis of why firms don’t find spending on R&D more attractive).    There seemed to be some enthusiasm for immigration, although he knows some of the caveats there.  Weirdly, the concluding paragraph of his entire “smart growth” section is all about labour supply –  which seems mostly to put the cart before the horse, as people will typically be ready to move to where the opportunities are (indeed if the opportunities are in the provinces, more of their own talented young people will stay or come back).  And any policy approach which includes as one of its key items –  as this one does –  requiring local authorities to include even more pages in their long-term planning documents (vapid enough anyway) will struggle to be taken seriously, at least outside government departments.

My own take on these issues is that people who talk about regional development –  whether under the previous government or the current one –  are usually looking in the wrong place.  There seems to be a knee-jerk political need to “do something” and to be seen to do something, even when the action isn’t based on robust analysis specific to New Zealand (and thus the laudable call for good governance, careful targeting etc is mostly a forelorn hope, whistling in the wind).    I searched both Maxim documents and was struck (if not greatly surprised) to find no reference at all to the way in which the real exchange rate –  persistently high even in the face of our relative productivity decline  and itself a reflection of domestic demand pressures –  has reallocated resources away from the regions (generally with quite export-oriented production bases) to Wellington and (in particular) Auckland.   A real exchange rate that was 30 per cent lower  –  and that is the sort of change implied by real interest differentials –  would make a huge difference to the relative prospects of places like Hawkes Bay, Nelson, Otago, Southland, Gisborne, and so on –  orders of magnitude more so than the best of the smart active initiatives Maxim seems to be calling for.   (I was also struck by the fact that although there were numerous references to tax incentives and R&D tax credits, there was nothing at all about the basic rates of business taxation –  if you want more of something, tax it less heavily.)

But as I look at the New Zealand data, I’m also struck by the way there isn’t an overall New Zealand regional story, and even to the extent there is, the differences between the richest parts of the country and the poorest seem no larger (and generally smaller) than those elsewhere.    I had a look through the EU regional data this morning.  GDP per capita in London, for example, is 150 per cent above that in regions like Durham, South Yorkshire, Lincolnshire, and West Wales.   The margins are almost as large between Paris and some of the outer French regions.   Margins of 100 per cent seem pretty common looking across EU countries.   And what of New Zealand?    Northland and Gisborne last year had average GDP per capita of almost 65 per cent of that of Auckland (and 58 per cent of that of Wellington) –  ie Auckland is about 50 per cent higher than them.   And as I noted above, Marlborough had much the same GDP per capita as Auckland –  and there is nowhere in provincial France, UK or Germany with anything like the average GDP per capita of Paris, London, or Hamburg respectively.

Regional development policy, however cleverly designed or governed, isn’t what this country needs –  arguably it never has been (and Maxim has a nice appendix on past failures).  What it needs is hard-headed policy focused on lifting overall economic performance, notably productivity growth, based on a compelling and carefully scrutinised narrative that explains how we got where we are, not just grabbing bits from some generic OECD handbook, from a need to do something/anything.  In practice, that approach –  adopted in New Zealand for a quarter of a century now, at least –  responds to symptoms not causes, and if it sometimes seems to produce benefits (albeit rarely) it is by chance rather than by the inherent merits of the policy approach.  I suspect that a better-designed set of policies in New Zealand would tend to boost the regions relative to Auckland and Wellington, but that wouldn’t (and shouldn’t) be the goal: the goal should be lifting opportunities for better material living standards for all New Zealanders, and enabling New Zealanders to move to take advantage of those opportunities wherever they are to be found.


A modern, high-value economy

That is what Regional Development minister Shane Jones says Taranaki is “transitioning to”.

And yet of the $20 million of government giveaways (your money and mine) designed

to help future-proof the Taranaki region by diversifying its economy, creating additional jobs and leveraging off the strong base the region has established through its oil, gas and agricultural sectors.

$5 million is going towards earthquake-strengthening a rather attractive provincial Anglican church, recently raised in status to a cathedral (more cathedrals as there are fewer Anglicans), and $13.3 million is going to build walking tracks on Mt Egmont.

It has more of a feel of a museum –  built, and natural –  than building or enhancing a “modern, high value economy” (such things rarely being built –  or enhanced –  by governments splashing cash around).

Perhaps there is a good case for more walking tracks in Taranaki.  I’m not, in principle, opposed.  It is crown land, and needs managing.  Nonetheless, it is hard to think of any country that has got to the global productivity or income frontiers with an emphasis on tourism.

As for the church building, I like it and I’ve worshipped there.   But what about it makes the earthquake strengthening of a private building a matter for national taxpayers to support?   Again, perhaps at least there is an element of consistency –  better perhaps than a government prohibiting demolition and yet not putting any money in.   But how it is consistent with lifting the longer-term economic performance of the economy –  regional or national –  is quite beyond me.

Then again, this seems to be a government that on the one hand isn’t keen on oil and gas, or dairy –  the two biggest outward-focused industries in Taranaki – and on the other isn’t interested in doing anything serious about getting the real exchange rate down.  So perhaps the hope isn’t really that today’s package will do anything much of substance –  certainly not to lift medium-term regional economic performance – but perhaps it might placate the natives for a month or two?


The boondoggle

Earlier this week, Kiwirail released its most recent half-yearly financial result.  Once again, the taxpayer was poorer for their operations.   They make great play of a modest “operating surplus” but I rather liked this summary table from their latest Annual Report

kiwirail

In other words, no returns to shareholders at all; in fact losses in one year of a third of the (periodically replenished) shareholders’ funds

Last year, they had operating revenues of $595 million, and an overall loss of $197 million (much the same as the year before).  So roughly a quarter of their overall costs are not covered by income.   As an organisation –  and with all due respect to the energies of individual employees (including the five earning in excess of $500000 per annum) – it has all the appearance of being a sinkhole, absorbing more of the scarce resources of taxpayers each year.

And before people start objecting that roads don’t make a profit, it is worth remembering that airlines do and coastal shipping operations do –  and, if they don’t, they usually go out of business.

An organisation that operates such large losses (acquiesced in by successive shareholder governments) clearly isn’t one that applies the most demanding tests possible to the question of whether individual lines should be opened or closed.  Occasionally people attempt to justify government intervention in this or that activity on (questionable) grounds that the private sector is applying too high a cost of capital.  But in this case, the state operator’s average return on capital (ie over all its operations) is substantially negative, and it has no expectation of changing that.

A few years ago, Kiwirail closed the Gisborne to Napier line.  Rail volumes had been low and falling –  some trivial portion of the volume that Kiwirail estimated would have been required to make the line viable.  But ever since, there have been people hankering for the line to be reopened.

And yesterday, as part of the first wave of projects approved under the new Provincial Growth Fund, the Minister of Regional Development announced that

“We’re also providing $5 million to Kiwirail to reopen the Wairoa-Napier line for logging trains, taking more than 5700 trucks off the road each year.”

 In the more detailed material released with the announcement there is a suggestion that the Hawkes Bay Regional Council may also be putting in money.

There is no sign of any cost-benefit analysis of this proposal having been released at all. But we can assume that the proposal wouldn’t pass any standard (weak) Kiwirail commercial test since otherwise Kiwirail would have reopened the line without taxpayers’ having to chip in more money directly.

There used to be some logs/timber carried on the Gisborne-Napier line, but a reader pointed me to the numbers: in the final full three years of operation, a total of 327 tonnes of it.

There are, apparently, going to be a lot more logs to move in the coming years.  In the Minister’s words

“The wall of wood is expected to reach peak harvest by 2032 so reopening this line will get logging trucks off the road and give those exporting timber options that they currently do not have,” Mr Jones says.

“It makes sense to consolidate that timber in Wairoa and use rail to take it to the Port of Napier.

Except that apparently officials and Kiwrail had already looked at this option a few years ago.  In a report released only a few year ago it was noted that

“We note that Kiwirail was not convinced this would be finanically viable for users given the relatively short distance involved and the need to double-handle the logs.  Industry feedback has also indicated that transport of logs on rail across the study area was unlikely to be economic.”

Perhaps the economics has suddenly changed?  But, if so, where is evidence?  None was published yesterday.   We aren’t even told what assumptions are being made about how much of the logging business will be captured.

The Minister’s release also argued that there were climate change benefits from this move

“It will also mean 1,292 fewer tonnes of carbon dioxide released into the atmosphere each year.”

Even if this were relevant –  don’t we have an ETS supposed to deal directly with pricing emissions? –  and accurate (what assumptions are being made, including about the carbon costs of the double-handling?), it sound doesn’t terribly impressive.  A single 747 flying to London and back once apparently emits 1100 tonnes of carbon dioxide.

This is just one of the numerous projects the government is going to spend money on in the next few years.  I’ve only looked through the Gisborne/Hawke’s Bay list, and none of it fills me any confidence.   What, for example, is central government doing on this?

The Provincial Growth Fund will provide $2.3 million to redevelop the Gisborne Inner Harbour as part of a wider tourism investment programme.

If, as the Minister claims,

“Tairāwhiti is brimming with potential and untapped opportunities

you would have to wonder why the private sector, and the local authorities, don’t seem to think them worth spending money on.  (On my story, a materially lower real exchange rate would help quite a bit, but the government shows no sign of addressing that.)

A couple of weeks ago, I commented on the Minister of Finance’s underwhelming exposition of what the government was going to do to transform the productivity outlook in New Zealand.   The Minister noted

A major example of this is the Provincial Growth Fund developed as part of our coalition agreement with New Zealand First.  This will see significant investments in the regions of New Zealand to grow sustainable and productive job opportunities.

To which my response was

If it ends up less bad than a boondoggle we should probably be grateful.  It isn’t the sort of policy that has a great track record, and it is hard to be optimistic that one new minister –  with a vote base to maintain –  is going to transform the sort of flabby thinking around regional development presented at Treasury late last year.  

hen again, the Secretary to the Treasury might quite like the idea of paying to reopen the Napier-Wairoa line.  I’ve told previously the story of Gabs Makhlouf, fresh off the plane from the UK, lamenting that the one thing New Zealand hadn’t sufficiently taken from the British Empire experience was to invest more heavily in rail (in response, assembled Treasury officials were not quite being sure where to look).

Sometimes economic policy in this country seems almost designed to defy reason and evidence in an effort to make us poorer, to hold back national productivity prospects.  Spraying around $5m here and $5m there –  $3 billion over three years, in some scheme reminscent of congressional earmarks in the United States – not backed, it seems, by any robust supporting analysis, seems just another  step along that path.

Things busy bureaucrats do all day

When I was very young one of the picture books I enjoyed –  favourably reviewed, so I see now, even by the New Yorker – was Richard Scarry’s What do people do all day?  Set in Busytown, there was a pervasive sense of activity and, well, busyness.  I don’t think the book had a separate entry for government policy advisers, but the book came to mind as I reflected on a Treasury guest lecture I went to yesterday.

A recently-retired MBIE official had been invited by Treasury to share her experiences of 10 years in the regional economic development wing of MBIE (or its predecessor the Ministry of Economic Development (MED)), and the title of the lecture was “The Great Cat Muster”.     At the start of the lecture she asked us to observe Chatham House rules, by which she meant that anything she said could be reported, but that she shouldn’t be identified.  I’m not sure why, when the flyer for the presentation is easily accessible on Treasury’s website, but for my purposes the presenter’s name probably isn’t very important.  The worry is that her content epitomised a cast of mind that can too easily pervade official bureaucracies.   As I summed it up last night to another attendee “all that energy and good intention, with so little of an analytical framework and even less evidence”.

We weren’t off to a good start when she briefly ran through her various roles in regional development.  In the first of them she had, apparently, been responsible for the West Coast timber settlement. But, as she noted –  and full marks for candour I suppose –  when the NZIER later rated the policy paper on this issue (as they do for a bunch of participating ministries), it scored the worst rating MED had ever achieved.

But most of her time had been spent on more pro-active government initiatives.  There was something called the Food Innovation Network, work on Maori economic development, and then for the last few years work as part of the flagship Regional Growth Programme.  The presenter was clearly pretty passionate about what she’d been doing and the relationships she’d been building.  There was no shortage of energy or ambition.  And no shortage of central Wellington perspectives either.  There were countless working groups, and charts to illustrate complex networks across central government and between arms of central and regional governments.  Meetings abounded, briefing papers multiplied, Air New Zealand profited from frequent flights, relationships were built, and sometimes the recalcitrant were called into line, or simply bypassed.   At one point, she even celebrated the “fact” that regional governments had mostly simply chosen to ignore an act of Parliament –  for the greater good no doubt.  And as for the private sector, well……..the government had simply had to be involved in the Food Innovation Network because we had to develop our food industries, and add value to our exports, and they had found that the private sector was “terribly unsophisticated”.

We learned about the regional studies that have been conducted in several areas under the auspices of the Regional Growth Programme, itself initially sponsored by three ministers (and their agencies).  Now there are “action plans” sponsored by even more minister and agencies.   One mayor had apparently finally been convinced by wise officials that one particular product did not represent his district’s economic future.

It was all remarkably busy.   I had to sympathise with the senior manager who, she recounted, had asked her of one programme “can you be sure we can contain this?”.  To which her response had been along the lines of “well, no, I can’t.  You’ll just have to trust me”.

But, since this presentation was being held at The Treasury, and MBIE is purportedly an economic agency, a few simple things struck me as missing.    There was little or no sense of any of the myriad ways in which governments and official agencies fail, and sometimes leave things even worse than when they started.  There was nothing at all, even in passing, on what the market failures might have been to justify all this busyness in pursuit of regional economic development.     Hadn’t we been this way before, numerous times (one of my earliest political memories is of Matai)?   And, for all the busyness, what difference had all this regional development promotion activity actually made.   After all, there had been no national productivity growth for the last five years, and although she several times highlighted the idea of boosting export industries, exports as a share of GDP have been falling.

So when question time came I stuck up my hand and asked what the market failures were, and how different things would have been if none of this activity had gone on.

Her response was that the market failure was “information asymmetries”.  It wasn’t at all clear what she thought she meant by that phrase, but she seemed to have in mind some sense that central government knew stuff people in the regions (private sector or government) didn’t.  Public servants had needed to “explain to regions where they fit in the system”.    That just isn’t what any economist means by the sort of information asymmetry that might –  just possibly, under some circumstances –  warrant government intervention.  But then it got even worse.  She declared that she’d come from a family that didn’t rank public servants very highly, but “I’ve come to realise that public servants see things no one else sees”, and can offer a “strategic perspective”.

She overlooked answering the second part of my question, so when other people had asked their questions, I asked again what difference all this regional development promotion activity had actually made.  And there was a brief moment of dawning unease: “I sometimes ask myself that”.  She went on to claim that the effects can’t necessarily be quantified by statistics, and that the gains might take more than a few years to realise, but that if we didn’t “do something” we’d see the eventual effects of that.

What stunned me, in someone invited to give such a public lecture at Treasury, was the lack of any rigour, the lack of any robust framework, around all this effort.  Not that many years ago, we’d have counted on The Treasury to be particular intolerant of such, apparently, woolly enthusiasm (at the taxpayer’s expense).  But no longer?  I’d like to think that somewhere in MBIE or Treasury there is a somewhat more hard-headed assessment and evaluation going on, but….it wasn’t on display yesterday.

(And, as one other sceptical attendee described it to me, most of the other attendees –  I suspect mostly public servants –  appeared to be “lapping it up”. I really hope that assessment is wrong, but there were no other sceptical questions from the floor.)

In a way, perhaps, one of the MBIE staff in the audience summed up, unwittingly, the problem with much of this.  He noted that they have “been focused on the levers we can pull easily”, while ignoring others.  And with, it seems, no hard-headed analysis as to whether levers MBIE can’t pull might be considerably more important than those they can –  I think, most notably, of the real exchange rate.

And what of the regional economies?  How have they been doing?  To have listened to the presentation one might have supposed they were wastelands of poverty and economic failure, remarkably different from the urban centres of Auckland, Wellington and Christchurch.

But the data don’t really seem to back up that sort of story.  Take the unemployment rate for example.  Here is a chart showing the median unemployment rate for the regional council areas other than Auckland, Wellington and Christchurch against the unemployment rate for Auckland.

regional U

For most of the last decade, Auckland’s unemployment rate has been a bit above that in the median non-urban region (even though theory typically predicts that a big urban area will typically have a slightly lower unemployment rate –  skill matching is a bit easier in a deeper market).

Or the same chart for the employment rate.

employment rate regions

For the last 15 years, the employment rate in the median region has typically been a touch higher than that in Auckland.

What about regional GDP? In earlier posts, I’ve pointed out that Auckland has been seriously underperforming relative to the rest of New Zealand: not only is GDP per capita relative to the rest of the country low compared to what we see for big cities in typical advanced countries, but that margin has been shrinking since 2000.    The flipside of that, of course, is that the non-Auckland bits of the country have been doing okay on this measure (not absolutely –  New Zealand’s overall productivity record is poor –  but better than Auckland).

This chart shows the GDP per capita of the median non-urban region relative to GDP per capita in Auckland (I could have used the median of the three big urban areas, but in every single year Auckland was the median).

regional GDP regions vs akld.png

In the last couple of years –  for which SNZ still label the data provisional –  the median region has lost a bit of ground relative to Auckland (big building booms to accommodate population surges tend to do that), but (a) over the last decade the regions have lost no ground, and (b) over the full period since 2000 they’ve made quite a bit of ground on Auckland.

There just doesn’t seem to be much in the data to warrant government regional economic development programmes, even if one believed –  as I don’t – that such programmes might make any material useful difference to economic outcomes.   Markets work when governments let them, and governments are better advised to focus on getting the overall parameters of economic policy set right –  tax rates, regulation, even immigration policy –  and let activity then occur where it will.  The private sector won’t typically or consistently be slow to seize opportunities, and when they get things wrong mostly they are the ones who live with the consequences.  When officials and ministers spend lots of our money on busy programmes signifying much and accomplishing little, then not so much.

Looking through the glossy document MBIE put out (they do those really well), under the auspices of three ministers, it was hard not to conclude that the whole programme had probably been more about being seen to be busy, and shoring up the National vote in the provinces, than about making a material difference to economic performance.