Deputy Governor talking up the economy

On Friday afternoon a reader sent through a copy of a Bloomberg story quoting Geoff Bascand, Deputy Governor, on the health of the New Zealand economy.    As reported, it was pretty upbeat to say the least.   But the foundations for such an upbeat tone seemed more akin to sand than to solid rock.  Storms expose houses built on sand.

This was the opening section of the article

New Zealand’s central bank doesn’t expect its new bank capital rules to present a headwind for the economy, which looks to be near the point of entering a recovery, Deputy Governor Geoff Bascand said.

“We don’t expect major economic impacts” from banks raising their capital buffers, Bascand said in an interview Friday in Wellington. Furthermore, latest developments are “supportive of the story that we’re near or around that turning point” in the economic cycle, he said.

Bascand had been interviewed by Bloomberg’s local reporter, Matthew Brockett, following the announcement on Thursday of the final bank capital decisions: very big increases in required bank capital ratios, even if some portion of that can be met a bit more cheaply than the Governor’s initial proposal had envisaged.  So I guess we should expect spin.  Bascand’s day job is as the senior manager responsible for financial stability, banking regulation etc.  All the advice and the documents published on Thursday emerged from his wing of the Bank.  But he is also a statutory member of the Monetary Policy Committee, with personal responsibility –  with his colleagues –  for actual delivering inflation rates near target, something the Bank hasn’t managed for years now.  For most of that time, the Bank has been consistently too optimistic about the economy, and about the prospects for getting inflation back to target (fluctuating around the target midpoint, perhaps especially in core inflation terms).

I guess the characterisation “doesn’t expect its new bank capital rules to present a headwind for the economy” is the journalist’s, and there is quite a lot of leeway in Bascand’s own words: “we don’t expect major economic impacts”.  If “major” here means “singlehandedly tip the economy into recession” then I suspect everyone would agree, but that shouldn’t be the standard.   The Bank’s own numbers tell us that they think the base level of GDP –  absent crises –  will be lower as a result of the change in the capital rules.  And their modelling effort focuses on the long-term, not the transition.  The headline out of last week’s announcement was that the transition period had been stretched out, from five years in the consultative document to seven years.  But (a) in making decisions now, and in the next couple of years, people will sensibly factor in changes in the regulatory environment that have already been announced (and are final, in the Governor’s words) –  expectations matter, as the Bank often (and rightly) tells us, with its monetary policy hat on and (b) for the big banks a significant chunk of the policy change is frontloaded, because the change in rules to increase risk-weighted assets calculated using internal models to 90 per cent of what would be calculated using the standardised rules happens right at the start.  That change alone is equivalent to a 20 per cent increase in minimum capital.

And it isn’t as if there are no hints of effects already, even before the final decisions were made.  The Governor and Deputy Governor clearly prefer to avoid addressing these data, but the Bank’s own credit conditions survey showed not only that credit conditions (a) have already been tightening, (b) are expected to continue tightening, and (c) respondents ascribe much of that effect to the impact of regulatory changes.

credit 4

Perhaps the banks were just making it up when they responded to this survey?  Perhaps, but the Bank was happy to cite either components of the survey in its recent FSR, just not these awkward ones.

And why wouldn’t much higher capital requirements, in a world where there is no full MM offset (as the Bank itself recognises), no full or immediate scope for disintermediation to entities/channels not subject to the Bank’s rules, constrain credit availability to some extent, especially in the early stages of a multi-year transition period?   And, as the Bank also keeps telling us, the availability of credit is one of lubricants to economic activity.  If credit isn’t as readily available, all else equal economic growth is likely to be dented.

And what about Bascand’s other big claim that indicators are

“supportive of the story that we’re near or around that turning point” in the economic cycle,

Count me sceptical.     At best, what we’ve seen so far might support the possibility of an inflection point.  If you want a nice summary, with charts, I thought last week’s ANZ economics weekly was about right.

It is worth remembering just how subdued economic growth rates have been this decade –  headline, not even per capita –  and that the slowing has been underway for several years.

GDP growth

On the home front, business confidence and related measure seem to have bounced a bit, but aren’t outside the range we’ve seen over the last couple of years  (when actual growth has been falling and low).   Some agricultural products prices are doing very well, but (a) surely the best estimate is that many of these lifts will be shortlived, and (b) debt overhangs and tightening credit constraints locally will limit the extent to which near-term income gains materially increase activity.  Bascand makes quite a bit of the promise of fiscal stimulus, but recall that on the Treasury fiscal impulse indicator there was a fairly substantial fiscal stimulus in the year to June 2019, and growth was low and slowing.

And that is before we start on the rest of the world.  Here is an ANZ chart of growth in world trade and industrial production

ANZ trade

Data out of Europe, Australia, and the PRC (the latter two being the largest New Zealand export markets) have remained pretty downbeat, even as sentiment ebbs and flows at the margin.  The latest Chinese export data offered little encouragement,  And there isn’t much optimism about the US either, with a considerable chunk of US forecasters expecting a recession in the next two years.   And all this against a backdrop in which people (markets in particular) know that there are quite severe limits on how much macro policy can do if a new serious downturn happens.  That alone is likely to engender caution.

The TWI doesn’t move independently of all these domestic and foreign influences, but it is worth noting that it is now a bit higher than it was when the Bank surprised everyone with their 50 basis point OCR cut in August.

TWI dec 19

Perhaps time will prove the Deputy Governor right, but at present I’d suggest his claims should be taken with a considerable pinch of salt.  Things probably aren’t getting worse right now, but it seems heroic –  against the backdrop of both domestic and foreign constraints and headwinds (including those capital changes) to be talking up the idea of a turning point in the economy.    And rather concerning if this is the sort of sentiment shaping the Bank’s monetary policy thinking right now, after a decade in which things have kept disappointing on the downside.   It doesn’t have that “whatever it takes” sound about it, of which we heard quite a bit in the wake of the August OCR cut.  It sounds more like the sort of spin we hear repeatedly from the Minister of Finance and Prime Minister, who go on endlessly about headline GDP growth rates here and abroad, and never once mention how much faster population growth is here than in most advanced countries.

A few weeks ago I wrote a post about the sudden mysterious, but very welcome, appearance of inflation expectations as a factor in the Bank’s storytelling about policy.    For a few weeks the Governor was outspoken in his desire to act boldly to boost inflation expectations, and do what he could to minimise the risk of hitting lower bound constraints in the next downturn.

And then, like the morning mist, all that concern was gone again –  totally absent in the presentation of the latest MPS.   If anything, inflation expectations measures had fallen a bit further from August to November.

I don’t typically pay much attention to the Reserve Bank’s survey measure of household inflation expectations.  Neither, I expect, do they.  But it has been running for a long time now, and the latest numbers –  finally released late last month – look as though they should be a bit troubling for the Bank.

household expecs 19

This series is nowhere near as volatile as the ANZ’s household expectations survey (although, for what it is worth, recent observations in that series have also been pretty low).   It began in the far-flung days when the inflation target was 0 to 2 per cent (centred on 1 per cent) and yet this is the first time ever that household year ahead inflation expectations (median measure) have dropped below 2 per cent.  At one level, that might be welcome –  the series has historically had quite an upward bias –  but when household expectations are converging towards professional and market expectations, and all those are below the 2 per cent target midpoint it shouldn’t be a matter of comfort at all.    This is the sort of drop the Governor claimed (at least in August and September) he was trying to prevent.   In the same survey, respondents are also asked whether they expect inflation to rise, fall, or stay the same over the next year (probably easier to answer than a point estimate).  There too respondents have become less confident that inflation is going to pick up.

For a brief period a few months ago it looked as though the Bank, and the Governor, were really taking seriously the challenges we face, in a context where conventional monetary policy just does not have much more leeway.  More recently, they seem more interested in talking things up again –  keeping pace with the political rhetoric, and perhaps playing defence re the bank capital changes.  A more realistic tone would offer a better chance of getting through tough times with as little damage as possible, including by better preparing firms and households for the risks that arise if the global downturn intensifies, with little monetary policy leeway, the risk of significant policy-induced tightening in credit conditions, and inflation (and particularly at present inflation expectations) falling away.

We are getting very late in the business cycle and we’d be better served by a strongly counter-cyclical central bank, rather than one playing defence for its own (deeply flawed) other policies, and whistling to keep spirits up (and political masters, making decisions about the future of the Bank, happy).  With the sort of mindset on display at present they risk being blindsided by events, in a context where –  as the Governor himself put it only a few months ago –  the costs and consequences of being wrong the other way (inflation gets to say 2.3 per cent) are pretty slight and inconsequential after a decade of such low inflation.

Saving: New Zealand and Australia compared

In a post earlier this week looking at national saving rates across the OECD, I included this chart

net savings aus nz

For the last few years, national saving rates in New Zealand have been higher than those in Australia.  That isn’t the popular perception, and it hasn’t been common in the past –  although for now, the gaps are no larger or more persistent than those recorded for a few years in the 00s.

Before digging behind the numbers, at least a bit, a reminder:

  • these are flow saving rates we are looking at here (the share of the year’s net income accruing to residents of the country in question that is not consumed).   In the case of business savings, the concept is akin to retained earnings from the profits for the year in question
  • I am not looking at stock measures of accumulated wealth, financial assets or anything of the sort.

We can break down these saving rates for each country and see what has been happening in each of the broad sectors: households, governments, and business.   All the charts below are expressed as a share of NNI (rather than of the income of that particular sector).  In each of the charts below, New Zealand data are for March years and Australian data for June years.

First, lets have a look at general government savings

govt s

Every year but one the government savings rate (share of NNI) in New Zealand has been higher than that in Australia.

And that is so even though, diverting briefly to stock numbers, in every single year for which we have data, general government net financial liabilites (loosely, net debt) is larger, as a share of GDP/NNI, in New Zealand than in Australia.  There are probably two main factors at work: first, the size of government here is larger, as a share of the total economy, than in Australia, and second, New Zealand tends to have a relatively large amount of government investment (GFCF) as a share of GDP.

What about households?

Probably to no one’s surprise

household s 2.png

In all but one year, household (net) saving in Australia has been higher, as a per cent of NNI, than that in New Zealand.  The size of the gap between the two series hasn’t changed much over time, and there is little sign that the gap now is consistently larger than it was 30 years ago before the compulsory private savings scheme was introduced in Australia.  Both countries have had fairly rapid rates of population growth over these decades –  although the growth has been concentrated in different periods.  Over long periods of time, you’d expect a country with rapid population growth to have a higher household savings rate than one that doesn’t.   What is, perhaps, interesting about the Australian series is how far the household savings rate has dropped back again in the last few years.

And what about the business saving rate?  In aggregate the picture looks like this

business s.png

For the first decade or so of the data things are much as you’d expect.  Business saving in Australia averaged a bit higher than that in New Zealand, consistent with the fact that business investment rates tend to be higher (partly reflecting the Australian economy concentrating in quite capital intensive sector).  You can, loosely, see some cyclical effects: profits tend to fall away quite sharply in recessions and so, typically, will business savings rates.

But once one gets to this century things become harder to make sense of.  And the Australia numbers seem easier to make sense of than the New Zealand ones: in Australia as the terms of trade surged and huge new mining sector investment opportunities opened up you’d expect firms to be using higher profits and higher retained earnings to finance part of the huge surge in mining investment.  The Australian terms of trade peaked in 2011 and is much lower now.  Mining sector investment is also well past its peak.  Still, I was a bit surprised to see that overall business saving rates are now lower than they were, on average, in the 15 or so years before the terms of trade boom.

But what of New Zealand?  Why did business saving rates surge at the very start of the 00s, and then fall away so sharply –  the amplitude of that fluctuation is larger than for Australia more recently.  Some of it probably had to do with the exchange rate –  which reached a deep trough in 2000 at a time when commodity prices were high.  But it doesn’t really seem like a sufficient explanation.  And that trough was in the year to March 2007, more than a year before the recession really hit.

Despite my inclinations to look on the gloomy side, I’d almost be inclined to think positively about the recent rise in business savings rates –  higher now than they were at any other time in the 1990s –  except that there is little or no sign that these higher saving rates reflect any sense of an abundance of investment opportunities.  Business saving rates in New Zealand may well now be being boosted by the pressure on dairy farmers to use whatever earnings they can generate to pay down debt.

We can use official data to look a little further behind the business saving story, splitting the business saving rate into financial businesses and other businesses. I’m not sure why one would want to –  they are all businesses after all – but as it happened there are some interesting, but puzzling, differences uncovered by doing so.  Note that for New Zealand the data are not yet available for the March 2019 year.  And the New Zealand data are available only for the last 20 years.

Here is financial sector (net) saving

fin.png

and here is the non-financial business sector

non-fin.png

I just don’t know what to make of the earlier years: why would NZ financial sector saving (retained earnings) be so much lower than that in Australia, at precisely the same time non-financial sector business saving was materially higher.  Something doesn’t look quite right (but perhaps it is, and I’d be happy to have any authoritative explanations).

More recently, this decade, the financial sector savings rates have been very similar on both sides of the Tasman: rather what one might expect given that the biggest players here (banks) are also big Australian banks.  But if that is plausible and roughly right, it leaves the business saving rate in the rest of the business sector quite a bit higher here than in Australia.   Which is interesting, and not necessarily what I would have guessed without checking.

I don’t purport to have any particular insights to offer on quite what has been going on.   Digging any deeper would probably require more resources and data that I don’t have.  But it is interesting that the relationship between New Zealand government savings and Australian government saving, and New Zealand and Australian household saving, have been pretty stable for a long time.  The puzzles seem to rest in the business sector data, and unfortunately business saving is quite routinely overlooked when people talk,or think, about saving behaviour in New Zealand.   A Treasury, Reserve Bank or Productivity Commission note might be able to shed more light on developments that we probably should understand better than (at very least) I do.


If you assume policy is powerful, you can justify almost anything

So, what to make of the Governor’s final decisions on bank capital?

If you are a bank or bank shareholder, you are presumably just grateful for small mercies, the modest extent to which the Governor changed his mind and allowed the banks to use cheaper forms of capital to meet the new requirements.   Consistent with that, the share prices of the parent banks recovered some ground yesterday.

Since banks are scared of their regulators and –  both here and in Australia –  are very reluctant to seek judicial review, despite the very strong sense of pre-determination about this process, and the evident failure to engage seriously with substantive concerns raised by submitters, there isn’t much else they can do.  Their behaviour –  willingness to provide credit into this economy –  can, and probably will, adjust.  But if they won’t, or can’t, do anything more about the policy decision, grizzling won’t get them anywhere.  Rightly or wrongly, big banks don’t command much public sympathy.

But I’m neither a bank nor a bank shareholder, so I have some different perspectives.

First, a couple of process-y points out of yesterday.     We learned from the Governor’s press conference that the banks themselves had been briefed on the announcement early yesterday morning at meetings at the Bank.  They had to sign up to a non-disclosure agreement to attend, but once the meeting was over they were allowed to leave and go about their business, hours before the public announcement.  Given that the information they’d been given was highly market-sensitive (as we saw in the movement of both bank share prices and of the exchange rate) this was extraordinarily cavalier on the part of the Bank –  only 3.5 years on from the last lock-up they ran, where systemic failures on their part allowed a leak from the lock-up itself, in turn leading to a discontinuation of regular lockups.

There was also a lock-up for journalists yesterday morning  (who weren’t allowed then to leave before the public announcement, not even if they promised to be on their best behaviour). One journalist told me it was pretty chaotic (adminstratively –  access to power etc), but my real concern is what protocols and procedures were in place that would have prevented the sort of leak we saw in 2016 (which involved a journalist in the lock-up emailing the information back to their office).  Apparently, there was also a non-disclosure agreement, but how much protection would that have been if someone had attempted a repeat of 2016?

One element of yesterday’s announcement that was new, relative to the consultation document, was a commitment to an annual review of how things are going as the new policy takes effect (progressively over the next seven years).  That looks, on paper, quite a reasonable initiative by the Bank, except that……the Bank will be reviewing how a controversial decision they themselves took will be going (more specifically, staff who work to the Governor will report to the Governor their assessment of how the Governor’s own decision is going).   It isn’t exactly a recipe for hard-headed or sceptical evaluation.  It reminds me of the clause that was in the Reserve Bank Act that required us to report in each Monetary Policy Statement on how monetary policy had been conducted – the original intent clearly being some critical self-scrutiny.  The provision fell into disuse, until I persuaded people that we really should follow the law.  A box was added to each MPS to deal with the issue.  Unsurprisingly perhaps, in the almost 15 years since no fault was ever found with any past monetary policy action or choice.    That isn’t really to criticise the individuals involved –  except perhaps Governors: the incentives were just set up badly.    Wouldn’t it be better to have some independently-appointed party evaluating things, perhaps not every year, but halfway through the seven years and at the conclusion of the process?   If, that is, the intent was serious, rather than being mere window-dressing.

But none of those are the big issues that emerge, unaddressed, from yesterday’s decision.  The Bank claims to have another document coming, later in the month, that will articulate how they have responded to various points made in submissions, and why.  Maybe that will offer some useful insight in time (maybe), but for now we have only what they released yesterday, which included a 20 page document on the decisions themselves and a 111 page regulatory impact assessment and cost-benefit analysis.

Much of the latter was fairly much a warmed-over rehash of material they had published earlier in the year.  Believe their numbers and New Zealanders collectively will be about $1.3 billion each and every year better off a result of (being compelled) to take this insurance policy.  That is equal to about 0.4 per cent of GDP, a number which might not sound a lot but (a) is pretty large for an estimate of any microeconomic reform measure, and (b) capitalises up to a very large number (on their preferred discount rate, probably well in excess of $40 billion).

The costs and benefits taken into account in reaching this number include both GDP effects and GNI effects.  Specifically, one area the Bank has greatly improved on in the final document is that it now takes explicit account of the fact that higher bank capital ratios will result in materially higher total dollar profits accruing to foreign shareholders in banks.  This had been an omission Ian Harrison was particularly forceful on in his submissions and papers on the capital proposal.     In other words, some larger proportion of GDP won’t be accruing to New Zealanders, and the cost-benefit analysis rightly focuses on the impact on residents.

Here is the Bank’s helpful summary table.

summary CBA.png

Red effects are costs, while green effects are benefits.  Focus on the costs first.

The first of them is the lower level of GDP (permanently lower) as a result of the higher interest rates estimated to flow from this proposal.    The number  – minus 0.21 per cent of GDP –  is a bit smaller than the Bank estimated in the original documents, consistent with them allowing some of the additional capital to be raised from lower-cost instruments.  We don’t know it with certainty, but there hasn’t been that much argument about this number. I’m happy to work with the Bank’s number, while noting that most of the alternative views are of a larger negative effect, not a smaller one.

The second negative effect is the income (rather than wealth) transfer effect to overseas shareholders.    Again, there is some uncertainty about the precise magnitude of the number, but I doubt anyone will argue very much with the broad scale of the number.  The Bank treats the gross effect and the tax offset as separate items, but on their estimates the after-tax effect is equal to -0.2 per cent of GDP.

Thus, the cost of the insurance policy –  on the Bank’s own estimates –  is equal in total to -0.41 per cent of GDP.  Use their discount rate and plausible assumptions about growth in potential GDP (see my treatment of this earlier), and that is akin to spending a discounted present value $40 billion to buy the insurance the Bank is now compelling us to take.  That’s a pretty pricey policy.  The precise magnitudes of the costs have margins of uncertainty around them, but we are near-guaranteed to be paying a substantial premium each and every year,  as long as this policy is in place  (the current Governor, of course, can’t commit beyond his own terms, and there have been numerous changes in the regulatory environment over the decades).

For that (relatively certain) cost, the (expected) benefits had better be good.     The Bank reckons (with inevitable margins of error) that they are equal to 0.83 per cent of GDP each and every year.    And where do they get that number from?  They assume –  it is simply an assumption –  that by bumping up the capital requirements so much they can  –  singlehandedly –  avert a really serious financial crisis at some point in the future which would have (unaverted) a cumulative output cost of 63 per cent of GDP.

Unfortunately, the Bank shows little sign of having really thought hard about the nature of financial crises or really large nasty economic adjustments.  It is all very abstract and ungrounded. Neither in the earlier consultation documents nor in yesterday’s paper was there any sign that the Bank had sought to distinguish the costs that might arise from a crisis itself as distinct from the prior bad borrowing/lending decisions, and resulting misallocation of resources, that may have predisposed a banking system to a crisis.   Higher capital ratios may be able to do some good in minimising the former costs, but it is very unlikely they will make any useful difference to the latter ones, especially if one is starting from capital ratios already high by modern historical and international standards.  In their defence, they will claim to have taken assumptions from “the literature”, much of which was generated by motivated researchers (often working for central banks) looking to build a case for higher capital ratios.  None of the Bank’s work seems to stand back from the numbers and equations to ask what should be elementary questions (even if not always easy to answer).   I touched on many of these points in my submission, from which here are some extracts.I made these points in my submission.

Linked to this point, there is very little recognition (none in the main document, and very little in subsequent papers) that many or most of the output losses associated (in time) with financial crises have to do with the misallocation of resources (bad lending, bad borrowing, bad investing) in the preceding boom years.  Your documents recognise that one cannot simply measure output losses from a pre-crisis peak (typically a period with a positive output gap) but do not go anywhere near far enough to recognise the significance of this, rather larger, point. In such circumstances, estimates of potential GDP itself may be materially overstated.  As far as I can tell, the research papers you quote are open to the same criticism (which is not a defence for the Bank, but – probably – an indication of the predispositions of many of the chosen researchers and their institutional sponsors).

When an economy and financial system has gone through several years of badly misdirected lending, borrowing, and investment, not only is there an inevitability about output losses because of the bad prior choices crystallising, but there is a near-inevitability about both lenders and borrowers being hesitant about doing new business in the wake of the realisation of past mistakes.  Prior assumptions and business models prove invalid, and it takes time for risk appetite to revive, and to identify like projects that would prove profitable.  That is likely to be so whether or not banks emerge from the crystallisation phase with ample levels of capital.       At best, it is only the marginal additional output losses from banks falling into “crisis” (however defined) that is likely to be eased by much higher initial capital ratios – and yet you made no attempt to distinguish this effect.

The Bank also showed no sign of having done any sort of comparative analysis (of that sort done previously on my blog e.g. here https://croakingcassandra.com/2017/07/06/reservebank-dtis-and-the-cost-of-crises/, or here https://croakingcassandra.com/2019/03/04/banking-crises-are-bolts-from-the-blue/ or by PIIE’s William Cline) comparing the output and/or productivity experiences of countries that underwent financial crises with those that did not.  This is particularly important in thinking through the experience around 2008/09, when many countries experienced crises and many others did not, all overlaid on what appears to have been a common global productivity growth slowdown.     Reasonable people might differ as to how best to do such an adjustment or assessment, but the Bank shows no sign of having even tried.  Any plausible assessment of this sort would, however, conclude that plausible additional output losses saved by reducing the probability of any particular loan book incurring losses large enough to run through capital would be much lower than the estimates the Bank uses.    Note also that the Cline methodology still overstates the amount that higher capital ratios alone might save, since his output path comparisons include (for the crisis countries) both kinds of losses – from the initial misallocation of resources, and the pure crises effects.   Only the latter should be relevant in assessing the costs and benefits of higher minimum capital ratios.

As a simple illustration of some of these points, the US experienced in 2008/09 one of the very worst financial crises in advanced countries for many decades and New Zealand experienced only a very minor financial crisis.  And yet the paths of GDP per capita for the two countries were strikingly similar: both were underwhelming, but it isn’t credible to ascribe all the underperformance of the US economy to financial crisis effects, when various other countries had similar experiences (actually US productivity growth (a) slowed prior to the crisis, and (b) post-crisis has been less poor than in many non-crisis countries, including New Zealand).

A much more plausible estimate of the actual GDP savings as a result of averting the true marginal economic costs of a crisis, might be more like 10 per cent of GDP (and even that is large, especially in a floating exchange rate economy).    Assume GDP is, say, 1.5 per cent lower than otherwise for seven years –  simply as a result of the bank failures, not of the crystallisation of bad decisions pre-crisis – and I reckon you’d have a much sounder basis for evaluating the merits of higher capital ratios.    The Bank didn’t even include a number like that in the range of scenarios they looked at (the lower bound they used was 19 per cent, and yet even so in around 15 per cent of their –  skewed high –  scenarios the benefits weren’t worth the costs we’ll all be paying).

On a similar note –  the Bank showing no sign of actually having thought hard about financial crises, nasty economic adjustments etc, as distinct from dropping numbers in a model –  is the issue of stress tests.  As I and others have pointed out repeatedly, the various stress tests the Bank (and APRA) have run over they years suggest that the banks would come through in pretty good shape even really severe assumed shocks (eg a halving of house prices and a deep and pretty prolonged recession, very large sustained rise in unemployment).   That was with the capital levels banks chose to hold, faced with the minimum capital requirements in place for much of this decade.   We all know, too, that the banks came through just fine the 2008/09 recession, despite a huge credit boom and substantial asset price inflation in the years prior to that recession.  How then can so much higher capital ratios be justified?

As it happens, the Herald yesterday reported that MPs had grilled them on exactly this point as a select committee hearing (on Wednesday) on the latest FSR –  good to see some scrutiny.  Here is how Hamish Rutherford reported what the Governor said

“While they’re interesting tests, they are not a one in 200 year test,” Orr said of the stress tests, theoretical studies of how banks would cope in times of financial or economic strain.   “They’re a one in 50 year test…”

They had a similar line in yesterday’s document

While stress tests are one useful lens on the calibration of capital requirements, there are several reasons why there is no automatic link between the two. First, a given stress scenario will not capture all possible risks facing the banking system, particularly the type of extreme scenario that is being contemplated in the capital ratio calibration of a 1-in-200 year event. The Reserve Bank’s stress tests typically assess a severe but plausible macroeconomic downturn event, the type of which may happen once over a period of several decades. Second, it is difficult to capture the real-world complexities of a financial crisis. Moreover, stress tests only consider the banking system as it is currently. As a result, stress tests did not play a strong role in determining 16 percent as the capital ratio required to deliver a 1-in-200 year risk appetite.

Frankly, it is almost nonsensical –  perhaps worse, intentionally –  to suggest that the sorts of shocks applied to the Australian and New Zealand banking system in these stress tests are no more than “once in several decade events”.    As I’ve pointed out on several occasions –  and the Bank has not sought to rebut – there is no example of a modern floating exchange rate economy (and floating matters in the ability to absorb shocks) in which the unemployment has risen by 8 percentage points.  There is no example in modern times in which real and nominal house prices have fallen materially more than the sorts of shocks the Bank assumed.  And although modern history doesn’t encompass 200 years, it encompasses 40 or 50 years experience for perhaps 30 advanced economies (1200 or more annual –  but somewhat correlated of course –  observations).

If these aren’t the sort of shocks the Governor has in mind when he thinks of his 1 in 200 year event, perhaps he could tell quite what such an event looks like?  So far, through all the consultation documents, there has been no hint of that characterisation.    He can’t, surely, have in mind a rerun of the Great Depression –  largely a consequence of pre-modern monetary mismanagement, in a climate of fixed exchange rates.  If not, then precisely what sort of historical event –  or even what sort of stylised event –  is he making us pay this huge premium to try to avert?

When he simply refuses to tell us, reasonable people might reasonably fall back on the very stringent stress tests –  and all those new supervisors he tells us he plans to hire –  to suggest that some of the highest effective capital ratios in the world (right now) are about all the (capital) insurance we probably need.  The Governor noted yesterday the banks tend to hold less capital than is socially optimal, which happens because a pattern of government bailouts encourages those who deal with banks to believe they’ll happen again (viz, most recently here AMI).  But we’ve had minimum regulatory capital ratios in place for decades now, so simply asserting that –  left to themselves – (big) banks might hold less capital than is optimal, tells us nothing about the merits of further increases from the current starting point.

There are plenty of other points I could raise. For example, the Bank depends their discount rate on the grounds it is consistent with the literature, without ever acknowledging that New Zealand interest rates are consistently higher than those in other advanced countries –  still true today.

But the final main point I wanted to note was around international comparisons (or, rather, lack of them).   Right through the year, from the first release of the consultative document to the documents supporting the final decisions yesterday, the Bank has never attempted to provide a robust comparison of its own capital proposals (now decisions) with the capital requirements in other similar advanced countries.  That is particularly extraordinary in the case of the Australia, given that our big banks are all subsidiaries of Australian parents and also affected by APRA’s capital requirements.  It should have been a simple and straightforward matter to have

(a) illustrated the headline differences in the minimum ratios APRA proposes and those the Reserve Bank has chosen,

(b) adjusted for the higher floor the Reserve Bank is choosing to apply (risk-weighted assets for IRB banks will have to be no less than about 90 per cent of what the standardised approach would imply, a much higher floor than used elsewhere, and

(c) to have provided a compelling rationale for the resulting (substantial difference).

Here is a quote from an article in this morning’s Australian

The New Zealand reforms require the big four banks to have tier one capital of at least 16 per cent of risk-weighted assets, and total capital of at least 18 per cent. Of the 18 per cent, at least 13.5 per cent will be common equity tier one (CET1) capital of the highest quality, with other tier one capital including redeemable preference shares contributing 2.5 per cent, and tier two capital including long-term subordinated debt accounting for a further 2 per cent. In comparison, Australian rules require banks to have a CET1 capital of 10.5 per cent.

It is a substantially more onerous regime here, with the differences further widened by the differences in the floors in place for IRB bank risk-weighted asset calculations (all else equal, the difference could be as much as another 2.5 percentage points of CET1 capital).  These are huge differences, never articulated by the Bank and never persuasively defended –  even though, for examples, our banks have large (well-capitalised) parents, and the Australian parents/groups do not.

At FEC the other day, the Deputy Governor attempted to defend the extreme caution

Asked whether the idea of coping with one in 200 year storms was too conservative, deputy governor Geoff Bascand said New Zealand was subject to “an enormous array of shocks”.

“Obviously seismic [shocks], but also as a small, open, trading economy with very high debt levels, we’re exposed to international shocks of potentially great momentum, and so a high level of resilience has some real worth to it.

Bascand has previously tried to claim that New Zealand is materially more risky than Australia –  a claim I rebutted here and here.   I didn’t see the specific claim repeated in yesterday’s document.  Instead, in effect they fall back on bluff and obfuscation, by simply not providing good robust international comparisons, not attempting to justify their stance, and hoping no one much notices.

All this, an enormously expensive additional insurance policy, in a banking system that is already sound and well-capitalised, really does end up looking as though we will pay the (high) price for nothing more than a gubernatoral whim.

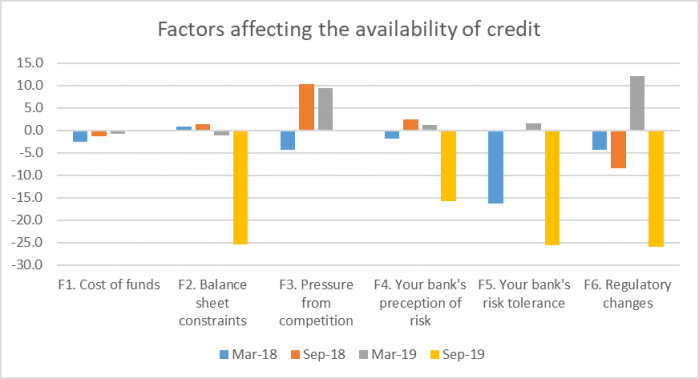
(On a final note, for all the talk of seven year transition periods, remember that firms (banks) will adjust their behaviour based on expectations, now knowing the essence of  the regulatory environment they will face in New Zealand for the next few (Orr) years.  We’d already seen in the Bank’s credit conditions survey that conditions are already tightening, largely due to regulatory factors –  points not addressed yesterday or in the FSR.  We should continue to expect to see the largest transition –  actual scale and distribution uncertain –  in the next year or two, not somehow evenly spread over the coming seven years.)


As we await the Governor’s final decision

At midday the Governor of the Reserve Bank will descend from the mountain-top, having communed with himself for some months, and tell us how much more capital locally-incorporated banks will have to hold for each dollar of (risk-weighted) assets.

It is one of the more stark of the democratic deficits in the current Reserve Bank law –  which grew like topsy over the years –  that a single unelected official, largely appointed by more unelected part-timers,  has the unchallengeable power to make such far-reaching decisions, when there is no shared agreement about the appropriate goal policy should be set to meet, no shared agreement on the relevant models of the economy and financial system, and no ongoing accountability for whether this single individual’s choices end up effectively serving the public interest.  Instead, we are left with one individual’s whims – in this case, an individual without even much in-depth expertise or long well-regarded professional experience – and one individual’s personal views of “the public interest”.    Usually, that is the sort of thing we hire/elect politicians for, including because we have recourse –  we can toss them, and their party, out again.

With a better Governor and a better institution beneath/behind him, the legislative framework would still be deeply flawed in principle.  In practice, it might matter rather less.    But instead we have a relatively inexperienced Governor, a similarly inexperienced (in banking, financial stability and associated regulation) Deputy Governor and a fairly weak bench as well.  Search the Reserve Bank’s publications and you will find precisely no serious research or analysis on issues relevant to financial stability or bank regulation.  That isn’t the fault of individual staff, but of choices of successive waves of senior management.  Key management figures are widely known for their aggressive, but insular, approach, and it is only a couple of years since the independent stakeholder survey of the Reserve Bank as regulator produced damning results.   Regulatory capture is often a big concern the public should have about regulatory agencies, and that seems unlikely to be the Reserve Bank’s particular problem.   But analytical excellence, an open and consultative approach, willingness to engage, listen, and reflect, willingness to work effectively with others, are the sorts of areas where the Reserve Bank falls well short.  A system where the Governor is prosecutor, judge and jury in his own case, with no feasible rights of appeal, doesn’t conduce to things being better than they are.

And thus we come back to the Governor’s proposals for markedly increasing bank capital.   These were launched a few days short of a year ago.  There had been no working level technical consultation or wider socialisation of analysis and research on any dimension of the issues.  There was no cost-benefit analysis –  in fact, there still isn’t, we only finally get to see one today and can be sure that will have been artfully constructed to support the Governor’s decision.  As the background papers finally came out it emerged that the 1 in 200 year framework had been chosen at the very last minute.  There was no evidence of close engagement with APRA, despite (a) most of the major banks being subsidiaries of Australian banks, (b) economic and financial risks being similar, and (c) APRA having greater depth and expertise.   To this day we’ve had no serious analysis comparing and contrasting effective capital requirements here and in Australia.

And so it has gone on.  The Bank did publish a few more papers designed to support their case.  They very belatedly hired some hand-picked chosen overseas experts to give the Governor’s plans a tick –  people with no expertise specific to New Zealand.  And even then the ticks weren’t exactly ringing endorsements –  recall David Miles noting that one could grosly over-specify a bridge, or employ engineeers to do regular inspections and assessments.   We’ve had the odd speech –  although never once a serious effort from the Governor, the sole decisionmaker –  including, most recently, the half-hearted ill-supported attempt by the Deputy Governor to claim that New Zealand was much riskier than Australia.  But no indications of any serious engagement with people who had lodged submissions raising technical points of one sort or another on the proposal.

And then, of course, there was the Governor’s style.    There were the attempts –  open and public –  by the Governor to suggest that anyone who disagreed with him was “bought and paid for”, in league with the banks.   Even if it were true –  which it demonstrably wasn’t –  isn’t the onus on a decent policymaker, particular such a powerful one, to engage on the substance and to show where and why someone with an alternative perspective might be wrong.

And then you might recall the succession of Stuff articles on other aspects of how the Governor has been operating this year.

The video of the conference remains on the Reserve Bank’s website. Some reporters said they were stunned Orr would air his anger so publicly and called it bullying.

But other observers were not surprised. Details of Lubberink’s experience were already circulating in Wellington and industry sources say they match a pattern of hectoring by Orr of those who question the Reserve Bank’s plan.

“There is a pattern of [Orr] publicly belittling and berating people who disagree with him, at conferences, on the sidelines of financial industry events,” said one source who’s been involved in making submissions to the Reserve Bank on the capital proposal.

There have also been angry weekend phone calls made by Orr to submitters he doesn’t agree with.

“I’m worried about what he’s doing.”

The source said some companies have “withheld submissions,” for fear of being targeted by Orr.

“They’re absolutely scared of repercussions. It’s genuinely disturbing,” he said.

and

In the cut and thrust of the debate, Orr’s jokey style and everyman charisma fell away. In recent months he’s dogmatically insisted the cost of his plan would be minimal and has picked personally at critics in the media, academia, and the financial services industry.

He’s been variously described as defensive, bullying, and perilously close to abusing his power.

“He’s in danger of bringing scorn on his office,” said long-time industry watcher David Tripe, professor of banking at Massey University. “I used to know him well. I no longer feel so confident.”

Or the strange statement the Governor corralled his entire senior management to sign, rejecting attacks on Bank staff –  and thus attempting to play distraction, since most of the concerns were about the Governor himself and his (now) handpicked senior management.

(As I’ve noted previously, I don’t have a personal dog in this fight.  If he has been abusing me –  which wouldn’t surprise me – I don’t know of it, and fortunately wasn’t one of the submitters subject to one of those “angry weekend phone calls”.   But New Zealand deserves a lot better from such a powerful public figure.)

The Reserve Bank’s Board and the Minister of Finance are jointly and individually responsible for the Governor.  I wrote to both a couple of months ago expressing my concern, partly because the chair of the Board tried to bat away the issues by suggesting that he had had “no formal complaints” (as if that was the appropriate threshold for concern, in an industry where the Governor has great power to make things difficult for at least soe troublemakers).  My letter to the Board was here.   I also knew that I wasn’t the only person writing to the Board.

I lodged a request under the Privacy Act for (basically) any Reserve Bank senior management mentions of me during October (the time of the Stuff articles and the letters to the Board).  I was mostly after the flavour of the period.

For anyone interested the response (not particularly long) is here

Reddell Personal Information 281119 (1)

It includes the letter, Geof Mortlock, former Reserve Bank (and APRA) official, wrote to the Board chair Neil Quigley (because he referenced something I’d written), quite critical of both the Governor and the Board.

Here was how one of Orr’s deputy chief executives responds when Neil Quigley forwarded the letter on.

robbers 1.png

I thought that “Sigh” was pretty telling.  The SLT statement to which she refers was that extraordinary to suggest that it wasn’t fair that people were beating up on their staff when…..no one was.  Play distraction rather than addresss any issues about policy or the Governor.

I sent my letter later the same day.  This was the Robbers unguarded response

robbers 2

(I have never met her, but I can assure her (and her bosses) that I’m not “bitter” –  I’m not sure what I’m supposed to be “bitter” about, but it is clearly a theme that makes Bank management feel better –  and if they looked at all carefully they would find I typically express my concerns more moderately than some others commmentators on the Bank –  see eg some of the Mortlock articles and, indeed, letter to the Board.  Never mind though, she is “calm and serene”).

Having received my letter, Quigley contacted Orr.  An excerpt

quigley 1

Actually, I didn’t ask for it to be discussed at the Board (although I appreciate the fact that it was so discussed – see below).  More importantly, perhaps, I had not talked to Kate MacNamara for the articles, and have never had any contact with her.

Orr responds a few minutes later, not at this stage having seen the letter

orr letter

One has to chuckle at the lack of any apparent self-awareness in that second paragraph, written just days after the Governor had had his SLT put out that unsolicited statement attempting to distract from real concerns.  I guess it wasn’t the Governor who was making those “angry phone calls”, or engaging as he did with Jenny Ruth, and so on.

A few minutes later Quigley responds, rather characteristically it would seem (one of the consistent criticisms of the Board is that they repeatedly acts as if their role is to cover for the Governor, not –  as the law provides –  to hold the Governor to account on behalf of the public and the Minister.

quigley 3

This is, presumably, a reference to the episode in which Graeme Wheeler used public resources and his official position to attack me as “irresponsible” for bringing to light what proved to have been a leak of the OCR and associated systemic failures, and when I expressed concerns to the Board –  on which Quigley was then a member (generally one rather sceptical of Wheeler) –  they all circled the wagons to defend the Governor.

The Board met a few days later.  A few days later Quigley confirmed to me that the non-executive directors (Orr is also a director) had discussed my letter.  The Board’s minutes confirm this.

board

We don’t know what was said (and even if it were recorded, it would –  rightly –  not have been disclosed), although there are rumours –  heard from several sources –  that the subsequent meeting between Quigley and Orr was a fiery one, suggesting that the Board may actually have taken seriously some of the concerns raised.   There were signs in the Governor’s demeanour at the last two press conference that he may have been counselled to rein himself in and act with a bit more gravitas and dignity.

As it happened, I had lodged a parallel Official Information Act request in which I asked for

·         all communications received from outside the Bank by Board members (including the Governor) during October 2019 regarding the Governor’s performance or conduct, including (but not limited to) issues raised in recent articles by Stuff’s Kate MacNamara

·         any comments on those communications made by the Governor

·         details of any external speaking engagements, or contributions to written publications, where the Bank had initially indicated that the Governor would speak but which, during October 2019, were either rescheduled, cancelled, or assigned to some other Bank staffer.

The response was due last Friday.  It wasn’t an onerous request.  There can’t have been many such communications to Board members, nor (presumably) many written comments by the Governor.  The third strand was to attempt to find out whether the reported story was correct, that the Governor had chosen or being prevailed on to pull out of some engagements after the criticism.

Anyway, the Bank has extended the deadline for this request by another 2.5 weeks, claiming the need for “consultations”.   But I guess it also conveniently pushes any release beyond today and close to the Christmas break.   Perhaps there is more there than I assumed.  More probably they are just being deliberately obstructive.

As I noted, I also wrote to the Minister of Finance about these issues, mostly to reinforce the point that the Governor was his responsibility, and he couldn’t just fob things off to the Board.  The Minister’s stance right through this year has been to distance himself from the proposed major new regulatory initiative, claiming it is just up to the Governor, and refusing to exercise any of the powers he does have.    Here is that letter.

Letter to MOF re Orr Oct 2019

I didn’t really expect to get more than a one sentence reply, but a fuller response turned up in the post the other day.  Here is the heart of it

robertson.png

I thought there were two interesting statements in this letter, neither of which he was compelled to make:

  •  first, the statement of “complete confidence” in the Board, even though almost non one shares that view, and his own consultative documents as part of the Phase 2 Reserve Bank Act review recognised the serious weaknesses of the current model and proposed scrapping it, and
  • second, the line that “I have been satisfied with the Governor’s work so far”.  I guess “satisfied” isn’t a terribly strong endorsement, and arguably “work” might not include style, but it clearly sees the Minister of Finance line up behind the Governor including around the Bank capital proposals and decisions (almost certainly the Minister would have been informed of the final decision by last week when the letter was dated).  That is a brave choice, given the serious pitfalls in the Bank’s work in this area that I and various others have highlighted.

Before long we will have the Governor’s final decision.  Perhaps after a year and more of weak performance, his presentation (there is apparently a press conference) will be marked by grace, insight, rigour, and gravitas, and the documents will be penetrating, complete and convincing, addressing comprehensively, whether directly or by implications, many of major concerns that have been raised.  Perhaps, but it seems unlikely.   If it so, I hope I will one of those saying tomorrow how pleasantly surprised I was.

We need a high-performing Governor, a robust and rigorous Bank, and the sort of openness that really should characterise a strongly-performing powerful institution in a free society.  On each count, they’ve been a long way short this year, covered for by both the Bank’s Board (in pretty predictable fashion) and now by a Minister of Finance who refused to take any responsibility –  including when questioned on the issue in Parliament –  and now seems happy to line up behind the flawed Governor he is responsible for –  but, no doubt, a Governor whose personal politics and championing of issues well outside his lane warms the hearts of MPs on the government benches.

New Zealanders deserve better –  behaviour and substance – than we’ve had this year.  As I noted just last week, even at this late date the groundwork the Governor was laying for this decision was shaky and incomplete at best.


What a (revealing) travesty

Late yesterday morning, the government announced that it was going to ram through all its stages under urgency, the Electoral Amendment Bill (No. 2).  By the time you are reading this, the bill may already have been passed into law.

The goal of the legislation appears to be to suggest, at least to those who don’t follow politics closely, that the government is “doing something”.  The Minister’s press release announcing the bill is headed “Government to ban foreign donations”, but in fact it does nothing of the sort.

The Explanatory Note on the bill is more honest, that the law is more about signal than substance

The Bill makes several changes to the Electoral Act 1993 to send a clear signal that only those who are part of New Zealand’s democracy, and who live in, or have a strong connection to, this country, should participate in our electoral system.

But although the heading of very next section sound promising, again the substance outs

Ban on donations from overseas persons

The Bill amends the Electoral Act 1993 to restrict donations from overseas persons to political parties and candidates, to reduce the risk of foreign money influencing the election process.

The changes are being applied only to parliamentary elections, not local elections.

The Bill bans candidates and parties from accepting donations over $50 from an overseas person in any form.

The definition of an overseas person in the Electoral Act 1993 is not being changed. The ban applies to donations from—

  • an individual who resides outside New Zealand and is neither a New Zealand citizen nor registered as an elector:
  • a body corporate incorporated outside of New Zealand:

  • an unincorporated body that has its head office or principal place of business outside New Zealand.

So if there is any (serious) signal at all, it is that local body elections don’t matter (there are no still restrictions at all on foreign donations to local body campaigns, even though we know that, for example, prominent candidates in Auckland have been associating closely with PRC United Front individuals/entities, or that –  for example –  Southland mayor Gary Tong was being courted by close regime-affiliate Yikun Zhang).

The other “signals” are rather more implied:

  • first, since the foreign donations limit is being lowered from $1500 to $50, but the anonymous donations limit is being left at $1500, any foreigner who really wants to make a $500 donation should just do so anonymously.     This was an issue the Ministry of Justice highlighted in its (not very good) RIS, but the government chose not to act on, and
  • second, none of this intended to be serious at all, just theatre.

How do I justify that second point?  Well, check out this table from the RIS.

justice donations
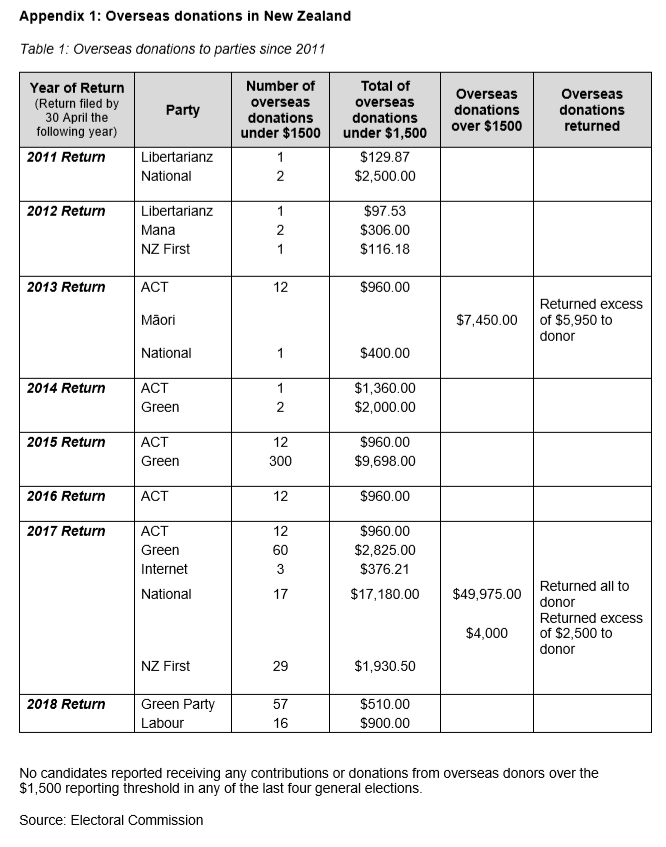
This just isn’t where the (foreign) money is.  All “foreign donations” –  as the law is drawn at present, and will be when the bill is passed –  averaged just under $5400 per annum across almost all our political parties.  Those are derisory sums of money, rightly tightly limited.  The new law will, almost certainly, reduce the derisory sums under this heading to almost zero.

So where is the foreign money?  First, and we know this from political party returns –  they aren’t really hiding it, even if they won’t engage on it –  is donations from foreign-controlled companies operating in New Zealand.  There have been two particularly prominent examples highlighted in recent years: donations to the National Party from Inner Mongolian Horse, and one from another Chinese billionaire’s company that was facilitated by Todd McClay and Jami-Lee Ross (the latter told us again all about the transaction in his Second Reading speech last night).   It isn’t a new discovery that this avenue is open.  Some call it a “loophole”, but it looks a lot more like a design feature –  ie even if not envisaged when the law was originally drafted, all parties in Parliament have been content to leave the definition of “overseas person” unchanged, in full knowledge of how the provision was being used.

That would have been easy to fix, if the government had been interested in doing so. It clearly wasn’t.  It is where a lot of money has been in the past, and if they argue things need to change before next year’s election, this is what they could –  quite readily-  have changed.

And the second, of course, much harder to deal with: funds donated by people who are now New Zealand citizens, but who have close associations with foreign regimes, notably the heinous CCP regime in the PRC.  I’ve seen people talk about the risk of foreign regimes directly channelling funds to such individuals and them passing the money on under their own (New Zealand citizen) name.  Perhaps, but things don’t need to be that direct to be highly troubling.  Reciprocity is a real thing, whether or not anything is ever written down.   I’m not sure what the law can do about this particular risk, but political parties can.  Political parties can choose to do the right thing, and declare –  and take seriously – a determination not to take money from, or solicit it from, people –  even registered electors –  who are known to have close associations with foreign regimes, perhaps especially with such troubling regimes as the PRC (or the Soviet Union in days gone by, for example).     But there is no sign of such a willingness to commit, to self-restrain, from any of the parties in Parliament.  None.

Thus, I heard National MP Nicola Willis give a decent speech last night in the second reading debate, that seemed to suggest she thought there were real issues and problems that needed addressing. But there was no sign from her –  or any of her colleagues – that they were willing to commit to a different model of behaviour.    Nothing from the Prime Minister either, even though she has previously been critical of some of donations that have flowed to National.  She’s the Prime Minister.  She could legislate, she could set an example.  Instead, we just have political theatre, while avoiding the real issues.

(The Opposition leader, of course, is quite as bad here –  albeit out of office.  Listen to his trainwreck interview with Kim Hill on Morning Report this morning, where he tries to avoid even acknowledging any sort of serious issue.)

And then, of course, there is the process –  ramming this law through under urgency, with no select committee submissions, hearings, or deliberation.   Things weren’t even done quite that badly with the gun control legislation earlier in the year.    Hardly any law should ever be passed that way, and certainly no electoral laws.  But what is also remarkable is that looking through the Minister’s press release, the Explanatory Note, the RIS, and Hansard records of the debate last night, I could see no substantive justification from anyone on the government side for this extreme urgency.  The bill won’t even come into effect until 1 January –  so they could readily have had even a week at a Select Committee, a week for people to think through the details carefully. It is a travesty of a process.

There have been various attempts to suggest that the problem here was really the Justice select committee, which has been dragging its feet on reporting back on its inquiry into foreign interference.    If only they’d reported, it is suggested, such a rushed and limited bill might not have been necessary.

But that sort of story doesn’t stack up at all.  First, even though the Committee is split equally between government and Opposition members, Labour provides the chair, and a good chair would be able to facilitate the process, and build coalitions.  In fact, we are now (so it is reported) onto the sixth chair for this particular inquiry, and many of the members now on the Committee weren’t members when much of the evidence was heard.  And it is only nine months or so since Labour was backing their chair (Raymond Huo) in his stated desired to prevent any public submissions at all, quite content that government departments could provide all that was needed.

More importantly, the government is supposed to govern and to lead.  All the issues around donations –  including foreign donations – have been known for a long time now. And it is not as if the Justice Committee (with its endlessly rotating membership) has any specialist expertise on these issues, or access to policy and operational advice not open to the government itself.  The government is far better equipped to act,  if it wanted to.  But it is chosen not to until now, and now it is just engaged in insubstantial trivia –  grabbing a few headlines, but not changing anything.    They could have had a bill in the House six months ago, with time for proper select committee consideration, outlawing donations (for central and local government campaigns) from anyone but registered New Zealand electors, and with full and near-immediate disclosure.  But they consciously chose not to.  And if, perchance, Labour wanted to act –  seems unlikely –  but didn’t think it could the numbers, it was a great opportunity for some Prime Ministerial leadership, to embarrass other parties into acting, and to set an example with the new and better limitations Labour would adopt for its own fundraising.

But we’ve had none of that.  Either the Prime Minister wasn’t capable of such leadership or wasn’t interested in displaying it.  Either should be a concern.  She runs the government.

There was a few good speeches in the debates last night, but in the end only one member –  ACT’s David Seymour –  was actually willing to oppose this piece of theatre.    Perhaps political parties were reluctant to be wedged – being seen to oppose a bill that (appears) to limit foreign influence – but I doubt that really explains much.  It probably suits National quite as much as Labour –   even allowing that they are serious about their process concerns around urgency –  to be seen to have “something done”, even as nothing much substantive changes.

Outside political parties, I guess views can differ.  I noticed Professor Anne-Marie Brady welcoming the bill (she was responding to my lament that Jami-Lee Ross had made a forceful speech about the bill avoiding all the real issues, yet voting for it)

I disagree with on that.  It is probably worse than nothing because (a) the donations it will actually restrict are derisory in total value (see above), and (b) because it tries to fob off the public with a sense of “something being done”, even as the real issue are almost entirely avoided.  The public typically has a limited attention span for such issues, and this will have people who’ve had only a half an ear to the issue nodding along with the “at last something is being done”).  But the CCP, the PRC Embassy, those regime-affilated business people –  resident here or abroad –  will know that nothing real has been done at all.  And in the entire parliamentary debate –  that I’ve read or heard – the elephant in the room, the CCP/PRC, is not even mentioned.  So at least one more election will pass with the ability to raise large amounts from PRC-affiliated sources will go on, even as the true character of the regime becomes more and more apparent. (Of course, any restrictions should apply to all foreign donations, but no serious observer supposes that the biggest issues at present are around the PRC).

Perhaps we will eventually see the Justice Committee’s report on foreign interference issues.  Simon Bridges implied this morning that it won’t be much longer delayed, although suggesting that there are likely to be two different reports.  But it seems highly unlikely we will be much further ahead.    The Committee has no personnel or expertise or analysis not already open to the government –  in fact, the RIS on today’s bill had the Ministry of Justice noting that they had paid attention to the submissions –  and there is no figure of any real stature (no Andrew Hastie, for example, in the Australian context) on the Committee, let alone chairing it.

Bu then there are no figures of any real stature leading our politics.    Today’s bill, today’s process, demonstrates that again.

My own submission to the select committee inquiry is here.   That submission included

There are some specific legislative initiatives that would be desirable to help (at the margin) safeguard the integrity of our political system:

• All donations of cash or materials to parties or campaigns, whether central or local, should be disclosed in near real-time (within a couple of days of the donation),

• Only natural persons should be able to donate to election campaigns or parties,

• The only people able to donate should be those eligible to be on the relevant electoral roll,

However, I summarised

But useful as such changes might be, they would be of second or third order importance in dealing with the biggest “foreign interference” issue New Zealand currently faces – the subservience and deference to the interests and preferences of the People’s Republic of China, a regime whose values, interests, and practices and inimical to most New Zealanders.  Legislation can’t fix that problem, which is one of attitudes, cast of minds, and priorities among members of Parliament and political parties.   Unless you –  members of Parliament and your party officials –  choose to change, legislative reform is likely to be little more than a distraction, designed to suggest to the public that the issue is being taken seriously, while the elephant in the room is simply ignored.    It is your choice.

Today’s legislation is just such a distraction.

Savings rate across the OECD

In my post yesterday I looked at various New Zealand saving and spending series across time, drawing from the recently-released annual national accounts data.  In this post I’m looking just at national savings rates, but across the spectrum of advanced countries, as proxied by membership of the OECD.

Savings rates have been a hardy perennial in discussions of New Zealand macro data and economic performance for a long time.   It is perhaps in the nature of the case given that for much of its modern history, New Zealand has drawn fairly heavily on foreign savings (and thus has typically had quite a large negative net international investment position).  For much of our more recent (say, post-war) history, economic performance –  proxied by productivity or per capita income measures –  has also disappointed.

The stylised facts were that, by comparison with other advanced countries, our national savings rates tended to be fairly low.     Quite why wasn’t  –  perhaps isn’t – lways clear.   For most of the post-war period –  the 70s and 80s were the exception –  the government’s accounts tended to be fairly well-managed.  And although the tax treatment of household savings tends now to be quite hostile –  under the guise of (a false conception of) neutrality –  it wasn’t always so (until the changes at the end of the 1980s).

In this post, I’m concentrating on the same indicator of national savings I used in yesterday’s post: net savings as a percentage of net national income.  In other words, provisions for depreciation don’t count as saving (they aren’t available to build the capital stock, only to maintain it), and the relevant income measure is the income available to New Zealand residents after providing for depreciation. In other words, the income available to consume or to build the capital stock.

In the paper a few years ago in which I first tried to document and articulate my story around New Zealand’s economic underperformance I included a chart showing that in the early 1970s (when comparable international data date back to), New Zealand had had the sixth lowest national savings rate of the OECD countries for which data were available.    Here is a version of that sort of chart.

net savings 70 to 74

In many ways, it is quite a startling range, and not just for a single year (which can be influenced by different cyclical factors).

One of the points I made in that earlier paper was that New Zealand didn’t look such an outlier if one focused in on just the Anglo countries –  not just the ones we often compare ourselves too, but also perhaps the countries with the greatest cultural similarities to New Zealand.    In this particular snapshot, we had national savings rates higher than those in the UK, Canada, and the US, while all four countries were materially lower than Australia.

How has that Anglo country comparison unfolded since?

net saving anglo comp

We had national savings rates lower than the other Anglos in the late 70s, but since at least the early 1990s, we’ve never had a national savings rate materially lower than that of the median Anglo country and for two multi-year periods (including the last few years) we’ve been well above that median.

Now, one point I probably didn’t make clearly enough in yesterday’s post is that inflation can distort these numbers, especially for countries with large net international investment positions (particularly large debt positions).   In the presence of inflation, some of the interest paid abroad is recorded as a factor income payment when, in economic substance, it is just a compensation for inflation and thus is, in effect, a repayment of principal.  This is a well-recognised point, highlighted from time to time by agencies such as the Reserve Bank, but there are no official series making the correction.

For New Zealand in the early 80s, most probably our “true” national savings rate was below that in other countries –  there were large government deficits at the time – but at a time of heavy indebtedness and still quite high inflation (most of our debt then was denominated in foreign currency) the gap would be smaller than shown here.

What of the current position?   At present, the UK and Canada have NIIP position near zero, while Australia, New Zealand, and the United States are all around -50 per cent of GDP.     But the US net position is mostly an equity position, reflecting high share prices (foreign holdings thereof).  In the New Zealand case in particular, by contrast net debt is almost equal to (ie in net terms makes up almost all of) the overall net investment position.    With a core inflation rate of perhaps 1.7 per cent, our national savings rate would be perhaps 0.8 percentage points higher again if inflation were accounted for correctly.  But bear in mind that 15 years ago, not only was inflation (and inflation expectations) a bit higher, but that our NIIP position was also more negative (more like 70 per cent of GDP).  The appropriate adjustment then might have been more like 1.5 percentage points.

Bottom line: it is a real issue to keep in mind, but the extent of any adjustment required is less now than at any time since the early 1970s (when inflation was getting up but the NIIP position was small).

What about the simple comparison with Australia?  Australia has often been held up –  especially in New Zealand –  as some bastion of (Anglo) high savings.  Champions of compulsory private savings (as found in Australia) are fond of it, even though those champions will rarely acknowledge that the gap between Australian and New Zealand (net) national savings rates has been smaller in the years since Australia introduced compulsory private savings than it was previously.

So how do the simple New Zealand/Australia comparisons look?

net savings aus nz

There is plenty of variation in the series of course, and you can see (for example) the way the huge surge in Australia’s terms of trade boosted national savings rates up to around 2012.   But having had a net national savings rate averaging well below Australia all the way through to the start of the 1990s, we’ve since had net savings rates that are really rather similar on average.  This century New Zealand averages just slightly lower than Australia, but for the last few years we’ve had a higher net savings rate than Australia.

In fact, of the five Anglo countries, New Zealand currently has the highest net national savings rate.

(Note that these are comparisons of net savings rates –  the share of income available to build the capital stock.   Australia’s mining and resources sector is very capital-intensive and comparisons of gross saving rates –  which include depreciation provisions –  are higher in absolute terms, and Australia’s are higher relative to those in New Zealand.)

And here is the comparison for that whole group of OECD countries for which there was data right through since the early 1970s, this time an average for 2013 to 2017, the most recent five year period for which there is comprehensive data.

net saving 13 to 17

New Zealand in the upper half of the (old) OECD.    Not a chart I really expected to see.

Even if we add in the newer OECD countries and look just at the most recent year’s data

net saving oecd 2018

New Zealand is almost exactly the median country.

Now, personally, I wouldn’t get too excited about this.   When you are among the handful of countries with the fastest trend population growth rates you would expect over time that your country should also have relatively high (net) savings rates (all that capital stock, whether commercial, public, or residential, is typically owned and paid for locally eventually).  And all the countries in the upper quartile of that last chart have modest rates of population growth (or have falling populations –  Estonia).   But it is a somewhat different emphasis than we’ve been used to seeing.

Spending and saving

Another post, probably the last, looking at some of the recently-released national accounts data.

First, a useful reminder of how much, relatively speaking, New Zealand benefited from the fall in interest rates over the last decade.

IIP

The chart shows the share of New Zealand’s GDP (the value of stuff produced here) that accrued to foreigners as returns on their loans to New Zealand residents or their equity investments here.  When the chart starts, in the year to March 1972, the net international investment position (NIIP) was very small, and so were the returns to those who’d provided the funds.   The (negative) NIIP positioned widened a lot over the 1970s and 1980s, and so did the servicing burden.

As recently as just prior to the last significant recession (2008/09) the equivalent of just over 7 per cent of everything produced here accrued (net) to foreign lenders or investors.  That wasn’t wholly a bad thing of course: interest rates were cyclically because the economy was doing relatively well, and when the economy is cyclically strong profits –  to domestic and foreign-owned businesses operating here –  also tend to be high.  One of the big transitions over the 1990s and 2000s was that almost all the net debt owed by New Zealanders abroad was, in effect, in New Zealand dollar terms, thus it was the NZ interest rates which affected the servicing cost.

As late as mid 2008, the OCR was 8.25 per cent.  It was 1.75 per cent in the last year on this chart, and is 1 per cent now.  That shift is the biggest contributor to the reduction in the servicing burden to around 3.5 per cent of GDP now.  It is a significant shift: on average in the 90s and 00s about 94 per cent of what was produced here was available for local uses, these days something like 96.5 per cent is available.  In a decade when productivity and real GDP growth have been pretty lacklustre, it is a saving not to be sniffed at.

I’m not here wanting to imply that the sharp fall in New Zealand (and global) interest rates is a good thing in and of itself.  After all, New Zealand and global interest rates are likely to have fallen so much partly for reasons reflecting a reduction in perceived investment opportunities and a dearth of profitable (risk-adjusted) projects.  But if that reduction has been fairly global in nature, at least all else equal as a country that had taken on a lot of foreign (debt and equity, although in net terms mostly debt) we’ve benefited from the unexpected collapse in servicing costs relative to countries which were net providers of funds to the rest of the world.

It was just one of several things that should have been going for New Zealand.  Not only did the debt we’d taken on prove much cheaper to service than we’d expected, but the terms of trade (prices of stuff sold abroad, relative to the prices of stuff imported) also proved unexpectedly strong.   There were real income gains from those direct effects, but little or none of it seems to have translated into, say, stronger business investment or any narrowing of the productivity gaps between New Zealand and the rest of the world.  But investment was last week’s post.

What about consumption and saving?

Here is net national savings as a percentage of net national income (ie ‘net’= after deduction of depreciation from both sides, and “national income” is domestic product adjusted for net factor income flows accruing abroad –  mainly the investment income shown above).

net savings to nni dec 19

Net saving (from income) of New Zealanders perhaps averages a bit higher than it did over the period from the mid-70s to around 1990 (although in these earlier numbers there are some material inflation distortion), but the current cycle doesn’t look much different than the previous one, despite windfall income boosts discussed above.

The sectoral savings data are available only from 1987 onwards.  Here is the household savings rate,

household S

It has been quite stable for a few years now, although still around zero.     For those convinced that somehow house price inflation is a material part of the household savings story, a reminder that the all-time low in this series was in the year to March 2003, and 2003 was the very first year of the 2000s surge in house price, subsequently built on in further rises in real house prices this decade.

And here are the two components of private savings, this time shown as a share of NNI.

savings per cent of NNI

If (net) business savings are higher than they were (on average) in the first 20 years or so, they are still lower than the peak (year to March 2003 again) seen in the previous growth phase.  Given that business investment has been pretty quiescent, one is left wondering whether, for example, the gap between company and maximum personal tax rates is encouraging owners to save in the corporate entity, rather than taking a distribution and saving personally.

And here is government and private (household plus business), again as a share of NNI.

govt and pte saving dec 19

There is, pretty clearly, some element of offset in these two series –  which makes some sense; when the government is running big surpluses, households in particular may not need to be quite as cautious –  but that story shouldn’t be overstated.   After all, the overall rate of private savings has been remarkably stable all decade, even as government saving was gradually getting back to more normal levels.  Private savings rates do seem to have been averaging higher than they were in the 15 or so years prior to the last recession.

And on the other side, what about consumption?

C NNI

We consume more than 90 per cent of what we (New Zealand residents, including resident companies) earn.  But, if anything, that share seems to have been falling a little; in particular, last year private consumption as a share of NNI was the lowest in the 30+ year history of the series.  So much for those stories about people consuming on the back of high/rising house prices: I’m sure it happens for a few people, but for the economy as a whole (where an increasing number of people can’t buy a home at all) it isn’t a thing, and that isn’t surprising because higher house prices don’t make us better off in aggregate.

And what about government consumption?  There are two different types of consumption here: individual consumption (things government pays for but you consume directly, such as schooling and hospital services) and collective consumption (defence, law and order, and all those officials in Wellington head offices).  Both measures, of course, exclude transfer payments (eg welfare benefits) to households.

govt C dec 19.png

Focus on the blue line first.  Despite the rhetoric from each side in politics, government consumption spending (as a share of income) hasn’t changed much in 30+ years, and the bigger changes look to be mostly cyclical in nature.  Thus, Ruth Richardson and Jim Bolger weren’t greatly increasing government spending in the early 1990s; instead, there was a recession and government consumption spending tends to hold quite steady.   Similarly, the last Labour government wasn’t slashing spending (the low point on the blue line is 2004), but the economy was quite cyclically strong and terms of trade were turning up.  And so on.

But the orange line did catch my eye.  Whereas in the late 1980s governments were spending almost 10 per cent of GDP on collective consumption –  things more akin to public goods – now that share is only about 8 per cent.    There will be all sorts of things going on inside that aggregate, and there may have been some reasonably material genuine efficiencies garnered over time, but….. I can’t help wondering if this number isn’t a little low.  It is easy to highlight a lot of silly, pointless (except as something like virtue signalling) public agencies, which could quite readily be eliminated, but most of them are pretty small, often very small indeed.  The amounts involved are also small.  But look, for example, at the state of our national statistics –  including the debacle of the last census –  and you have to wonder.  As even my fairly dry right-wing friends on the 2025 Taskforce noted a decade ago, things governments actually need to do need to be done well, and that involves spending money.

Then again, perhaps that is simply a Wellington perspective, born of mixing with public servants.

(It is perhaps worth noting in passing that when she made her schools spending annoucement yesterday, every second word from the Prime Minister seemed to be “investment” (or “infrastructure”).  No doubt much of the extra spending will manage to be categorised as capital spending for government accounting purposes, and perhaps even as investment for national accounts purposes, but spending that doesn’t generate a return –  in some form or another –  is really just consumption, and interest rates can be as low as you like – typically for reasons having to do with a dearth of remunerative opportunities –  but consumption spending still has a substantial cost (100 per cent of it) relative to which the interest costs are pretty second order.)    Businesses undertake stuff categorised as “investment” with the intent (not always realised) of generating an economic return.  Governments can often be less disciplined, motivated by different considerations, not excluding re-election.)