I was at a meeting earlier this week at which a funds manager from one of the leading firms in the New Zealand market was giving us a presentation on our money, their performance etc etc. We had a light agenda and the presentation was basically over and I like to probe funds managers to see how they think about things. So I asked him about the possibility of New Zealand getting to negative interest rates, deliberately phrased in a fairly vague way (rather than, say, “what is the probability in the next 12 months?”). You’ll recall that the OCR at present is 1 per cent.
Anyway, the funds manager’s response was that it was “highly unlikely”, going on to note that although a “couple of people” had been talking up the possibility that had been a while ago. The implication was that those people had been, most likely, proved wrong.
I found it a really surprising answer. Maybe many clients (at least on our fairly modest scale) don’t like talk about uncertainty, contingency etc and want to hear more definitive views from their funds manager. If so, they are ill-advised. The world isn’t like that. And it isn’t 1990 when negative interest rates anywhere in the world might have seemed all-but inconceivable.
Closer to now and to home, even the Governor of the Reserve Bank has been quite open about the possibility of negative rates.
If someone asks me my question – and they do from time to time – my answer is along these lines: in many respects it would be surprising if we didn’t get to a negative OCR at some point in the next few years, just because the starting point is one per cent and we know so little about the future. I often go on to add that after nine years since the last recession the chances of some fairly significant downturn at some point in the next few years must be quite high (statistically, the probability of a significant downturn in any particular year is never that low).
Fan charts are one of the techniques people use to illustrate the plausible ranges of uncertainty around macroeconomic (and similar) forecasts. Here is an example, applied to the US, from an RBA Discussion Paper published a couple of years ago.
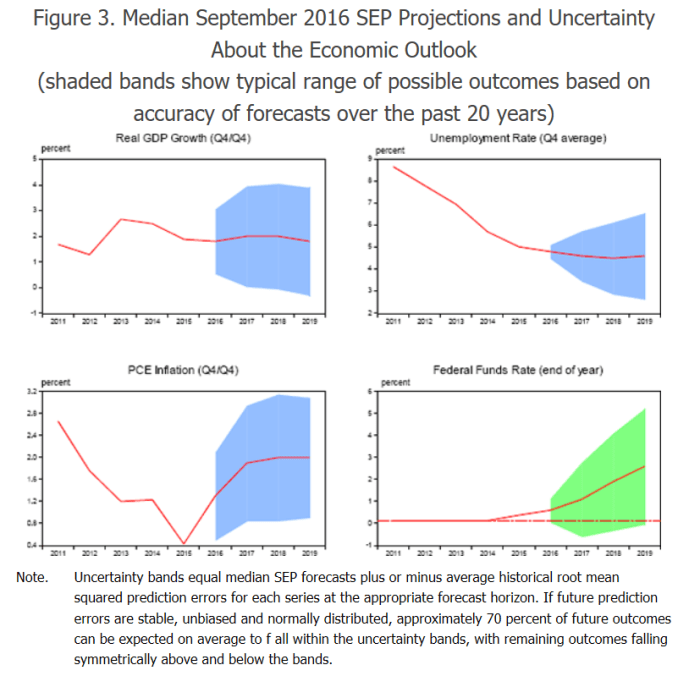
Focus on the bottom-right chart. Over a three-year ahead horizon, only 70 per cent of historical forecasting errors for the Fed funds target rate would be captured in a range five percentage points wide.
Our OCR system has only been running for 20 years, but I had a look at the historical record to see how much the OCR moved over a three year horizon. (One could do the exercise looking at outcomes vs RB forecasts, but that would be more time-consuming.) The (absolute value) median change in the OCR over a three year horizon was 1.25 per cent. Take a longer run of data and look at changes over three years in the 90 day bill rate since financial markets were liberalised here and the median change was 1.8 per cent.
Those are medians, so encompassing only 50 per cent of the changes. From a starting OCR of 1 per cent, a reasonable description of the range of possibilities – knowing precisely nothing about the macro outlook – simply based on historical variability would be along the lines of a 50 per cent chance that the OCR three years hence would be in a range of -0.25 to 2.25 per cent, with a 25 per cent chance each that the OCR would be lower or higher than that the options encompassed by that range. Simply based on historical variability, there might be something like a 30 per cent chance that the OCR would go negative, from this starting point, in the next few years.
Another way of looking at the issue is to look at how large the falls in short-term interest rates have been when the economy turned down.
For the pre-OCR period we had these examples:
1987 to 1989: about 600 basis points
1991-1992: about 700 basis points
1997-1998: about 450 basis points
And since the OCR was adopted
2001: 175 basis points (not measured as a New Zealand recession)
2008-09: 575 basis points
Recessions in New Zealand look to have been associated with 500 (or more) basis points of cuts in short-term interest rates.
That isn’t particularly unusual: I was reading last night a recent speech by one of Fed Board of Governors who noted, in a quite matter-of-fact way, that the Fed has typically needed about 4.5-5 percentage points of policy leeway in recessionary periods in the last 50 years.
(Under current laws and technologies) the OCR can’t be cut by 500 basis points, but cut by 125 basis points from here and we would already be negative.
Of course, it might be reasonable to ask what is the appropriate starting point. The last time the OCR was raised was back in late 2014, and the OCR is already 250 points lower than it was then. Since those OCR increases were never really warranted by the data (with hindsight – and some with foresight – never really needed to meet the inflation target), perhaps 3.5 per cent isn’t really a sensible starting point.
But this year’s 75 basis points of OCR cuts have been in response to actual/forecast data on weakening economies and inflation pressures. If so, perhaps 1.75 per cent might be a reasonable starting point for comparison. And if a recession hits in the next few years, historical experience suggests that (the equivalent) of 500 basis points of easing will be required. Again, we can’t cut 500 basis points from 1.75 per cent, but we don’t need anything like that – less than half in fact – to get negative.
What are the chances of a recession in the next three years? Well, no one can tell you with any great confidence. But if we look at (a) the array of risks, locally but especially internationally, (b) the passage of time since the last recessions, and (c) the very limited conventional macro firepower authorities have at their disposal (and are known by markets to have at their disposal) it would be a brave forecaster – or funds manager – who didn’t have such a possibility in their reasonable range of outcomes over the next few years. One could add into that mix the fact that in most advanced economies inflation starts below target (quite different from, say, the New Zealand starting point in 2008). With the best will (wishfulness?) in the world, I’d have thought a significant downturn, requiring a lot more macro policy support, had to be more than “highly unlikely”.
The Reserve Bank surveys professional expectations/forecasts of the OCR, but only a year ahead, and it only asks for point estimates, not (say) a band within which the forecaster would be fairly confident. The latest survey has a range – for September next year – of point estimates of 0.0 per cent to 1.25 per cent. Even if the more pessimistic of the respondents might have pulled back their point estimates a bit, they aren’t responses suggesting negative rates in the next few years are “highly unlikely”.
I’m not sure whether anyone sells options on, say, bank bill futures in New Zealand. If so, it would be interesting to know what the prices of those instruments are saying about the range of plausible outcomes for the next few years.
I suspect our fund manager was really just giving (a) his point estimate, and (b) implicitly at least, something about the next 12 months or so. But the general point is independent of his specific comment: when the OCR is already 1 per cent and the economy is still relatively near a NAIRU (not deep in a downturn already), little or nothing from historical experience should give anyone grounds for confidently predicting that New Zealand will avoid a negative OCR at some point in the next few years. Constantly thinking the OCR is as low as it will go has been a pretty consistent mistake of observers of New Zealand for 10 years now.
