Investment, capital, and all that

The annual national accounts data were released last week.  For at least some of the variables –  nominal ones –  these data offer the longest official national accounts time series we have in New Zealand, in many cases going back to (the year to March) 1972.  By contrast, the quarterly national accounts data go back only to the late 1980s.  One day, when SNZ and official statistics are properly funded, it would be a worthwhile project to take consistent historical series back several more decades.  Doing so would help us make better sense of our economic history.

I was playing around with various series, and nominal ratios, from the national accounts data.   This post presents a few of the resulting charts, on investment as a share of GDP and also on the capital stock relative to GDP.

First, investment.

There has been a fair amount of residential building activity going on this decade.  Almost certainly not enough (and nothing like the volume of new building relative to population growth that we had in the early 1970s for example) –  although the bigger issue is probably land, and the affordability of housing.  But what about some other components?

When it was campaigning in 2017, Labour talked a lot about government underinvestment in all sorts of things.  As recently as last week, the Prime Minister was talking up government “investment” in all sorts of things.  But here is national accounts investment (GFCF) by general government (central and local) as a share of GDP.

gen govt GFCF to  mar 19.png

The latest data are only for the year to March 2019, and I guess it takes a while for new governments to get things going.  But, so far, we aren’t seeing much sign of movement (and do notice how much smaller government investment spending is relative even to the early-mid 70s when population was also growing very rapidly).

What about business investment?   SNZ don’t release a series for this –  but they could, and it is frustrating that they don’t –  so this chart uses a series derived by subtracting from total investment general government and residential investment spending.  It is a proxy, but a pretty common one.

bus investment to marc 19

Business investment as a share of GDP has been edging up, but it is still miles below the average for, say, 1993 to 2008, a period when, for example, population growth averaged quite a lot lower than it is now.  All else equal, more rapid population growth should tend to be associated with higher rates of business investment (more people need more machines, offices, computers, or whatever).    The Governor often tries to talk up business investment, as if the only relevant factor was the interest rates, without ever apparently taking time to think about why business investment here is so subdued.

Within the aggregate numbers, there are the odd glimmers that might encourage some. The government is very keen on encouraging more R&D, and has recently brought in new subsidies to try to encourage firms to do more (again, without stopping to think hard about why more R&D investment wasn’t attractive to private profit-maximising firms).  Here is (the total) research and development component of GFCF, expressed as a share of GDP.

R&D to march 19

That tick up is before the new subsidies were put in place.

What about the (net, ie after depreciation) capital stock?  I showed this chart a few days ago, components that might be expected to show some of the “digital transformation” were it happening apace.

cap stock 19

It was rather less encouraging, especially in the last few years.

What about general government and business capital stocks?

cap stock components

On this proxy measure of the (net) business capital stock, it has been falling as a share of GDP for the last 25+ years, and is still lower than it was in the late 1970s.  Now, there is an argument that in advanced economies production is becoming less intensive in physical capital, and to the extent that is so one might expect to see a trend decline.  But I doubt this is something to take much comfort from when thinking about New Zealand because (a) we don’t have the Google, Facebooks or the like, and (b) these measures don’t include farmland (although SNZ includes it in their sectoral productivity measures/models), which is still very important to the New Zealand economy.  The stock of farmland isn’t changing, while the population (and GDP are), and the stock of farmland would be quite material relative to other business capital.

The point is not, of course, to whip businesses.  The questions are really for analysts, economists, and then policymakers, to think hard about why it is that firms –  actual or potential –  have not regarded it as worth their while to invest more heavily in New Zealand in recent decades.  It isn’t clear that any of the relevant government agencies, let alone their ministers, have a compelling story to make sense of what we observe (of private firms going about their business, pursuing oppportunities where they find them).

I’m pretty sure the answer involves some mix of these symptoms, policy instruments, unchanged constraint etc

  • remoteness
  • the real exchange rate, and
  • rapid population growth, most of which is now accounted for by policy choices

On the latter, this chart shows cumulative population growth rates over five years.

popn grwoth 5 years

It takes a while for the capital stock to adjust to growth (especially unexpected) growth in population, which is why I’ve shown the (also smoother) five year totals.

Faced with this record, defenders of the New Zealand economic model –  including cheerleaders like the Prime Minister and the Governor, but it is also much the same model as the previous government had –  should really have been expecting to see investment rates at near-record highs at present.  It isn’t even true of government investment –  and government is directly responsible for such population-based capex as schools, roads, and hospitals –  but it isn’t true of private business either.

The model simply isn’t delivering.

(I’m away for the rest of the week, so no more posts until Monday.)

Shaky groundwork

The Reserve Bank released its six-monthly Financial Stability Report this morning, followed a bit later by the Governor’s press conference.  The FSR seemed to be mostly about laying the defensive groundwork for next Thursday’s announcement of the Governor’s final decision on minimum bank capital requirements.  And the press conference was mostly pretty tame, the Governor having announced that he wouldn’t answer any questions on bank capital issues, and the assembled journalists having come quietly and not asked any.  The Governor himself was mostly on his best behaviour again.    It is to be hoped that the journalists get an opportunity to question the Governor seriously, and in an informed and open way, when the capital decisions have been announced and the year-overdue cost-benefit analysis has finally been released.

There was some discussion at the press conference about the Bank’s staffing for supervision.  We were told that they now have 38 staff in that area, up by five, although they avoided answering the question of how many people they have assigned to each main bank.   Asked about plans for further staffing increases, the Governor indicated they were planning on 30 more people, but he had to be hauled into line by his deputy who stressed that it was all contingent on how much the government agrees to allow them to spend in the forthcoming Funding Agreement.  Count me just a little sceptical that there would be much marginal value, in terms of system soundness gains, from the 30th additional person, especially if (as we must) we assume the Governor is pushing ahead undaunted with his capital plans.    It was one of the Governor’s own vaunted “independent experts” who wrote recently.

The RBNZ has adopted a principle of being conservative as regards bank capital to offset possible risks from its light-handed approach to supervision. That is a choice and one partly based on the view that having very large resources devoted to intrusive oversight of banks is not the most efficient road to go down. That is a conclusion that engineers and safety experts often apply when dealing with the design of structures. There is a choice between building bridges many times stronger than you expect them to need to be OR you having large teams of inspectors who pay frequent visits to examine all bridges and monitor flows of traffic over them.  It is clear that nearly all countries follow the first strategy.

That may be a useful guide for bank supervision.

“Belt and braces” springs to mind.

The Governor told us he hadn’t been “particularly close” to easing the LVR limits, those restrictions first put in place –  as avowedly “temporary” – more than six years ago.  Now that the central bank has been delivered into the hands of enthusiasts for direct controls, facilitated by a government with not much belief in indirect instruments or markets, we must assume it would take something really rather severe to see the LVR controls lifted again.  It has always reminded me of exchange controls –  imposed in a hurry in 1938, finally fully lifted in 1984.   But again, no one seems to have thought to ask whether there would not be an element of “belt and braces” about having binding LVR controls in place at the same time as – the already resilient (Governor’s words) banking system is facing a near-doubling of its minimum capital requirements.    I guess enthusiasm for regulation begets enthusiasm for yet more regulation.

Remarkably, in the FSR the Bank claimed that there had been a “gradual reduction in housing market imbalances”.    It wasn’t fully clear what they had in mind, but since those words appeared in the same (short) paragraph that featured a link to this chart, it appeared to be something about price to income ratios.

imbalances

The price to income ratio might have fallen back in Auckland, but it has been continuing to increase in the rest of the country (taken together) and for the country as a whole a current ratio (estimated) of 6.64 is immaterially different from the peak of 6.78.    Whether these are really “imbalances” –  as distinct from equilibrium outcomes given land use restrictions –  is another question.

The Bank itself persists in minimising the importance of these fundamental regulatory distortions.  In the FSR there is a box which attempts to address the question “How have lower long-term interest rates affected housing valuations?”    It is an attempt to argue that low(er) interest rates themselves are a big part of what has gone on.

This is their main chart (in which it is a little puzzling why they start from 2009 –  the depths of the recession/crisis –  rather than, say, take a peak to peak approach).

house prices FSR

Focus on the left-hand panel, for the entire country.   (In these charts, blue bars are positive contributions and red bars negative ones.)   It isn’t very satisfactory that they appear to have modelled nominal house prices rather than real house prices. It isn’t clear why they have done so, but (at very least) it appears to be convenient for them, enabling them to (claim to) show that lower interest rates are a big part of what explains house prices rises, when lower inflation expectations –  an offsetting factor (in red) –  would be expected to be fully reflected in lower nominal interest rates over a 10 year horizon.  Taken together, the effect of real interest rates looks quite small.

Similarly, this highly reduced-form approach tends to imply that rents are an exogenous explanatory factor in house prices, and using nominal (rather than real) rents only compounds the problem.  As I’ve pointed out here on various occasions, the sharp fall in real long-term interest rates should have been markedly lowering real rents over the decade –  real rents should be more affordable than ever.  Almost certainly it is the supply restrictions, interacting with unexpected population surges, that has driven up house prices, in turn driving up rents.    Interest rates are, at most, a second order issue: had the OCR not been lowered in line with the fall in neutral rates then –  all else equal – house/land prices would be lower, and the entire economy weaker.

Perhaps an easier way to see the point is this chart, showing the BIS measure of real house prices for the advanced economies in aggregate.

real house prices BIS 19.png

Real and nominal interest rates have fallen a lot almost everywhere in the advanced world since 2007 (Japan excepted) and yet real house prices are barely higher now than they were in 2007.    Lower interest rates do not explain high house prices, rising rents certainly don’t.  The culprit here (and in Australia) is tight planning restrictions, the effects of which are exacerbated by rapid population growth.

There were a couple of other significant points in the document that caught my eye, consistent with my description of the document earlier as laying the defences for the capital requirement increases next week.

The first related to credit conditions.    You will recall that the Bank recently released the results of its credit conditions survey. I wrote about them here.   Across the various classes of business lending, actual credit conditions were reported to have tightened quite a bit, and conditions were expected to tighten further over the coming six months.  And why?   Well, this was the chart –  from their own data.

credit 4

“Regulatory changes” is explicitly identified as the biggest single factor –  surely mostly the bank capital proposals –  closely followed by “balance sheet constraints” and “your bank’s risk tolerance”, both which one would expect to be directly influenced by the expected change in capital requirements.  And yet not a word of this made it into today’s FSR, presumably because it would have been a bit awkward or uncomfortable to have confronted it directly.    (There were a couple of mentions of credit conditions, but none of the role their own policy proposals appear to have played.)

And then there were stress tests.  One of the highly unsatisfactory elements of the way the Bank has tried to spin the case for much higher capital requirements is their reluctance to engage seriously with the results of various stress tests done this decade, all of which – no matter the shock – suggest that the banks come through in pretty good shape, in turn suggesting that (a) banks have plenty of capital and (b) bank lending standards in recent years haven’t been that bad at all.  Typically the Bank waves its hands, suggests the stress tests might not capture things perfectly, and hurries on to another issue.   But in this FSR they’ve come up with a new argument –  not previously seen, at least as I recall it, in a year of consultation.

While the stress tests are calibrated to a severe downturn event, the Reserve Bank is seeking to ensure that the system will be resilient to even larger shocks.

Well perhaps, but the scenarios they’ve already tested seemed plenty demanding (and appropriately so).  For example, a 4 per cent fall in GDP, a 40 per cent fall in house prices (and a 50-55 per cent in Auckland house prices) and an increase in the unemployment rate to 13 per cent.  It is the interaction between lower house prices and higher unemployment rates that creates large mortgage losses.

There are few examples anywhere of house prices falling more than that (including in the crises –  typically in fixed exchange rate countries –  people like to quote), and as for the unemployment rate, I devoted a whole post to that a few years back, where I concluded that there was not a single example, across the entire OECD, where a floating exchange rate advanced economy had experienced an increase in its unemployment rate as large as was implied by the Bank’s stress test in the entire post-war era (now 75 years, across perhaps 25 market-based countries).   The Bank seems to be wanting to prepare for a Greek crisis, or for a rerun of the Great Depression, without taking account of the stabilisation role monetary policy and a floating exchange rate now play in countries like New Zealand.   Without a lot more open engagement on the sorts of risks they see, it is pretty tawdry stuff.

In the course of his press conference, the Governor took the opportunity to wrap himself around the recent reports of the foreign academics he’d hired to provide some comments on the Bank’s capital proposals, lamenting only that these “excellent”, “very positive”, “wholly independent of us” reports hadn’t had much local media attention “unlike some other views” (it wasn’t quite clear who he was having a dig at there, but perhaps Kate McNamara’s stories are still leaving a sting).   Victoria University academic, and bank capital expert, Martien Lubberink was live-tweeting the Governor’s press conference and was moved to observe of these reports

I wrote about those reports in a post a few weeks ago, summarising

As I said at the start, for handpicked reviewers, chosen at a time when the Governor had already put his stake in the ground, the reports were much what one should have expected.   The Bank seems to have taken the reports as reassuring support –  but that is why they hired these particular people, known for particular predispositions –  but I suggest you don’t.  Many of the bigger picture questions simply haven’t been engaged with, adequately or at all.

(many of those bigger picture questions were rehearsed in the post)

and went on to conclude that there was a surprising absence from the reports (and from any Reserve Bank papers on the issue)

And, somewhat to my surprise, I didn’t see any mention at all of the paper that came out three months ago, from a working group of major central banks, looking at issues around appropriate minimum capital requirements, working within the academic framework these reviewers are comfortable with.   I discussed that paper here and  highlighted this chart and these issues

On my reading, this is the bottom line chart in the BCBS paper.

bcbs chart.png

They report the net marginal economic benefit (slightly lower GDP each year, offset against savings from a less serious crisis decades hence) from higher bank capital ratios, drawn from a series of studies.    On these models there were really big gains in lifting capital ratios, up to around to around 9-10 per cent.  If there are gains at all –  and they don’t report margins of error around these estimates –  they are looking extremely small beyond about 13 per cent.    Perhaps that doesn’t sound too far from the 16 per cent number the Reserve Bank is proposing for the big banks but (among other limitations, many made inevitable by data limitations):

  • this modelling is done on actual capital ratios, not regulatory minima (a 16 per cent minimum ratio is likely to see banks aim for something between 17 and 18 per cent actual ratio), and
  • none of this modelling takes account of differences in accounting and regulatory treatment across countries: conventional wisdom, (backed by estimates done by PWC) suggest that effective capital ratios in New Zealand (and Australia) would be far higher if things were measured the same way they were done in various other advanced countries, and
  • none of it takes account of the regulatory floor in how risk-weighted assets are calculated.  As the Bank is quite open about, a significant part of what is proposing is that in calculating risk-weighted assets, the big banks will have a floor of 90 per cent of what the standardised rules would generate (the more normal floor is, as I understand it, about 72 per cent).  A 17.5 per cent headline actual capital ratio would, on RB proposed rules, be akin to something like 20 per cent in the sort of framework the BCBS authors are looking at.

Nothing in this paper suggests any reason for confidence that effective capital ratios of, say, 20 per cent of risk-weighted assets would be generating net economic benefits, even on the (overly pessimistic) macro assumptions the authors are using.  But that is what the Reserve Bank claims to believe.  The onus, surely, is on them to show us, and to engage on their assumptions and analysis – in open dialogue – well before decisions are made.

Neither in todays report nor in the press conference was a rigorous, open, accountable, excellent central bank of the sort we should expect on display.     Perhaps it is too easy to become accustomed to this mediocrity.  Perhaps that accounts for the not-very-searching questions at the press conference –  nothing at all for example about the recent very public concerns about the Governor’s conduct over the bank capital proposals.

Next week all will be revealed. No one seems to expect any material departure from the initial proposal, even if there are a few cosmetic modifications, or adjustments to the transitional arrangements.  Perhaps then we will get all the answers: really good and convincing cost-benefit (and associated sensitivity) analysis, serious engagement with the serious analytical points raised in submissions (rather than attempts to treat submissions as akin to a public opinion poll), a sustained narrative around transitional paths and risks in allowing material tightening in credit conditions when conventional monetary policy is almost exhausted, and so on.

Perhaps.

Work, income, technology and all that

A few weeks ago, commenting on one of my posts on New Zealand’s relative economic underperformance, a reader (a former Treasury economist) encouraged me to read  Jobs, Robots & Us, a book published earlier this year by Bridget Williams Books and written by Kinley Salmon, an economist and consultant (formerly of  The Economist and McKinsey) raised in New Zealand but now resident in the United States.   My reader suggested that he thought “the politics will not appeal” but that there were useful insights in the book.  So I bought and read it.

It is a funny mix of a book. It is written in an enviably accessible style and has positive blurbs from an impressive range of fairly prominent  and well-regarded economists (David Autor, Lant Pritchett, Diane Coyle, Dani Rodrik, and Ricardo Hausmann).   He covers a lot of material (50 pages of endnotes/references –  including, I noticed, one to a post from this blog).  There was the odd, really interesting, fact I didn’t know.  For example, that the first solar panel was created in 1883 and that what is essentially today’s approach to solar panels was developed in 1954, or that self-driving cars managing 90 kms per hour were a thing as long ago as 1987.    And there was a lot I was nodding along to or putting ticks in the margin beside.  There is little sign that “robots are coming to take our jobs” in any very rapid or disruptive sense, and in support of that argument he uses lines I’ve used here before: labour force participation is high (thought not, contra Salmon, record highs), unemployment rates are modest, and recorded productivity growth (especially in frontier countries) isn’t exactly dazzling.

Last week I wrote, quite critically, about the Productivity Commission’s latest draft report, suggesting that it was pursuing personal political preferences of staff/commissioners around a bigger welfare state (especially for the unemployed) under the guise of (often not very persuasive) economic analysis.  In many ways, Salmon’s book is much the same sort of piece, except that –  not being a public servant –  there isn’t a problem with him championing his social democratic vision of the world (or, rather, New Zealand –  if I didn’t mention it earlier, the book is deliberately very New Zealand focused).  In fact, it is a useful contribution to the debate around such issues, helping to frame some of the issues.   It isn’t explicitly partisan and I’m pretty sure no New Zealand politician or political figure even gets a mention (unless one wants to include Adrian Orr under that heading) but his sympathies are pretty clear.  Indeed, reading the book I was left wondering if it was intended, at least in part, as a marketing exercise for a spot on Labour’s list some time down the track, if the author ever comes back to New Zealand

In fact, Salmon links to an interesting short paper he wrote for Labour a few years ago, on the Danish flexicurity system that he –  and the Productivity Commission – champion.

Advocates of flexicurity claims that the social compact that gives rise to such provisions makes for more flexible labour markets –  people will more readily move to where the new and better opportunities are.  In this chart, the higher the number the more restrictive the law.

EPL

In his Labour Party note, Salmon also notes that 25-35 per cent of the Danish labour force change jobs each year.  In the New Zealand LEED data about 15 per cent of workers change jobs each quarter (you can’t simply multiply those numbers by four to get an annual rate, because some people will do several jobs in the course of the year).   Either way, of course that rate of turnover is (much) faster than the underlying technologies are changing.   And advocates of flexicurity –  protecting people involuntarily displaced –  often seem to overlook pointing out that most job changes, including those associated with technological change, occur voluntarily (were it otherwise there would be no new-tech firms/jobs in France, given their scores for employment protection legislation.)  Large scale multi-year unemployment problems are much more often the consequence of recessions – or, more rarely, major structural policy changes –  than of technological change.  And, of course, the ability to handle recessions –  and associated unemployment –  is much more constrained in a country like Denmark, which has a fixed exchange rate and thus no ability to use discretionary monetary policy.

But back to the book.  Here, his bottom line message seems to be that we (New Zealand) can, to a considerable extent, make our own future, and can make collective choices about how as a society we respond to new technologies.    He devotes two chapters to alternative visions, each built –  in easy to relate terms –  around individual families 30 years hence.     One, to be honest, looks a lot like now (only richer) –  but might have been just slightly more persuasive if the family concerned wasn’t generating its main income from an industry (film) that exists here now only because of heavy taxpayer subsidies.  The other was one in which most people choose not to work, but live comfortably on some mix of a UBI and a state allocation of equity shares to all when they turn 18.

Perhaps it is a useful expositional device, but I’m a bit more sceptical about quite how much choice individual societies collectively really have.  After all, technologies today are hugely different (and more advanced) than they were 100 years ago and yet –  despite reasonably significant differences in the size of government –  in important respects most advanced countries really do look pretty similar (eg no society has chosen to settle for 1950 living standards and taken the improved possibilities in dramatically shorter working weeks/lives).  And, despite Salmon’s attempt to be New Zealand specific, it is striking that “Australia” doesn’t appear once in his index (although I do recall one mention) and there is no discussion at all of how potential political choices here might be reflected in, for example, changes in the net flow of New Zealanders to Australia (the much richer exit option for decades now).  In fact, much of his discussion is really quite North Atlantic in focus –  perhaps reflecting Salmon’s own education and employment, and the authors he cites (eg those who blurbed the book) –  and he doesn’t seem to engaged in any depth with the severe limitations New Zealand’s geographic remoteness poses, or the steadily widening gaps between the productivity performance here and that in the leading OECD countries.  I guess one can’t cover everything in a single book.

Perhaps where I would be more critical is that on some issues he doesn’t seem quite sure what line he is taking from chapter to chapter.  Tax is a good example, where at some points he worries about advanced countries being too reliant on taxes on labour, and taxing capital too lightly, making the point that firms will seek to economise on expensive inputs.  But later in the book he is openly talking up the possibilities of higher (labour) income taxes, the use of payroll taxes “consistent with incentivising greater automation”.    He also can’t seem to make up his mind whether low interest rates are dreadful –  encouraging too much use of capital –  or something really positive, from a pro-active set of central banks.  Whichever he wants to plump for, he substantially overstates the importance of central banks (or fiscal policy) in influencing medium-term real economic outcomes.  He cites (approvingly) Adrian Orr urging firms to invest, without showing any sign of having thought hard about (a) why interest rates might need to be so low, or (b) why business investment rates in New Zealand have been so low for decades.    And perhaps there is a similar tension between his enthusiasm for something like flexicurity and the way he (rightly) highlights just how serious the implications for individuals (mental health etc) of prolonged unemployment can be.

Salmon comes down on the side of expecting that decades hence things will look much as they do now, in that most adults will still get up and go to (paid) work. I suspect he is right about that.  But I was somewhat puzzled by his paid-employment focus. He talks about how “it is at work where we most often find ourselves in a state of flow: that feeling of being totally immersed in an activity, energised by it and enjoying the process”.  He goes on to assert that (paid) work is a good thing because someone tells us what to do, and in the process we rise to challenges etc.  We need, on his telling, external mechanisms that force us to commit.     To be honest, it seems like the perspective of someone with a particular set of skills that are very valuable in paid work, without community involvements, and someone without too many ties elsewhere (no kids as far as I can see, his own family thousands of kilometres away).

I take his point about some retirees blobbing in front of the TV and going into decline.  But the energy and engagement and commitment of being a stay-at-home parent –  particular of very young kids –  seems something alien to his world.  And as someone who has got up each week day for almost five years and written something here, not because I have to but because I enjoy doing so, it all seems a little alien to me. Or I look at the energy and activity (often more than a little exhausting) of my (formally retired) in-laws. Perhaps these days plenty of people do need the structure work imposes, and there is certainly an ongoing demand for the services/goods paid employment provides the ability to purchase.   But it didn’t seem quite the open and shut case Salmon makes it out to be.

There is quite a bit more in the book including on climate change and a bit on immigration, where his views seem to be pretty conventionally North Atlantic centre-left (including the failure to recognise the role that rapid population growth –  or lack of it – plays in explaining why, for example, New Zealand’s emissions were rising while those of, say, Denmark and Germany were flat or falling).

It was, as I said, a funny mix of a book.  Perhaps it was really two quite different books.  One was a fairly useful survey of the issues and literature around technological change and the options, possibilities, risks etc.  That book wasn’t really very New Zealand focused at all.  And the second, woven through the first in the book we actually have, was his own policy preferences and political inclinations.   Fair enough. It was his book, But I read books I don’t really expect to agree with to be challenged and extended, to understand where others are coming from, and perhaps even to at times change my mind on some things.  Perhaps I wasn’t the target readership, although the fifty pages of notes/references suggests it wasn’t mainly a mass market publication either.  But I didn’t come away from the book particularly challenged or extended. In a way that’s a shame, because Salmon clearly has thought quite a bit about a number of the issues, and he isn’t just a partisan hack.    Despite the blurbs, perhaps the book would have been better for having taken a bit more time to test the argumentation on the policy side a bit more robustly.  And, of course, any book thinking about the New Zealand economy and its prospects needs to grapple much more seriously with the actual experience of decades of relative decline.


The unimaginable dystopias we live in

I’m not sure if it was planned but there was a distinctly dystopian tinge to the magazine section of the Sunday Star-Times yesterday.

The Editor’s Note dealt with the pervasiveness of dystopian themes in the modern books being read by children and “young adults”.    There have been plenty of these in and through our household –  the Wellington libraries seem abundantly stocked with them.  I’ve even read a couple –  the kids seem to like the idea (nay, strongly urge) that Dad occasionally reads one of their books.  I haven’t yet succeeded in getting my youngest to read 1984,  Brave New World, or Children of Men, although she and I both recently read The Handmaid’s Tale and The Testaments –  and I couldn’t really disagree with her, not wholly favourable, assessment of the latter as “like a young adult dystopian book”.  I guess there are all sorts of reasons for liking these dystopian books, some of which are probably less than entirely healthy, but it is interesting to ponder the alternative societies, rules, norms (and lack of them) depicted by the authors.

A bit later in the same magazine section there was just such a portrait, “Dark Days in Dystopia”, but this time about a real place, the state of California.  The column first ran in The Times (UK) and is by Gerard Baker the (British) former editor-in-chief of the Wall St Journal.   It is online only behind the paywall of The Times but the gist is in the lead blurb

“California used to represent a fantasy of Hollywood glamour and wholesome hippie-ness combined.  But now, with blackouts, crippling taxation and unaffordable housing, the Golden State is a feudal society of super-rich and serfs”

Not being that into eiher Hollywood or hippies, I guess my impression of California decades gone by was a bit different, with an emphasis on mild weather, sunny optimism, and widely-spread prosperity.  In childhood TV terms, The Brady Bunch.  In US political terms, it isn’t that long since California was a Republican state – middle (suburban) America.

Baker’s article touches on various aspects of how California has gone bad.  But the revealed preferences of individuals are often as telling as anything and –  as he notes – Americans (net) have been leaving California for years (in the ten years to 2016, a net 1 million left).

Baker makes quite a bit of the breathtakingly high tax rates in California, but his main focus is on housing, “almost unimaginably unaffordable for most Californians” which is, of course “an entirely human-made debacle”.  He quotes a (Democrat-sympathising) academic, Joel Kotkin, who “describes California as a reimagining of medieval feudalism” in which underneath the “wealthy elites” who promote and champion the panoply of problematic policies

are the modern serfs, who can barely afford the land they must rent from their masters. They have no assets, no stake in their economy and, thanks to prohibitive housing costs, have limited mobility.

The column ends

California has always been eyed as a signpost to the future.  The dystopia there might be a warning to voters everywhere.

The column might seem a touch over-written to you (it probably does to me as well) but it was some of the concrete details in the midst of the rhetoric that I latched onto.

The median home price in California is $614000 (NZ$959000), almost three times the national average. The California Association of Realtors’ housing affordability index estimates the percentage of households that can afford to purchase the median-priced home.  For California, that number was 31 per cent….for the US as a whole it was 56 per cent.

But what about New Zealand?

The median house price here is now $607500 (in October, according to REINZ).  That is a lot cheaper than California, of course.  But we, on average, are a lot poorer than Californians.

Average GDP per capita in California is about US$66000.  Here, it about NZ$62000.

In other words, the ratio of house prices to income (this time proxied by GDP per capita) is much the same here –  just a bit worse –  than in California.   I’m a bit wary of median household income figures –  just because I know the data less well – which are more often used for house price comparisons, but it doesn’t look as if the comparisons would be much different in one used that data.   We have our own human-made housing dystopia, without even the consolation of those hugely successful tech companies that also still characterise California.  We have an ongoing productivity failure.   And with few/no offsetting compensations –  between volcanoes and earthquakes, probably much the same sort of natural disaster risk, and –  for those in Auckland in particular –  congestion that seems to rank high (badly) by advanced world standards.   Who’d have imagined just a few decades ago the local dystopia we’ve let our “leaders” create?

And what of the prospects of the next generation?  One of the downsides of living with me, is that my kids get to hear my fulminations about the disgraceful government failure that is our housing market, which in turns engenders occasional, slightly despairing, comments from them about the unlikelihood of ever being able to afford a house in New Zealand.

I was having one of these conversations with one of my daughters the other day.  She was asking how much I’d paid for my first house, which is just down the street and which we walk past quite frequently.  I told her I’d paid $155000, which brought gasps of astonishment. I did hasten to point out that there was this thing called inflation and in today’s dollars that was something like $290000, but it didn’t really change the point (in our unprepossessing but pleasant suburb the median house price now appears to have passed $900000).

When we have these conversations I periodically point out that real mortgage interest rates in 1989 were a lot higher than they are now, that first home buyers probably shouldn’t be expected to buy a median house, and that there are cheaper parts of cheaper suburbs (without, say, having to fall back on the desperate expedient of relocating to my childhood home of Kawerau, where median prices have recently rocketed back up to…about $290000).  I think the kids are right to be uneasy, but smart hardworking well-educated people who marry sensibly will probably eventually be more or less okay.

But in the course of our conversation I got to think about my parents.  They bought a first house (new) in Christchurch in 1962, just before I was born.  It wasn’t a particularly big house, but it was an 809 square metre section –  bigger than most Island Bay sections. My father was 27.  Dad had gone to work at 16 –  as probably most people did in 1950 – working as a clerk at the BNZ and by this time he had his own small newsagent’s shop in Riccarton, but was just about to move back to a salaried position.  Mum didn’t work after I was born –  as probably most mothers didn’t in those days.   There wasn’t –  at least that I’m aware –  family money behind them.    But at 27, on a single income (not supported by tertiary qualifications or lots of overtime), they had their own (new) house in one of our bigger cities.

I don’t suppose it seemed extraordinary then.  It was what young couples typically did.

I’m not suggesting it is impossible now: there are, from the time to time, those stories of extraordinary young people who through hard work, thrift and a focus on one goal have purchased a house very young. But it is extraordinarily difficult now for those who are poorer, less-skilled, less well-qualified, with children.   Almost inconceivable for young people earning average incomes for their age to even think of doing it on a single income in any of our bigger cities, at least without enormous sacrifices of material living standards.    Perhaps simply impossible in Auckland.  And if the groups most severely affected aren’t exclusively Maori and Pacific, they are disproportionately so.

It is a human-made dystopia.  And the humans who lead our governments (central and local) seem quite uninterested in doing anything serious to fix the problems.

Teaching/examining economics

The NCEA level 2 economics exam took place yesterday afternoon.  I’d been helping my son with his revision and preparation, in the course of which he’d shown me various exams papers from recent years, and some guidance they’d been given on how to answer some of those (past) questions: what might get Achieved, what Merit, and what Excellence.

I wasn’t exactly reassured by what I saw.

As one example, consider this question from last year’s paper 91222 “Analyse inflation using economic concepts and models”.

The first questions were introduced with this statement

The Quantity Theory of Money states that the quantity of money circulating in the economy is equal to the monetary value of the goods and services available in the economy.

The quantity theory of money starts from the identity –  for thus it is –  MV=PT, where

M = some measure of the money supply,

P = some measure of the price level,

T= some measure of real economic activity (you could think of real GDP, but it generalises –  think volume of transactions), and

V =  the velocity of money (or how frequently the stock of money –  as defined –  turns over (“is spent”) in the period in question.   It is generally derived residually.

All that identity is saying is that the amount of money that is spent (stock multiplied by times it is used) equals value of transactions in the money economy.   The amount of money that is spent = the value of what it is spent on.  Necessarily.  By definition.  Change your definition of money –  the Reserve Bank publishes several, and there are others –  and your V will change too.

As a New Zealand example, nominal GDP in the year to March 2019 was $300.994 billion. The Reserve Bank’s broad money measure averaged $304.193 billion over that year and its narrow money measure was $68.375 billion.   So, on this measure of nominal activity, V(b)  (“broad money velocity”) was 0.99  and V(n) (“narrow money velocity”) was 4.4.

MV=PT is really known as the equation of exchange, and it only turns into a theory (about behaviour) when expressed in the idea that if you change the quantity of money most of the effect will typically be seen in the price level (or that most changes in the price level stem from changes in “the money supply”).  In the extreme, it is a simple enough idea –  in massive hyperinflations there is lots more “money” around (on any measure) and much higher prices/inflation rates (on any measure.  But the theory was mostly used in simpler stabler times (since in the midst of hyperinflations, not only does the velocity typically accelerate –  no one wants to hold money longer than they have to –  but real economic activity is also typically shrinking, perhaps rather a lot).

So what disconcerted me about the NZQA efforts?

Well, go back and look at that definition of the quantity theory of money.   Does it mention the idea of velocity?  No, not at all.

And then it talks of the “monetary value of the goods and services available”which has a fairly strong sense of stocks, not flows.   Any serious description of this equation/identity would stress that it is about transactions/turnover, not stuff that just happens to be around (whether sitting unsold on shop shelves, in factory inventories, or in the cupboards at home).

Now, in fairness to NZQA the very first question asks the students to label each of M, V, P, and T, so probably people wouldn’t be too misled by the omission of any sense of velocity in the introductory description.  But shouldn’t our teachers/examiners be taking care to be as precise and careful as possible, both to set a good example, and so as not to risk confusing or distracting kids who have read/thought a bit deeper?

The next question reads

Using the Quantity Theory of Money equation, fully explain how a 4% increase in the money supply could affect the price level, assuming other variables are constant.

As I pointed out earlier that MV=PT is an identity, I hope you can see why this question isn’t written anywhere near as carefully as it should (and quite easily could) have been.  In an identity with four variables, if one of those variables changes and two are held constant by assumptions, there is no “could” about what happens, but a “must”.  If V and T are held constant and M increses by 4 per cent then. by definition, P increases by 4 per cent.  Of necessity.

I checked the NZQA marking guide and it is clear that the examiners know this: they talk explicitly about how prices “will” rise by 4 per cent.   But then why muddy the waters for the students?   It isn’t even as if the marking guide says something like “students will get extra credit for pointing out that the 4 per cent price increase is a necessary implication, and there is no “could” about it.

The questions continue, with the third question designed to better winnow out the Excellence and Merit students from the Achieved ones.  The third question starts with a quote from a Treasury document

QTM

You’ll notice that the Treasury projections quoted are for an average annual growth rate over the next five years.  By contrast, the assumed exogenous increase in the money supply is a one-off levels increase.

The examiners don’t appear to have noticed the difference.   It is clear what they are trying to get at (P will increase less if T is also rising than if it isn’t).     That’s the answer to the third bullet above. But the marking schedule  makes it clear that they expect the students to answer that in that growth scenario the price level will rise by (about) 1.1 per cent.  But that isn’t the case at all: instead in the first year the price level would rise by about 1.1 per cent and then it each subsequent year it would fall by (about) 2.9 per cent (since T is changing and M no longer is).    But, again, there is no hint that markers should give additional credit to students who point this out.  (Although they do give extra credit to students who point out the V might change –  perhaps rise –  in a recovery.)

Again, there is really no excuse for questions this badly worded (for 16 year olds).  They could easily have posed the questions as “if the money suppply increases by 4 per cent per annum, what will happen to the inflation rate if (a) all else (V) is constant and (b) if real economic growth (in T) happens per the Treasury projections”.

It is sloppy and loose, and suggests that the examiners (and those reviewing their drafts) just haven’t thought carefully enough.  And that is even without posing questions about whether introducing year 12 kids to inflation using models that rely on exogenous money supply increases (when most increases in the money supply these days are actually endogonous –  arise simultaneously with economic activity and the credit creation process) is that most helpful way to structure the curriculum.

The other one that disconcerted was from the 2016 exam for the same level 2 NCEA standard (I didn’t go through them all systematically – these were just ones my son asked about).   This was a question about deflation.

deflation NCEA

Here what disconcerted me (a lot) was the answers NZQA was looking for in its guidelines for markers.  But the question wasn’t great either.

The key starting point for thinking about the effects of inflation/deflation is that, broadly speaking, there is long-run neutrality (most real variables won’t be much affected by trend inflation/deflation), but that distributional effects can be quite powerful in respect of unexpected inflation/deflation.    Broadly speaking, (unexpected) deflation is great for people with fixed-term/rate bank deposits (the real purchasing power of their money rises) and dreadful for people with fixed-term/rate nominal debt (the real value of what they owe rises).   Otherwise, all else equal, prices, wage, interest rates etc should all adjust to whatever the inflation/deflation rate is, and to much the same extent.

The questions don’t distinguish between expected and unexpected deflation.  Perhaps that isn’t unreasonable for most year 12 students, (but what about those who had read on, or thought more deeply, perhaps even read an MPS?) but it does make quite a bit of difference, and it isn’t obvious that even the markers recognise the difference.

This is the sort of thing I mean.   In answering the first part of the question, the markers are looking for this to get Achieved

Explains the effects of deflation in New Zealand on younger people saving for their first home (e.g. Deflation will mean that people saving to buy their first home will have a lower cost of living and be able to save more).

But this is simply nonsense since one would normally expect that wage inflation would be similarly lower and the real incomes of those young savers wouldn’t be affected, and nor (generally) would the real cost of the house they were saving for.  But to the extent they already had saved some money –  and especially if it was on a long-term fixed rate deposit –  the real purchasing power of what they’ve saved will rise.

What about the old people.  Again, the Achieved standard answer

Explains the effects of deflation on older people in retirement who use their savings to provide them with income (e.g. Older people may find that they receive lower interest income if interest rates fall to offset deflation).

Indeed they may, but…..the cost of living will be lower too.  And, in fact, the real value of those bank deposits will actually increase in this scenario.

The marking guide goes on to elaborate points students would need to make to get Merit or Excellence.  But it doesn’t really improve

Fully explains the effects of deflation on younger people saving for their first home (e.g. Younger people saving for their first home may benefit from deflation because it might increase the purchasing power of their income. This may mean that they can save more of their income to put towards the purchase of their home. It may also mean that the home may become cheaper. Deflation may also lead to lower interest rates and, therefore, make loan repayments more affordable).

That final point is fair (since mortgages are nominal the upfront servicing burden is a little easier), but it is something of a distraction because it doesn’t alter the servicing burden over the full life of the loan.  And these guidance notes suggest the examiners have no sense that wage inflation will also typically be lower if there is price deflation.

Fully explains the effects of deflation on older people in retirement who use their savings to provide them with income (e.g. Older people in retirement who use their savings to provide them with income may find that the value of their assets falls, which means that selling those assets will result in less earnings. Also, if interest rates fall even though prices may have dropped, the people will receive less income and, therefore, may have falling purchasing power).

And this is worse. There is no hint that people with fixed nominal assets are those who gain from unexpected periods of deflation.  And if the value of other assets (eg houses) they are selling falls, those falls will generally (all else equal) just be in line with the fall in the price level.  That fall does not make old people (or any other seller) worse off.   And, yes, nominal interest may fall, but there is no particular reason to expect real interest rates to fall (or thus for real purchasing power to fall).

The NZQA guidance answers to the second half of the question are only a little less bad.    In fact for the “firms producing for the local market” I’m more or less okay with the required answer (as a year 12 simplification).

Fully explains the effects of deflation on NZ businesses producing for the local market (e.g. NZ businesses producing for the local market will find that the prices that they receive for their product may fall. They may also find that their costs of production fall and, therefore, the outcome may be either slightly worse off or neutral).

All else equal-  and on a simple model – you would expect both costs and selling prices to be commensurately lower and such firms to be no better or worse off on this count.  A really smart student might point out that if these firms had material debt outstanding, the real value of that debt would rise, but that is probably a complication too far for year 12 and this bit of the question didn’t mention debt.

But the exporting firms answer is more troubling

Fully explains the effects of deflation on NZ businesses producing for export (e.g. NZ businesses producing for export may also face falling costs of production; but if their markets do not have (or have less) deflation, then they may find that their profit margin rises and, therefore, they may be relatively better off).

But…….our exchange rate has been floating for 35+ years now, and I know year 12 kids get introduced to the exchange rate, and yet this suggested answer implies that the competitive position of our exporters can be improved by a period of deflation.  Over any sustained period deflation here –  not matched in other countries –  would be expected, on simple models, to see an appreciation of our exchange rate, leaving New Zealand producers neither better nor worse off as a result.   (These adjustments do actually tend to happen – you can see it in the trend appreciation of the NZD/AUD consistent with the slightly lower inflation target here than in Australia.)

You’d have to hope that a smart kid  – or just moderately well-read or alert one (they do get exercises that involve looking at real world documents like MPSs –  who made these points would get considerable credit from the markers, but if even the examiners don’t seem to be aware of the point, how many of the markers could be counted on to exercise some independent judgement.

Not one of the points I’ve made here is any sort of highly subtle or technical points.  These are just the simple implications of pretty simple models – ie the sort of standard one might be looking for year 12 kids to be taught, and to be able to understand and repeat in examinations.  But it isn’t clear, that on these questions at least, even the examiners quite understand what they are saying or asking, or how even a simple model works.

I haven’t engaged in a systematic study of all the recent economics exam papers (let alone those in other subjects, most of which I know less well).  I’d really like to think that these two sets of questions I’ve highlighted in this post are exceptions and everything else is just fine.    But, as we used to say in PNG when we saw a dead snake on the road, the real issue wasn’t so much welcoming the dead snake as wondering at all those still lurking in the same neighbourhood.

The New Zealand Initiative was out earlier this week calling for more emphasis on teaching specific bodies of knowledge in the various academic disciplines.  I don’t really disagree with them, but when exams for upper-level kids have the sorts of weaknesses highlighted here it suggests there is quite a long way to go in even getting teachers equipped to offer a systematically better offering.  As things stand, NZQA should be upping its game.  Clear questions and correct answers (to guide markers) would be a good start.


Spin….just spin

I suppose all Prime Ministers these days feel the need to spin.

Ours was at it again yesterday.   She was talking over breakfast –  a vegetarian one the Herald account tells us – to the Trans-Tasman Business Circle.  Her topic?

The topic I have been given for today – ‘The Future of Work and how the government is preparing for the economic challenges of the future’

It is pretty much downhill from there.

Countries the world over are currently grappling with digital transformation, and transitioning their economies, and New Zealand is no different in that regard.

Even if you pardon that abuse of the language (“transitioning”), does anyone have any idea what this means. Individuals and firms are getting on with their lives, looking for opportunities, as it long has been and no doubt long will be.  Are technologies different than they were fifteen years ago?  Of course.  But is our economy that different than it was fifteen ago?  Sadly, probably less so than one would hope.

That isn’t the prime ministerial spin though

Where we are different, I believe, is in the way we are responding to those challenges, turning many of them into opportunities.

The country with weak productivity growth, drifting further behind the rest of the advanced world, and with declining shares of GDP accounted for by trade with the rest of the world.

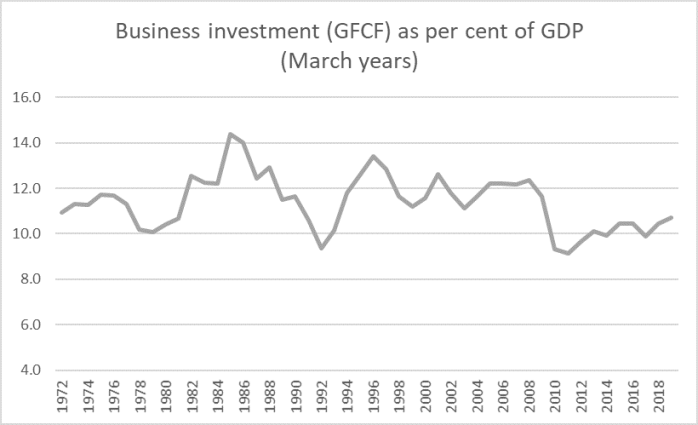
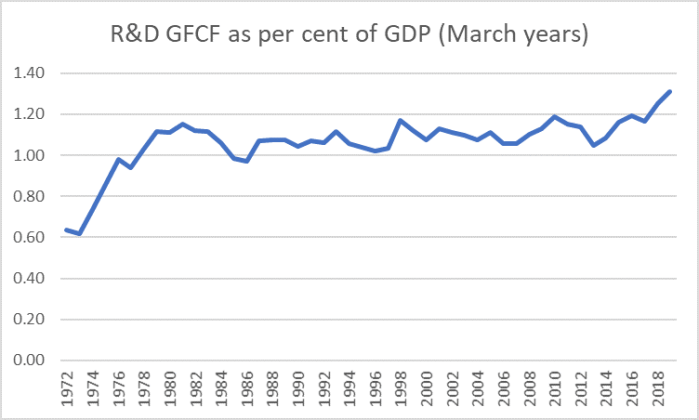
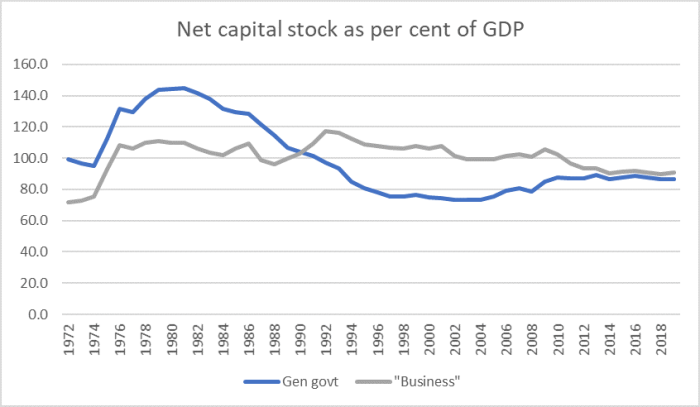
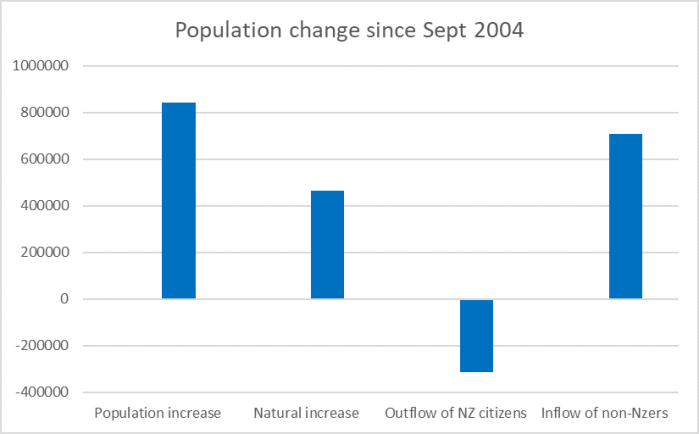
As it happens, the annual national accounts were released later yesterday morning.   I was playing around with the data and might use it for various posts in the next few days, but since the PM was talking about “digital transformation”  I thought this chart was interesting.

cap stock 19.png

Now not all of these, by any means, are about the narrow “digital transformation”, but if such a thing were happening on a large scale, in which new world-beating opportunities were being developed and seized, these indicators are among those where we might expect to see it.  As it is, over the last few years things to have been more or less going sideways.

The PM went on to first offer some context

Firstly, the NZ economy is in good heart amid the global challenges and what many believe are new economic normals,

Well, okay, believe that if you want.  But most respondents to surveys don’t share your positivity, and in general they are less likely to be motivated reasoners than a PM.  And

Secondly, the Government and Reserve Bank are doing their bit to ensure that fitness endures and it’s important business continues to work with us too – after all, we mustn’t talk ourselves into a funk

We are right, you are wrong.  Get with the message.  Or at least that seemed to be what she was suggesting.  Just a shame the data don’t tend to support her.  I’m still not sure what the Reserve Bank has to do with “that fitness” (whatever it is) –  presumably she hasn’t had it schooled into her that the OCR is typically cut (in an economy without big positive productivity shocks) because demand is weak and things aren’t going that well.  Oh, and is she perhaps aware of those big new capital requirements the Governor is wanting to impose on banks, and hence on the availability of credit to the economy?  If she is embracing those, that would be an interesting call –  her Finance Minister has been very careful to disown all responsibility.

Anyway, she gets into her stride in a section headed “It’s the economy”.

All of you in this room will know that this Government’s approach to the economy is that it is not an end it itself but, rather, a means to an end.

Which might be news if, just perhaps, she could point us to any government in history, or even just New Zealand history, for whom that was ever not so.

That of course means building strong economic foundations. And on that front we’re doing pretty damn well actually, especially amid global uncertainty.

The argument must be weak so lower the tone of the language.  No one is going to dispute that successive New Zealand governments have successfully focused on budget balance and a modest level of debt.  What about her other claims?

So far our policies have delivered growth of 0.5 percent in the June quarter and average growth of 2.4 percent in the year ending June. That shows that the New Zealand economy continues to outperform those of Australia, Canada, the Euro area, the UK, and the OECD average – basically those we compare ourselves to.

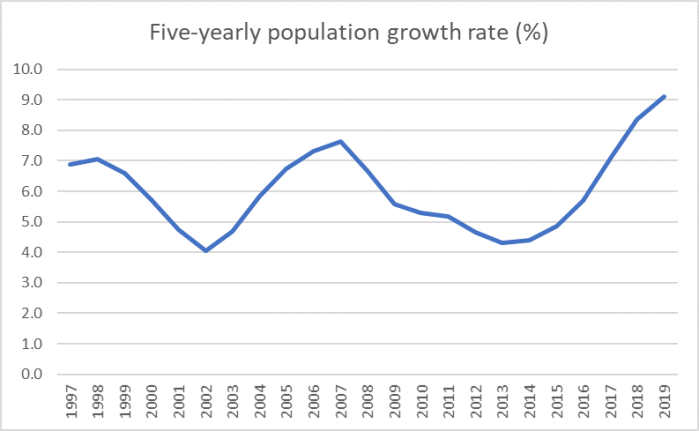
That tired old line so beloved of whoever is in office, right or left, and their champions.  Never mind that we have substantially faster population growth than all of those countries except Australia and that any reasonable and honest use of GDP statistics in a a discussion about success, wellbeing or whatever, starts from a discussion of GDP per capita.    On that score, there is nothing impressive about even our recent record, let alone the longer-run picture.

Also, recent data shows New Zealand’s manufacturing and services sectors are both expanding.

Well, yes that is probably so, but…..when your population is growing by 1.5+ per cent per annum if those sectors (ie the bulk of the economy) were actually contracting it would be really quite alarming.

We have record low unemployment and annual wage growth is at its highest level since the 2008 financial crisis. Average wages have increased by 4.2% in the last year alone.

Yes, relatively low average unemployment –  consistent with the typical person being unemployed for “only” two years in a working life –  is one of the successes of the New Zealand policy framework.  But the current rate is nowhere near a “record low” –  not even during the 30+ years of the HLFS (that was just prior to the last recession), let alone the post-war decades prior to the quarterly survey getting going.

New Zealand continues to be a good place to do business, topping the World Bank’s 2019 Ease of Doing Business index. Our globally competitive economy is underpinned with stable political and regulatory systems, an innovative well-educated population and our proximity to 60 percent of the world’s population. We are a safe place to invest.

Such a great place to do business in fact that (a) business investment remains persistently weak, especially given the surge in the population, (b) our economy is becoming more inward-focused (trade shares have been falling) and (c) another tired old line –  we are close to 60 per cent of the world’s population –  that bears just no relation to reality whatever.  Yes, we are closer to the centre of gravity of world economic activity than we were 100 years ago – when we traded mostly with the then-dominant power the UK –  but these days the UK is still closer to India and as close to China as we are.  In both cases, far away.  Oh, and we are also a long way from those leading productivity economies in Europe and North America.

And last on this list

And you’ll note that when the Reserve Bank announced its decision to hold the Official Cash Rate at 1 percent last week, its analysis confirmed the economy is in good shape, amid global economic headwinds. The Bank pointed out that employment is pretty much at its maximum sustainable level, residential investment is increasing and that economic growth is expected to rise next year, due to the Government’s investments. While the RBNZ noted that global headwinds have impacted business confidence in New Zealand, it also said that our investments are forecast to support and grow the economy next year.

When the Prime Minister says “investments” here she really just means more government spending, most of it consumption or transfers.  Probably she didn’t read the Reserve Bank’s statement, but she will have had a personal briefing from the Governor.  He too is inclined to spin, but his document had a rather lot on the downside risks –  in fact they explicitly noted, and formed policy on the basis of, the balance of risks being to the downside.  And while the Bank had rather upbeat growth forecasts, few private economists shared their optimism.

I am not wanting to suggest things are disastrously bad, at least in a short-term cyclical sense in New Zealand, but at very very least the PM is gilding the lily.   Perhaps you might think that is her job, and on a bad day I could share the cynicism, but we really should expect something better from people who hold office as leaders.

But her own summary is this

Ultimately, we have a positive story to tell, including to investors, and one of my consistent messages is that we are a stable, reliable  investment option, with plenty of success stories. Now, domestically, we  all need to act like it.

I’m right, you are wrong, get with the message.   Or so it seems.     And, yes, we do have a fair measure of political stability –  no Brexits, no civil wars etc, no impeachment hearings (just the ongoing stench of the political donations scandals) –  but that doesn’t markus out from most advanced countries, those that have been performing pretty strongly –  actually securing the productivity gains on which so much else rests –  and those, like New Zealand, that haven’t.

The next section is headed “Govt doing its bit”.  Here there is a lot about capital investment

It won’t surprise you to hear me say – infrastructure, infrastructure and infrastructure. There’s no question that we have a range of deep policy issues to address as a nation, but unless we get the basics right of providing decent housing, transport and health and education services, we’ll only compound those more complex issues. That’s why the Government’s Economic Plan, which you will have heard many Ministers talk about, is designed to build an economy that protects and improves the living standards and wellbeing of all New Zealanders through ensuring we get those most basic fundamentals right.

That’s why we are investing record amounts in hospital and school building programmes – including the fact that in our first two Budgets we’ve invested $2.45b into upgrading and building new hospital and health facilities- that’s twice as much as the previous government managed in nine Budgets – alongside large investments in transport safety, regional roads, and public transport, and we’ve done that while maintaining a responsible budget surplus.

“The Government’s Economic Plan“: that’s a good line.  I hope it got a laugh.  But perhaps the audience were more polite than that.  Infrastructure?  Well, shame about the roads that aren’t getting built, even as the population grows rapidly.  And here is another chart from the annual national accounts, showing general government investment spending as a share of GDP.

govt GFCF

Nothing startling about spending in the first full year of this government.  But perhaps it will be different in years to come.

And then the empty boasts about housing

Not to mention our comprehensive plan to fix the housing crisis which includes delivery of: more state houses than any Government since the 1970s, banning offshore speculators, expanding Housing First to end homelessness, a $400 million package for a progressive home ownership scheme, and making saving for a house deposit easier by lowering the deposit required for a Government-backed mortgage or first home grant from 10 per cent to five per cent. These are real, tangible, things that will help New Zealanders and their families.

“Comprehensive plan” and yet not a mention of the only thing that would make a durable, substantial and sustainable difference, lowering prics of houses and urban land, land use reform.  Allowing people to borrow 95 per cent LVR loans – even as her Reserve Bank keeps on LVR restrictions on private credit –  is at best papering over the cracks of the failures, chosen, of successive governments, including her own.  But give her credit for consistency:  Labour leaders (whether Little or Ardern) have never been willing to champion serious land use liberalisation.

A little further one and we get this recapitulation

Ultimately, this [Infrastructure Commission report] should all be sending two really strong signals. That we are planning for the future and that now is the time to invest. New Zealand is doing well and there are enormous opportunities if we act now. The best thing for the NZ economy at the moment is optimism, planning and investment action. We’re doing some pretty heavy lifting to shore that up in terms of spending and infrastructure investment, the RBNZ is doing its bit with record low interest rates – the private sector needs to ensure it’s on board too.

But, our economy (a) isn’t doing that well (see above) (b) and firms –  people with shareholders’ money on the line clearly aren’t seeing “enormous opportunities” to invest, either now or (in fact) for decaders past.  If it were otherwise now then, all else equal, interest rates just wouldn’t be this low –  as a macro 101 reminder to the PM, interest rates are low because demand for resources at any higher interest rates would be even weaker.

But the PM enjoins us to “only believe”, to join some sort of cheerleading squad building castles in the air.

In fact, one of my staff members asked an economist earlier this week to sum up the economy in one sentence and was told – “it’s ready for lift-off”.  I could not agree more.

Perhaps there is such an economist.  Perhaps he/she doesn’t even work in DPMC/PMO. Perhaps there even will be a bit of a recovery next year.  But just nothing suggests this economy is “ready for lift-off”.  The basic imbalances and severe structural problems haven’t been addressed, haven’t changed.

She goes on.  There is the claim

we have laid out a clear agenda. Yes, it includes change, but by now you’ll all know what that agenda entails and how we’ll deliver it.

Somehow, I suspect the farmers angsting about the current water proposals don’t see it that way.   And the government might have passed a Zero Carbon Bill, but (whatever its merits) it involves almost no substantive certainty about anything affecting business.  Do we know what is happening about Fair Pay Agreements?  And so on.

The speech goes on into a variety of other areas.  The last I wanted to comment on was this –  something to look forward to next week

Today I am also able to provide you with some insight into an upcoming announcement for the Forum. On November 25 the Forum will publish its Strategic Assessment of Future of Work Priorities. This presents four initiatives as priorities:

  • The first is Industry Transformation Plans which will ensure we add value to key sectors of our economy and leverage new opportunities. These plans – for the food and beverage, digital technology, forestry and wood processing, and construction and agritech sectors will describe an agreed vision for the future of each sector, and set out actions required to realise this vision.

(So actually, some of the “clear agenda” isn’t laid out yet, but will be next week?)

Presumably the Prime Minister takes this stuff seriously, but really who supposes that a bunch of central planners, bureaucrats and their corporate equivalents, are really likely to come up with anything useful in these “industry transformation plans”.  Haven’t we had numerous such plans before, stretching back many decades, and precisely what useful has come of them?    Market economies just don’t succeed with “agreed visions” across government and the upper tiers of existing industry players, but by competition, trial and error, creative destruction, unexpected discoveries…..all supported perhaps by governments willing to do what it takes to put a supportive overall policy environment in place.   Our goverment, much like its predecessors, is all too fond of the status quo, and unwilling to –  probably uninterested in –  getting to the bottom of why that continues to produce such mediocre economic results.

As a hint, the real exchange rate –  a key relative price that never seems to make it to the PM’s upbeat economic speeches –  remains well out of line with what you might expect for a country with such a disappointing long-run trade and productivity record.  It might be consistent with that performance, but simply isn’t consistent with delivering something much better, that “productive and sustainable” mantra ministers always keep reciting, while never doing anything much to bring about.

I guess Prime Ministers feel the need to spin, perhaps especially those who aren’t willing to do much substantial.    But it is a shame there isn’t a lot more honesty about the underwhelming state of the New Zealand economy and the reluctance of our policymakers and their advisers to do anything much about changing it.  Sheer spin might get a good headline in the next day’s newspaper, but longer-term it just feeds the growing cynicism about politicians and the political process.  It is cheap, has some short-term sugar-high effect, but is pretty deeply corrosive.  Why take seriously anything they say?

Championing social democracy not productivity

Not unlike the OECD, our Productivity Commission tends to lean left.  Not usually in some overtly partisan sense, but in a bias towards government solutions, a disinclination to focus on government failures as much as “market failures”, and a mentality that is often reluctant to look behind symptoms (which government action can sometimes paper over) to look at deeper causes and influences.

Sometimes the cheerleading for the left becomes more overt.   There was a streak of that evident in their climate change report a year or two back, but it seems particularly evident in their latest draft report out this morning.    Reflecting the change of government, the political complexion of key personnel of the Commission, the Commissioners –  while each individually capable –  appears to have shifted leftwards.

The Productivity Commission’s inquiries are into topics selected by the government of the day.  The current Minister of Finance has been keen on his “future of work” theme for years, dating back at least to when he became Labour’s Finance spokesman.  Now that he is Minister of Finance he is able to get the taxpayer to cover work in this area.  Here are the terms of reference for the current inquiry into “Technology disruption and the future of work”.

Apparently prompted by the government, the Commission appears to have begun releasing draft reports in stages.    This seems a useful step forward: potential readers or submitters might be faced with a series of 100 page drafts, not the single 500 page behemoths that the Commission often used to produce.  The draft report released last night (“Employment, labour markets and income”) is the second of five as part of this inquiry.

What it boils down to, amid various reasonable insights, is a push for a much bigger welfare state, allegedly in the cause of lifting average New Zealand productivity (and sustainable wages), without a shred of evidence or careful considered analysis connecting one to the other.    It is the sort of thing you might expect a political party to come out with –  the Labour Party conference, for example, is meeting shortly –  but not so much independent bureaucrats supposedly focused on productivity.

This, from the Commission’s press release, is the gist of what they are about.

flexicurity 1.png

I heard Sweet on the radio this morning playing up the contrast –  beloved of people championing flexicurity-  between “job security” and “income security”, claiming that New Zealand has the former (“a bad thing”) but not the latter.

The mental model that appears to be driving the Productivity Commission in this draft report is one in which we have an excessively rigid labour market, with people (and society) reluctant to face job change, and that this in turn is a big part of the reason why business investment has been low, and productivity growth has fallen far behind.  There is little or evidence adduced to support these claims, let alone the next leap that if only people were given more money more readily when they lost their jobs we’d be well on the way to solving our productivity failings.

Here is the Commission’s summary of the good and the bad, as they see it, of New Zealand’s labour markets (from p21 of their report)

flexicurity 2.png

It isn’t obvious that low labour productivity is particularly a labour market issue, but setting that to one side for now, I wouldn’t disagree with any of those bullet points.  But I’d look at the first group (“the good”) and be inclined then to suggest that this wasn’t the area to be looking if I was trying to do something about (a) economywide productivity growth or (b) adoption of new technologies by firms.  Our labour market looks pretty flexible and responsive. The Commission itself says so.

So why then the push for much higher welfare payments (call them “social insurance” if you like) to people who lose their jobs, less means-testing etc etc?  It can’t be economics –  facilitating ready movements of people from one job to another etc –  so it really has to politics; a view on a different set of income distribution arrangements.  That is stuff elections should be fought over.  But it simply isn’t that credible that the absence of these very general northern European approaches is causally connected to the failures of productivity here  (except perhaps in the reversed causation sense that richer and more productive countries may choose to be more generous).

The Commission is dead keen on us following the example of Denmark, the Netherlands, and Sweden.  These are all highly productive economies (which appear in the grouping of top tier countries –  northern Europe and the US – I often use here in productivity comparisons).  But it isn’t obvious that their labour markets function betters than ours does.  I’ve shown some comparisons re Denmark previously, when Grant Robertson in Opposition was touting the Danish “flexicurity” approach.   In that post, I concluded

I imagine that life on the unemployment benefit is a bit more pleasant in Denmark than in New Zealand, but it isn’t obvious that the Danish structure, as a package, is producing, over time, better outcomes than what we have here.  And their model is vastly more expensive, and more heavily regulated, consistent (of course) with Denmark’s position as the OECD country with the third largest share of government spending as a per cent of GDP (57 per cent).  New Zealand, by contrast, has total government spending of around 41 per cent of GDP

Perhaps more regulation and more spending was Robertson’s point.  I guess we have elections to debate such preferences, but it seems a stretch to believe it would be an approach that would make our labour market function better.  It isn’t obvious Denmark’s does.

But lets update the comparisons and extend them to include the Netherlands and Sweden as well.

First, take a look at the OECD’s indicators around employment protection legislation.  Recall the Commissioner claiming New Zealand has “job security” and suggesting we need to move further away from that.   Well, here are the comparisons.

The OECD indicators on Employment Protection Legislation
Scale from 0 (least restrictions) to 6 (most restrictions), last year available
Protection of permanent workers against individual and collective dismissals Protection of permanent workers against (individual) dismissal Specific requirements for collective dismissal Regulation on temporary forms of employment
Denmark 2013 2.32 2.10 2.88 1.79
Netherlands 2013 2.94 2.84 3.19 1.17
Sweden 2013 2.52 2.52 2.50 1.17
New Zealand 2013 1.01 1.41 0.00 0.92

New Zealand’s legislation around employment protection is more liberal on each measure than any of these flexicurity countries –  quite materially so in most cases.

Or unemployment rates, not just a one year snapshot but a glance back over this century to date.

flexicurity 3.png

Most of the time, most years, New Zealand’s unemployment rate has been lower than that in the median flexicurity country.  The differences aren’t always large, and aren’t even always same-signed, but it isn’t an obvious advert for the alternative model.

And what about employment rates?

flexicurity 4

Sweden has employment rates very similar to those in New Zealand, but taken together this group isn’t necessarily a great advert for an alternative income support model.  Of course, in richer and more productive countries more people can afford to work less etc, so I’m certainly not suggesting the whole difference is down to the presence/absence of flexicurity. Perhaps there is a political “income distribution” case to be made –  that’s one for political parties – but I’m struggling to see reasons why, evidence that, flexicurity offers potential labour market/productivity gains.

And to emphasise that flexicurity in these countries is just one component of a radically different approach to the role/size of government, here is a chart showing government spending.

flexicurity 5.png

The Commission even concedes (page 60) that materially higher income replacement rates when people become unemployed seems to be associated (in a cross-country relationship) with higher rates of (long-term) unemployment.  As they note, it isn’t an ironclad relationship –  there is always a lot of other stuff going on, which needs much more careful analysis to distinguish.   But why they would jeopardise one of the more impressive economic achievements of New Zealand this century (low averages rates of unemployment, especially long-term unemployment) isn’t clear.

Much of it comes down to this alleged “attitudes to technology” issue, even though the Commission makes no attempt at all to show that fears about technology or job displacement is somehow a major factor –  a factor at all for that matter –  in low rates of business investment in New Zealand.

They begin one section late in the report this way

flexicurity 6.png

So even though the Commission itself has concluded (reasonably, or so it appears to me) that “fears of mass job losses from automation [are] unsubstantiated” one public opinion poll is enough to suggest there is some widespread systematic structural problem.

One might well wonder whether (a) it was not ever thus (except perhaps in the hyper full-employment period of the 1950s and 60s, and (b) whether those fears are not being fed by people like the Minister of Finance.  Without evidence that any such fears are (a) much greater than usual, (b) causally connected to weak business investment in technology, and (perhaps) (c) evidence that such fears are lower in the flexicurity countries, it isn’t a great basis for proposing far-reaching policy change.

Following on from that extract we get this

Bredgaard and Daemmrich (2012, p. 2) described the Danish “flexicurity” system (Box 3.2) as a strategy for “economic competitiveness and sustainable national prosperity”.
Firms in Denmark gain competitive advantages from a mobile labour force and government funding of public services and infrastructure, while workers benefit from domestic employment opportunities and continuing training.

Well, perhaps, but I”m sure one can find champions for any country’s appraoch, but where is the systematic cross-country evidence, including relative to New Zealand (a country with lower average unemployment rates, lower long-term unemployment, higher employment).

And then there is this

flexicurity 7

But, as already noted, New Zealand not only has fewer job security protections than France –  the bad example cited here –  but fewer than those in Denmark, Netherlands, and Sweden.    And one might remind the Commission that correlation is not causation, especially when it isn’t supported by any independent argumentation to make the case that (a) flexicurity produces these poll results, and (b) more importantly, flexicurity increases the rate of uptake of new technologies across economies as a whole.   The Commission offers nothing on either point.

One could go on. The Commission notes that one “could” introduce “portable redundancy accounts” as, apparently they do in Austria. But makes no real case for doing so, and never seems to engage with (for example) the tax inefficiency (to the individual) of having various pots of money tied up in various places, all while (typically) having a mortage on the other side of the balance sheet.  They toy with ideas of mandatory redundancy, but again without any attempt to demonstrate a connection to productivity or business investment.  They worry about the ability of people who lose their jobs to service a mortgage, but never seem to adequately connect that concern to the fact that if there is a system that generates little long-term unemployment, most people are usually relatively readily able to find new jobs, and can self-insure (both formally, through mortgage protection insurance, and informally –  it isn’t common for both members of a couple to lose their jobs at once).  Mortgages in New Zealand are, of course, highly burdensome, but that is a reason to fix land supply and get the price of houses down, not to greatly enhance the welfare system.

Changing tack, I was also interested that the Commission did not touch on three other dimensions that might seem relevant to discussions around the sorts of schemes they propose:

  •  the fiscal automatic stabilisers in New Zealand tend to be quite muted.  That reflects the twin facts that our tax system isn’t highly progressive and that our unemployment benefit system is modest and pays a flat rate.     What the Commission proposes would strengthen the automatic stabilisers, but at the price of increasing the cyclical amplitude of cycles in the government’s budget balance.  There are pros and cons to such a change, but they didn’t seem to be mentioned at all,
  • the Commission rather overdoes the point about social insurance and how different New Zealand and Australia are to the rest of the world, but there is one important dimension they didn’t touch on.  In other countries, the social security systems are typically partly funded by social security taxes on wages.  That means tax rates on wages are typically higher than those on capital income.    This is a relatively attractive feature, given that business investment (especially foreign investment) tends to be quite sensitive to expected after-tax returns (and people like Andrew Coleman and me have been making this point for years).    Even if we did not increase welfare payments to the unemployed there would be a good case to lower income tax rates and raise the lost revenue through a social security tax on labour incomes.  This wasn’t a dimension the Commission touched on and while, considered politically, that might not be surprising, it is quite a gap analytically.

In sum, there is no sign that the current Productivity Commissioners have any sort of robust defensible model for thinking about New Zealand’s long-running productivity failures. In particular, they show no sign of having thought hard about why firms operating here –  and who might operate here –  have proved so reluctant to invest more heavily over long periods of time.   There is no evidence offered that excessive rigidity in the labour market, or fears of workers, is any part of the issue at all.

And yet they jump to champion quite radical changes in our welfare system, even including near the end of the report a folksy politicised cartoon

flexicurity 8.png

The economic case just is not made.  Sure, it would be great to have a highly productive economy, but the Commission simply has not made a serious effort to demonstrate any sort of causal connection between their (apparent) personal political preferences around unemployment benefits/social insurance and any sort of plausible path to much better productivity outcomes in New Zealand.   (And here one might note that places like France and Belgium –  with quite restrictive labour laws, much more so than the flexicurity countries –  have similarly high average rates of labour productivity.)

If they want to champion such a model –  and reasonable people can debate the merits of some aspects of it in its own right – there is an election next year. Perhaps the Commissioners might consider standing for Parliament instead of using taxpayer resources to champion a different answer to inherently political questions.


Compass gone wonky

Having delivered his Monetary Policy Statement, done his press conference, fronted up to the Finance and Expenditure Committee –  oh, and roiled the markets –  Reserve Bank Governor appears to have jumped on a plane for a quieter couple of days at conference in San Francisco.  I don’t begrudge him that –  the conference in question is usually pretty good (I got to go once) and this year’s programme looked as interesting as ever.  The topic was “Monetary Policy Under Global Uncertainty”.

The Governor was on a “Policymaker’s Panel” –  along with a Deputy Governor from Korea and a former Deputy Governor from Brazil.    It can’t have been a very in-depth panel (the programme allowed only 50 minutes in total), but we don’t hear much systematic from the Governor on monetary policy and so it was welcome that he chose to release his short (four pages or so of text) remarks.  I don’t think I’ve seen them covered in the local media at all.    That is perhaps a little surprising as, having greatly surprised commentators and markets in two MPSs in succession, his remarks to this FRBSF panel were under the heading Monetary Policy: A Compass Point in Uncertain Times.   Sounds like a worthy aspiration.  Shame about the execution.

But what did Orr have to say in his brief remarks?

First, he attempts to suggest that policy (etc) uncertainty isn’t really much of an issue in New Zealand.  Yes, he really does claim that, drawing on a measure – of the dispersion of GDP forecasts –  which isn’t an indicator of policy uncertainty at all.    Now, no one is going to claim that we have anything like the degree of policy uncertainty they face in the UK (or, thus, its major trading partners including Ireland). We don’t even have a “trade war”.   Then again, we had months of uncertainty around capital gains taxes, ongoing uncertainty about the future labour market regulatory regime, and now about the future water pollution regime. Oh, and bank capital requirements…..to name just a few.

Then we come to paragraph that I agree with, quite strongly, and yet it seems he no longer does.   In the light of the uncertainty (globally) he tells us

it is vital that monetary policy acts as a compass point for decision making

going on to note

For New Zealand, this means setting policy to achieve our price stability target and support maximum sustainable employment. It means acting decisively to prevent an unnecessary worsening in economic conditions and the un-anchoring of long-term inflation expectations. And it means recognising the limits of monetary policy.

I’m not going to disagree, but quite how he justifies his MPC’s decisions, and communications, in and around both the August and November MPSs is less clear.  As I noted the other day, in August –  when they did act “decisively” there was little attempt to invoke arguments about inflation expectations in support, then we had a couple of months of wheeling out such arguments, only for them largely to be abandoned last week when he chose to err on the side of caution, “unnecessarily” so, at least in my view, against a backdrop of inflation and inflation expectations below targets with (in their own words) downside risks.   Not much of guiding light there.

Then we get the sort of paragraph beloved of self-important central bankers

In discussing these topics, I will touch on how, since the Great Financial Crisis, central banks have been tasked with a widened set of objectives. On one hand, we appreciate the constraints faced by other institutes, and the peril that may have resulted from the crisis had central banks not stepped up to the task. On the other hand, central banks are sometimes expected to solve phenomena that are structural in nature, and that do not sit easily within the conventional realm of monetary policy. At the Reserve Bank, we are always exploring new policy options to meet our broadened mandate.

Except that, typically, central banks don’t have a wider mandate how than they did before.  That is certainly true of New Zealand –  where nothing at all (in legislation) has changed around regulation/supervision, and where the change to the formal goal of monetary policy was, in the Bank’s own telling, more cosmetic than substantive, designed to capture something about the way the Bank had long sought to operate, while altering some rhetoric.  The big change in New Zealand has been central bankers looking to extend their own reach, both within and beyond the mandate Parliament has given them –  whether LVR limits (arguably within the letter of the law), focus on “culture and conduct” (clearly not),  the Maori strategy (not), the green agenda (largely not) and so on.    Perhaps in a few corners of the world there has been a belief, by a few people, that central banks can markedly change structural growth outcomes.   If so, such a mantra has rarely, if ever, been heard here in the last decade. But it makes central bankers feel important and valued to pretend otherwise.

Keeping on through the speech, we do actually get some recognition that “policy uncertainty” –  and “regulatory requirements” –  were acting as a barrier to business investment in New Zealand.  As he notes, most of this doesn’t have much to do with monetary policy, except that monetary policy needs to take account of whatever is influncing overall demand and supply pressures/balances.

From a central bank perspective, uncertainty has one clear impact: it makes our job harder. Good monetary policy depends on reasonable forecasts. High uncertainty makes forecasting harder. There is more noise in the data and forecasts are more subject to revision. A consequence of this is that the Official Cash Rate (OCR) may be less predictable simply because the world in which we are making our decisions is less predictable.

Except that earlier he showed that chart (mentioned above) in which the dispersion of GDP forecasts has been quite a bit lower than usual in the last couple of years.  So it might be a fair point in principle, but in practice –  in recent months –  the real source of short-term uncertainty about the OCR has been……the Reserve Bank itself.    Not a point that Governor chose to address.

He then moves on to a section headed “Monetary policy response to uncertainty”.

First up is a straw man

Firstly, maintaining low and stable inflation enables organisations and individuals to carry out meaningful financial planning, by reducing overall uncertainty. This is something that is nearly impossible when prices are high and volatile or falling uncontrollably.

Neither is a world any advanced country has been dealing with in recent decades (I’m assuming he meant “inflation” was high and volatile), and in the case of “falling uncontrollably” never.

Then we do get to recent New Zealand policy

In particular, it is now more suitable for us to take a risk-management approach. In short, this means we look to minimise our regrets. We would rather act quickly and decisively, with a risk that we are too effective, than do too little, too late, and see conditions worsen. This approach was visible in our August OCR decision when we cut the rate by 50 basis points. It was clear that providing more stimulus sooner held little risk of overshooting our objectives—whereas holding the OCR flat ran the risk of needing to provide significantly more stimulus later.

And yet, wasn’t that title something about a reliable “compasss point”.   None of his August approach was flagged in advance, arguments for it unfolded only slowly even after the event, and then –  when there was still (on his own numbers) “little risk of overshooting our objectives” they abandoned that particular “least regrets” line, without explanation in advance, in the release, or subsequently.  He goes on

We can also address uncertainty through our communication and forward guidance, which are broad-ranging. We reveal our assessment of the economy—good or bad—to the public, so they can make decisions based on the best possible information amid the prevailing uncertainty. We voice the types of policies we believe may be needed to sustain long and prosperous growth—be they monetary, fiscal, or financial policies.

But that is almost exactly the opposite of what the Governor and MPC are doing.  We have still not had a single substantive speech from the Governor on monetary policy and the economy.  We haven’t at all from three of the statutory members of the MPC.  It is harder to make good decisions when central banks spring –  quite unnessary – surprises.  Oh, and actually it is no part of the Bank’s mandate to be opining on what policies are best for “long and prosperous growth” (although it is remarkable that structural policies appear not to be relevant to the Governor’s view of growth, productivity etc).

There is a final page on “Beyond conventional monetary policy” which I don’t have particular problem with.  It is good that the Governor again repeats his intention to publish their analysis. It is only a shame that (a) this process has been so long delayed, including under his predecessor, and (b) that the work done so far has not proceeded in a more open and consultative way, rather than being something akin to the “wisdom” delivered to the masses from the wise experts on the mountain top.

Orr ends in a typically upbeat tone.   I just want to highlight the last few sentences in which (as so often) he overreaches, partly in the process of distracting attentions from the failings in areas he is directly responsible for.

Yes, there is uncertainty. Yes, it is affecting us. No, monetary policy cannot directly resolve this issue. But we can offset its effects and empower others to fuel economic activity that will benefit us in both the short and long-term. There has never been a greater time to make use of accommodative monetary policy for investing in productive assets.

Yes, monetary policy has a (vitally) important stabilisation role.  It was why countries set up discretionary monetary policy many decades ago.   But it can do nothing to offset the blow to potential output created by policy uncertainty and other regulatory burdens.  It does nothing to boost our longer-term prosperity.  And as for the final sentence…….he falls into the trap again of trying to convince us that low interest rates are some exogenous gift, empowering whole new opportunities, when in fact interest rates –  long-term market-set ones and official OCRs –  are low for reasons that seem to have to do with diminished opportunities, diminished prospects for profitable investments.  Don’t get me wrong – given all that, the OCR should be lower (mimicking what real market forces would be doing if short-term interest rates were a market phenomenon), but when interest rates are falling in response to deteriorating fundamentals it is a stretch –  at very least –  to expect the sort of pick-up in business investment the Bank often forecasts but rarely gets to see.

It wasn’t a persuasive or particularly insightful set of comments.  Perhaps his San Francisco audience –  knowing little of New Zealand –  weren’t bothered, but we should be.  We should expect a lot more from such a powerful, not very accountable, public figure.

(And if you want a speech from a much more serious figure, try this one –  given at the same conference –  by Stephen Poloz, Governor of the Bank of Canada.  There is a depth and seriousness to it that is simply now not seen from senior figures in our own economic policy agencies.)

Facts

The New Zealand Initiative last night released the results of the general knowledge quiz conducted for them by a polling company.     It is a good way to get media coverage –  and I’m as much a data junkie as anyone.

The real point of the exercise was as a prop in making the case for a greater emphasis on a knowledge-based education system rather than the current skills-based focus.  I’ve told the story before about going to a meeting for parents of new entrants at the local school a decade or so ago, where the Principal –  a fairly vocal figure in the world of educational politics –  told us that they weren’t going to teach our children facts, because they would soon be outdated.  Fortunately, when I tried the NZI quiz on my now 16 year old he got 12/13, despite the New Zealand education system.

The headline, of course, was that this sample of New Zealand resident adults wasn’t particularly good at answering the NZI’s questions, many of which look pretty simple or basic (at least to the sort of people who read either NZI material or blogs like this).  Across 13 questions –  of which five were either yes/no or limited multi-choice questions –  the median proportion of respondents answering correctly was 53 per cent (that was the question about how long it took earth to orbit the sun).   And although much of this post will be a sceptical take on the significance of the survey, even I will concede to being surprised that only 32 per cent of respondents could correctly name the year the Treaty of Waitangi was first signed.  I doubt the Treaty was ever mentioned in my whole schooling, but it is (repeatedly) today, and yet the worst results were for the 18-30 age group (where only 23 per cent got the answer right).

The NZI released the detailed breakdown of the responses: we have all the answers by age, sex, metro/provincial/rural, by “deprivation decile”, and by whether schooling had taken place in New Zealand or abroad.  Curiously, there was no ethnic breakdown.

One thing I haven’t seen covered elsewhere – or, of course, in the NZI write-up – is the systematic male/female differences.   For quite a few questions there is almost no difference between male and female responses, but for seven of the questions the differences looked to be material and in only one of them did women outperform men.

Per cent correct
Female Male
How long does it take for earth to go round sun 44 62
What year was the Treaty first signed 29 35
Native Land Court purpose 32 36
Correct use of “their/there” 83 77
Derive distance travelled from speed and time 41 56
Name seven continents 39 50
Compound interest question 1 49 66
(Harder) compound interest question 23 46

I’m not sure what to make of those differences, but since I work on the assumption that women are just as intelligent as men, perhaps it suggests something about how the questions are framed, or…..? (Note that the NZI person responsible for this project is a woman.)

There were some differences between those schooled here and those schooled abroad.  Knowledge of when the Treaty was signed and about the Native Land Court was less good among those schooled abroad, while the migrants were more likely to be able to name all seven continents and to be able to answer correctly the harder compound interest question.

People from poorer areas typically knew (or could work out) fewer correct answers, but by age the answers were a bit mixed. The only one surprised me was (see above) the Treaty response where the older people were the more likely they were to know the correct answer.    Of the other questions, there were quite a few where younger people now knew more the older people now but where you would have to wonder whether those same young people will know as much 50 years hence.  There are plenty of details I learned at school that I’ve either forgotten or are now rather hazy –  while other, mostly unused, things stay locked in the brain and are never asked about in surveys or quizzes (here I’m thinking of the quadratic formula as an example).

In general, I am sympathetic to the Initiative’s cause, for a greater and more systematic emphasis on knowledge in our schools.  But I am left quite sceptical about the value of surveys like this, except as a way of getting media coverage, and perhaps feeding the self-esteem of a certain class of well-educated and knowledgeable adults.  Most people actually do manage to get through life tolerably well and the world is richer and more materially prosperous than ever (as the Initiative would often rightly point out, in pushing back against other nanny-state proposals) and I’m left wondering why, if at all, I should be bothered if people can’t answer particularly well over the phone –  perhaps caught while they are cooking dinner or doing the ironing – compound interest questions (green are the correct answers).

nzi quiz.png

Most people don’t leave a fixed amount in an account for five years and reinvest all the proceeds, there are fees and taxes, interest rates change over time, and actually if you invest for five years at 2 per cent interest per annum and spend none of it and pay not fees/taxes, you’ll end up with with $110.41 which most people would round to $110.

But this isn’t enough for the Initiative

Our poor grasp of maths is also concerning. Basic arithmetic is critical for personal financial literacy. It is difficult to understand mortgages, savings and investments without the mathematical keys. But knowledge of maths goes beyond finance to everyday life. Try renovating your house, baking a cake or calculating medicine doses without basic maths. It is true that the 20th century provided us with calculators, but if you do not understand maths you are poorly placed to check your electronic answer.

And yet people do get on.  We don’t have some mortgage default crisis, we have pretty low rates of elderly poverty, nothing about finance (at a personal or national level) seems to be spinning out of control.  And while the main thing for which I now use the formula for the area of a circle is to adjust recipes to the desired size of cake tin, somehow I expect most homemakers get on just fine without it.  (I raised some doubts about the value of “financial literacy” programmes in a post here.)

And is it particularly useful to know the antibiotics are about bacteria not viruses?  I did know that, but it isn’t particularly useful to me.  Instead, when I go to the doctor I typically take his advice, and when he prescribes something I try to follow the prescribed instructions.  It probably matters rather more –  in term of keeping antibiotics useful – that (a) doctors don’t over-prescribe and (b) patients follow instructions.  Or so I’ve been told, and I’ll operate of those rules of thumbs (especially the latter) for now.

Which brings me to the paper Briar Lipson has written using the quiz results as a prop for calls for reform of the education system.    It is a curious piece in many ways, perhaps especially coming from a think-tank which is generally regarded as fairly libertarian in its inclinations.   Their chief economist Eric Crampton often cites approvingly the stimulating work of GMU economist Bryan Caplan, one of whose books was devoted to casting considerably doubt on the value of much of education (facts-based or not) in building skills –  as distinct from certifying a work ethic, conformity, and basic intelligence.  A screening and sorting mechanism more than anything (as I’m sure knowledgeable parents recognise when they hold conversations with smart teenagers and have to distinguish between richer and deeper answers and those that will jump through the right hoops to secure NCEA credits).

I was a little amused to note her claim that

As a bicultural nation with a colonial past whose ongoing legacy is playing out in our troubling national statistics, it will never be easy to answer these questions.

It could have been written by the Maori Party, but it was actually written by someone who isn’t a New Zealander and who appears to have been in the country for not much more than two years.  It doesn’t invalidate her expertise on education itself, but that ‘our’ is surely just a bit of a stretch?

There is a quite of this black armband approach.  For example, we are told that “inequality…threatens wellbeing and prosperity”, which is a rather different (questionable) tone than we typically get from the Initiative.   I presume the audience for this is the Labour Party, but even so……facts, knowledge etc.  It carries over to the caricature of history.

For most of history, only the wealthiest had the time and resources to pursue disciplinary knowledge. For the rest of society, knowledge beyond daily experience was an unaffordable luxury. Accordingly, the ability to read and write was limited to the elite: noblemen (yes, only men) and clergymen (again, men). If you toiled for a living, your horizons were narrow.

Yes, poverty was quite limiting, but all that “only men” stuff would surely have come as quite a surprise to Hildegard of Bingen, Catherine of Siena, Anna Comnena, Teresa of Avila as just four fairly prominent examples.   Lipson’s treatment of history here is the sort of thing that makes people like me –  who fairly strong support, in principle, the idea of more systematic history in our schools –  rather nervous of what it will turn into in practice.

There is more dodgy –  or at least highly arguable – history: thus on her telling it is the Enlightenment that brought us literacy. Pretty sure it had almost nothing to do with the first New Zealand schools.

I totally agree with Lipson here

Whether you are building a house, playing the violin or deciding to immunise your child, knowledge is essential, because there is not a generic skill of problem-solving or critical thinking. As anyone who has lifted the bonnet of a broken-down car knows, problem-solving skills do not exist in the abstract.

And yet she starts her note with the observation that

For most of history, only the wealthiest in society had the time and resources to pursue disciplinary knowledge. For everyone else, knowledge beyond daily experience was an unaffordable luxury.

And yet I don’t need to know how the engine in my car works.  Most knowledge most people actually use day to day is really rather specific.

A few other questionable snippets

To converse meaningfully with each other, and evaluate the performance of our political leaders, we need to have knowledge that takes us beyond our daily lives.

Set aside the evaluation of political leaders, but does Lipson really suppose that the vast mass of people –  who couldn’t answer her quiz questions correctly –  somehow don’t manage meaningful interactions and conversations?  The revealed evidence seems to be against her on this count.  It won’t be Wellington elite dinner table conversations, but are the relations and interactions –  the thick web of connections that makes up most individuals’ place in society – any less effective or profound?

We get another of those “Wellington elite” type of perspectives in this comment

To grow into active, engaged citizens who can think critically about the wider world, children need to know about language, science, maths and culture (including but not only their own). However, only 44% of New Zealand adults can name the seven continents, let alone locate Afghanistan or South Korea on a map – countries where our defence force has personnel in the field. Issues like national defence, along with migration and trade, are all critical to New Zealand’s role in the world. But how can we expect voting-age adults to engage with New Zealand’s geopolitical challenges – and how our nation should respond to them – if they do not even know where in the world the challenges lie?

I’m simply not bothered if people can’t find Afghanistan on a map. One could mount a –  slightly flippant perhaps – argument that it would be better if fewer people could, because it would probably have meant fewer western armies and associated headlines there, and from there, over the last 18 years.  More importantly, it is delusional to suppose that a school education –  no matter how good –  is going to equip people for debates about the nature, and source, of geopolitical challenge or (to take another topic close to this blog’s heart) the pros and cons of a large scale immigration programme to a remote corner of the earth.

Lipson goes on

We might debate whether these skills are any more important this century than they were in the past; either way, we must agree it would be difficult to think critically about the Hong Kong riots without knowing something about Hong Kong’s history and geography. It would be equally difficult to evaluate policies on use of plastic without a basic knowledge of biochemistry and economics.

I think I am safe in saying that, for better or worse, most New Zealanders have little interest in the Hong Kong riots and although, in some sense, I personally might wish it were otherwise, it isn’t really clear why that is a bad thing.   (As it is our government tries to pretend to having little interest).  And –  while perhaps I’m missing something crucial –  I’m not clear quite what Hong Kong’s geography (does she mean a tight city-state, or located next to China?) really has to do with it.  Personally, when I think about Hong Kong I worry most about the fate –  persecution and repression –  that awaits my fellow Christians under mainland rule, but I wouldn’t really expect that concern to be universal.

(As for plastics, personally I found the values of choices, self-responsibility, and ensuring I  – and my kids –  don’t litter, more relevant to my views on plastics policy than my knowledge of biochemistry –  next to none –  or economics.)

You can read Lipson’s piece for yourself (and it is an important issue). I guess my bottom-line concern is that she has grossly over-reached.    Across her scattergun range of examples, she encompasses a range of topics/knowledge that few (if any) are likely to master, or have much interest in doing so –  even building on decades of adult acquisition of knowledge, not 11 or 12 years of schooling.    I’m all for getting a better balance between on the one hand concrete fact-based knowledge and sketch narratives of things like our history and that of societies to which we are heirs (the narratives, if pushed, matter more than the dates) and on the other the research, reasoning and problem solving skills the current New Zealand system tends to emphasise.

But the modern world relies on a considerable degree of specialisation –  indeed it is integral to our prosperity –  and that is as true of public life, political and social choices, as anywhere else.  I’m not promoting, let alone defending, any sort of “rule of experts” (and I’m pleased to see that here the Initiative is not heading off after things like epistocracy) but hardly anyone votes based on a comprehensive review of in-depth party policies across the board.  Even on a specific issue like climate change, few of us (really can) vote that way – I might claim some expertise in the economics, but not in the science, and there are very few people who combine both.  And values count a great deal, and yet nothing in the NZI quiz –  and almost nothing in Lipson’s note –  was about forming people in the values that make for a successful, stable, and prosperous society.

In truth, we take our lead from others –  rules, precedents, examples, people who enunciate values that relate to our own –  and leave much of the detail to others.  It is unavoidably so –  and I say this as someone who has more time, and probably more capacity, to dig into lots of issues at a fairly technical level.  We rely on others in almost all areas of life, and one could at least mount an argument that learning how to think about who and what one might trust is much more important than, say, learning the details of the Danzig question, Hong Kong’s geography, the biochemistry of plastics, or the precise reason for the establishment of the Native Land Court.   As Lipson puts it in her title, ignorance is not (generally) bliss and yet –  on the other hand – a little learning can, in Alexander Pope’s words, be a dangerous thing.

I could go on, but won’t.    But I’ll end where Lipson starts. In the entire body of her seven page text there is nothing about forming people in the values that a society should live by.  I suspect she is probably an adherent of some fact/value distinction (Winston Churchill was a real person, regardless of you views of the nature of good), and clearly there is something to that split, and yet if her goal is a functioning cohesive effective society and polity values formation is likely to be at least as important as specific factual knowledge.  It isn’t enough to say that home is the place for that, since we all know that nature abhors a vacuum and that what our schools teach is heavily value-laden, by default if not always by design.  Lipson begins with a quote, which appears to be from an Australian teacher

It is not the natural state of humans to live in relatively free, democratic societies that tolerate difference. Because of this, we need education to protect and preserve these societies; to transmit important cultural knowledge from one generation to the next, and value our civilisation.

I’m not sure those two sentences really relate to each other, but if you take seriously the second sentence –  as I do –  you’d find it bearing almost no relation to either the facts quiz that got NZI its media coverage, or to the thrust of Lipson’s appeal to teach facts.  It is about a cohesive narrative that recognises what is good and what is not, what is great (eg art, music, literature, ideas) and what is not, and takes pride in what has been built.  And that requires an ethos, a mindset, that has made sense of life and the world.   You might call it a worldview or a religion.   But it is very different from knowing the names and dates of the kings and queens, the names and dates of all our Prime Ministers (useful as, in some sense, those latter might be).    The (narrow) facts just don’t get you far.  I’d rather people “knew” that Communism has been, and is, a great evil than that, say, they knew the geography of Hong Kong or the biochemistry of plastic


People from poorer countries will come if we let them

The Herald business columnist Liam Dann had a curious column out yesterday.  When I first saw it online it had a more right-on headline [UPDATE: “Woke wonderland – how a new narrative has changed NZ”] (I didn’t read the article until my wife started quoting bits to me) but it now has the headline “NZ’s population prediction was out by 30 years – the price we are paying”.

Dann had been prompted to write the article by stumbling on a 2004 SNZ release from 2004 which apparently “forecast” (more likely, it was the medium “projection”) New Zealand’s population to get to five million in about 2050.  As it is, it appears that milestone will be reached within the next few months.

The bit that the current headline deals refers to was this

Now I can’t get past the notion that this miscalculation holds the key to many of our social infrastructure problems in 2019.

If that was the population assumption policy makers were using, then of course we have a housing shortage … of course our roads, our hospitals and our schools are crowded.

I’m a bit ambivalent on that point.  After all, it isn’t as if the projections haven’t been updated, regularly, since 2004.    And one could quite reasonably make the point that this specific issue isn’t primarily about surprisingly rapid population growth, as about successive waves of central and local governments (including the current ones) that have made too much of the system not responsive to population surprises.  Planners control where houses can (mostly can’t) be built and most of them have a deeply-held aversion to an increased physical footprint for cities, let alone competitive market processes to determine where and when development occurs.   We still don’t have congestion charging in our major cities.  And so on.  And so the pressures fall on house/land prices and in various forms of congestion or queuing.

All that said, if we were to take as more-or-less given the RMA and associated development constraints then Dann does have a point.  After all, it was the same political leaders who have repeatedly refused to act to free-up land supply etc (and in doing so were, just possibly, reflecting public preferences) who also oversaw the immigration system which has resulted in such a rapid rate of population growth.  The immigration system is much easier to tweak, to manage trend inflows of non-New Zealand citizens, than the entrenched land use issues are to fix.   In that sense blame a series of active (and, more often, passive) choices by our political leaders.

Using official SNZ data, here is how our population has changed since September 2004 (September years are the latest annual data).

population since 04

Over the full period, the population has risen by (an estimated) 842000.   Take natural increase (births less deaths) and the large net outflow of New Zealand citizens (another 315000) and you’d have been left with a pretty small rise in the population  (less than 4 per cent in total, over 15 years).

That is simply an illustrative scenario.  In the absence of large non-citizen immigration, the rate of natural increase would have been lower (immigrants, once here, have children too).  Whether the outflow of New Zealanders would have been any different is hard to know.  My own view is that there would have been a slightly smaller outflow of New Zealanders (consistent with my model, in which economic prospects here would have been improved), but there are alternative hypotheses in which some more New Zealanders might have left (wanting the brighter lights a NZ of five million could offer, but one of four million could not).

But to a first approximation, if you regard the land regulation situation as largely frozen, then almost all the subsequent pressures can be ascribed to the choice to keep on with large scale non-citizen migration regardless.  Even if you thought it really could be quite readily changed and it was just venal politicians who refused to do the right thing, then knowing that and still supporting large scale immigration (and recall that ours is among the very largest in the world per capita) is akin to knowingly inflicting the resulting house prices, congestion, queues etc on New Zealand.   It isn’t as if other countries have been so good at fixing those land (related issues).   And officials and outside observers knew these issues were a problem 15 years ago.

Of course, having raising the issue Liam Dann –  pillar of the establishment –  is keen to assure his readers that he does not, not for a minute, oppose immigration.  Thus his claim

in my lifetime this country has been vastly improved by more people and more cultural diversity.

I get the impression he must be almost 50 so presumably he is talking about immigration since about 1970.   In reality though, between about 1974 and the end iof the 1980s there wasn’t much immigration, so we are mostly talking about the last 30 years.    I can’t share his optimism, particularly about the raw numbers, in a country that has continued to drift further behind economically over that period, and whose firms have failed –  in aggregate –  to find new products/markets abroad (even though external trade is a key element in any prospective improvement in our relative prosperity).

Anyway, at this point Dann launches into a paean to the better New Zealand we now are that, to me anyway, seems more than a little detached from reality.  We are told that

Something structural has changed.

New Zealand just isn’t a place people want to leave any more.

Except of course (see above) a net 300000+ people have: just imagine if a net 7.5 per cent of the American population had left the US in 15 years.

Now a little later on, Dann does concede that any reduction in net outflows isn’t entirely good news

Australia becoming a lot less friendly to New Zealanders has influenced our net migration rates. It’s not nearly as easy to enjoy the easy life across the Tasman as “Bondi bludgers”.

In other words, poeople may still want to leave, but it is harder to do so.  And it isn’t just about the caricatured “Bondi bludger” but about the difficulty of your kids getting established and ever getting citizenship etc.  New Zealanders are worse off as a result of those tougher Australian policies.

It is also worth pointing out that New Zealanders go to Australia when the Australian labour market is strong.  It hasn’t been that strong in the last few years, after commodity prices peak and the mining investment boom began to pass.  That isn’t good for Australians, and it certainly isn’t good for New Zealanders who might want to take advantage of the higher productivity and higher material living standards abroad.

And, as it happens, the outflow has been picking up again.  Here is the net outflow of New Zealand citizens from the new SNZ migration data.

outlfow to AUs

It certainly isn’t a record outflow, but the increase is now becoming quite pronounced.  Not exactly a tale consistent with a wonderful New Zealand.

But when he talks about the migration choices of New Zealand citizens, Dann is just warming up.    The real story on his telling is

New Zealand finds itself being cast as the “woke” capital of the world.

and

We failed to see what a desirable place New Zealand has become in the eyes of the world.

Complete with all manner of gushy references to the idea that, for example

the UK and US media simply can’t get enough of the notion that this country is a liberal paradise.

Now I’m not going to deny that there are sections of the world media who seem particularly enamoured (for reasons that largely escape me) with our Prime Minister.

But….the surge in net migration this decade mostly happened on the watch of the previous lot, that outflow of New Zealanders has (and it is almost entirely coincidental) increased in the couple of years the current government has been in office, and in case Dann hasn’t noticed, the residence approvals targets haven’t changed much in 20 years now, and actual approvals have been undershooting target in the last couple of years (probably less because of lack of interest than because of processing delays by MBIE).   Because the headline target hasn’t changed much in 20 years, while the population has grown quite a bit, residence approvals for non-citizens are quite a bit less now, in per capita terms, than they were in, say, 2004 (Dann’s reference point).

And why might we doubt that Stephen Colbert (or, on the other side, Donald Trump) or the Guardian really have anything much to do with our population growth?  Well, try this chart from the new MBIE immigration dashboard, showing the top five countries for residence approvals.

R1 Residence Decisions by Nationality (1)

Four of these five countries are materially poorer than New Zealand is (and the UK, once the leading individual source country, while richer and more productive is now down to equal 4th).  Mostly people migrate when (a) the options are better for them abroad, and (b) the potential recipient country allows them to do so.  That seems pretty consistent with the New Zealand story not just now, but throughout history (think of the UK migration from say 1870 to 1970, a period when wages here were typically higher than those in UK, or of Pacific migration in the 60s and 70s).

And if there has been an increase in the (typically small) net number of US migrants since Trump, well there has been a fall in the net inflow of Brits since the Brexit vote.

trump migration.png

In combination, net arrivals from the UK and US are now about one-third of what we were experiencing from 2004 to 2007.   So much for the pulling power of the “woke paradise” rhetoric.

As just another area where our rules matter quite a lot, the MIBE data says that we now have about 200000 people here at any one time on temporary work visas.    In 2012 that number was about 100000.   That’s non-trivial share of the roughly 500000 growth in population (all needing accommodation etc) in that period.

Towards the end of his article, Dann’s sunlit uplands narrative continues

Now more than ever New Zealand has some control over that destiny.

We can choose to turn the immigration tap up or down with policy settings.

We have choices because we can rest assured that the demand is there.

Except that for most of the last 150 years it has been so.  When you are a relatively rich country –  and one that is not given to coups or civil wars and speaks the global language  – of course people will want to come.  In what we often think of as the dark years of the late 70s and early 80s plenty of people would happily have come, it was just that we chose not to let them (and reasonable people can debate that economic or social merits of that choice).    We could elect the antithesis of Jacinda Ardern and while Colbert, the Guardian and the Washington Post might not like it, it wouldn’t materially alter the broad level of interest in moving from a much poorer country (eg India, South Africa, Philippines) to quite a rich (if remote) one.

I remain convinced that we would be better off economically, and probably politically/socially as well, to be targeting a much lower rate of non-citizen immigration (perhaps 10000 to 15000 residence approvals per annum).  If we did, the population would probably level out near five million.   Without compelling evidence of incipient rapid productivity growth –  of the sort missing for at  least 70 years –  that would play better to the limited economic opportunities in this remote corner of the world.  And, as it happens, it would leave us not far below the size of the median country globally.

As it is, the existing planning ranges for residence approvals expire at the end of this year.  As I highlighted earlier in the year, the government is apparently looking at quite an overhaul of the system (although no hint they were looking at lower numbers).  The number of Cabinet meetings before the end of the year must now be dropping away quite fast.