The annual national accounts data were released last week. For at least some of the variables – nominal ones – these data offer the longest official national accounts time series we have in New Zealand, in many cases going back to (the year to March) 1972. By contrast, the quarterly national accounts data go back only to the late 1980s. One day, when SNZ and official statistics are properly funded, it would be a worthwhile project to take consistent historical series back several more decades. Doing so would help us make better sense of our economic history.
I was playing around with various series, and nominal ratios, from the national accounts data. This post presents a few of the resulting charts, on investment as a share of GDP and also on the capital stock relative to GDP.
First, investment.
There has been a fair amount of residential building activity going on this decade. Almost certainly not enough (and nothing like the volume of new building relative to population growth that we had in the early 1970s for example) – although the bigger issue is probably land, and the affordability of housing. But what about some other components?
When it was campaigning in 2017, Labour talked a lot about government underinvestment in all sorts of things. As recently as last week, the Prime Minister was talking up government “investment” in all sorts of things. But here is national accounts investment (GFCF) by general government (central and local) as a share of GDP.

The latest data are only for the year to March 2019, and I guess it takes a while for new governments to get things going. But, so far, we aren’t seeing much sign of movement (and do notice how much smaller government investment spending is relative even to the early-mid 70s when population was also growing very rapidly).
What about business investment? SNZ don’t release a series for this – but they could, and it is frustrating that they don’t – so this chart uses a series derived by subtracting from total investment general government and residential investment spending. It is a proxy, but a pretty common one.
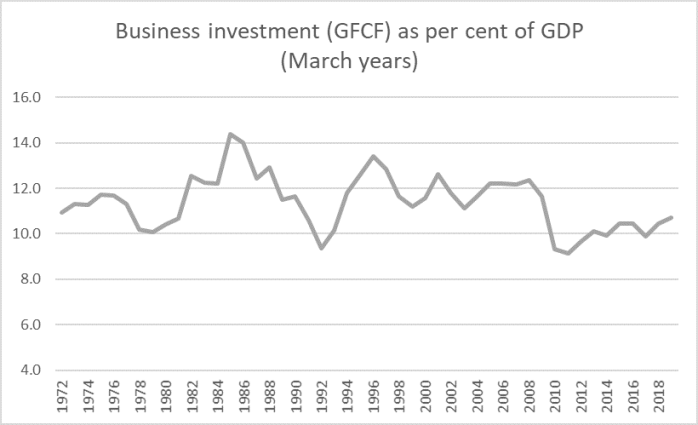
Business investment as a share of GDP has been edging up, but it is still miles below the average for, say, 1993 to 2008, a period when, for example, population growth averaged quite a lot lower than it is now. All else equal, more rapid population growth should tend to be associated with higher rates of business investment (more people need more machines, offices, computers, or whatever). The Governor often tries to talk up business investment, as if the only relevant factor was the interest rates, without ever apparently taking time to think about why business investment here is so subdued.
Within the aggregate numbers, there are the odd glimmers that might encourage some. The government is very keen on encouraging more R&D, and has recently brought in new subsidies to try to encourage firms to do more (again, without stopping to think hard about why more R&D investment wasn’t attractive to private profit-maximising firms). Here is (the total) research and development component of GFCF, expressed as a share of GDP.
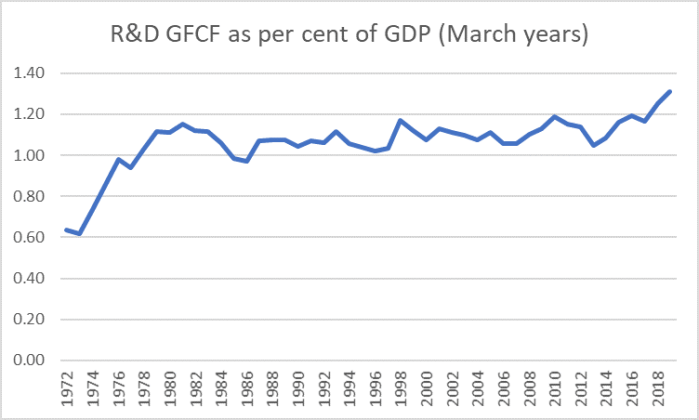
That tick up is before the new subsidies were put in place.
What about the (net, ie after depreciation) capital stock? I showed this chart a few days ago, components that might be expected to show some of the “digital transformation” were it happening apace.

It was rather less encouraging, especially in the last few years.
What about general government and business capital stocks?
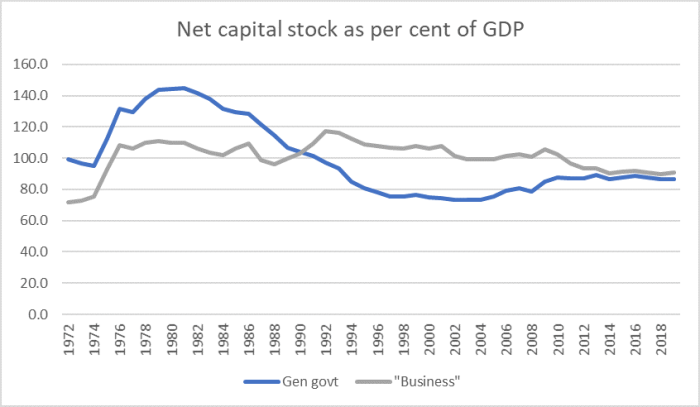
On this proxy measure of the (net) business capital stock, it has been falling as a share of GDP for the last 25+ years, and is still lower than it was in the late 1970s. Now, there is an argument that in advanced economies production is becoming less intensive in physical capital, and to the extent that is so one might expect to see a trend decline. But I doubt this is something to take much comfort from when thinking about New Zealand because (a) we don’t have the Google, Facebooks or the like, and (b) these measures don’t include farmland (although SNZ includes it in their sectoral productivity measures/models), which is still very important to the New Zealand economy. The stock of farmland isn’t changing, while the population (and GDP are), and the stock of farmland would be quite material relative to other business capital.
The point is not, of course, to whip businesses. The questions are really for analysts, economists, and then policymakers, to think hard about why it is that firms – actual or potential – have not regarded it as worth their while to invest more heavily in New Zealand in recent decades. It isn’t clear that any of the relevant government agencies, let alone their ministers, have a compelling story to make sense of what we observe (of private firms going about their business, pursuing oppportunities where they find them).
I’m pretty sure the answer involves some mix of these symptoms, policy instruments, unchanged constraint etc
- remoteness
- the real exchange rate, and
- rapid population growth, most of which is now accounted for by policy choices
On the latter, this chart shows cumulative population growth rates over five years.
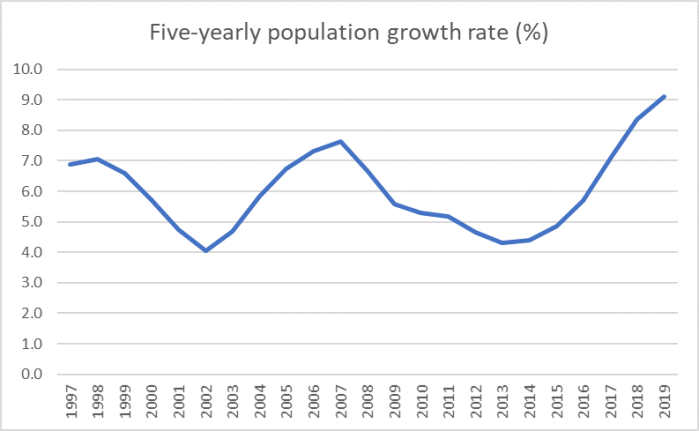
It takes a while for the capital stock to adjust to growth (especially unexpected) growth in population, which is why I’ve shown the (also smoother) five year totals.
Faced with this record, defenders of the New Zealand economic model – including cheerleaders like the Prime Minister and the Governor, but it is also much the same model as the previous government had – should really have been expecting to see investment rates at near-record highs at present. It isn’t even true of government investment – and government is directly responsible for such population-based capex as schools, roads, and hospitals – but it isn’t true of private business either.
The model simply isn’t delivering.
(I’m away for the rest of the week, so no more posts until Monday.)
