The annual national accounts data were released last week. For at least some of the variables – nominal ones – these data offer the longest official national accounts time series we have in New Zealand, in many cases going back to (the year to March) 1972. By contrast, the quarterly national accounts data go back only to the late 1980s. One day, when SNZ and official statistics are properly funded, it would be a worthwhile project to take consistent historical series back several more decades. Doing so would help us make better sense of our economic history.
I was playing around with various series, and nominal ratios, from the national accounts data. This post presents a few of the resulting charts, on investment as a share of GDP and also on the capital stock relative to GDP.
First, investment.
There has been a fair amount of residential building activity going on this decade. Almost certainly not enough (and nothing like the volume of new building relative to population growth that we had in the early 1970s for example) – although the bigger issue is probably land, and the affordability of housing. But what about some other components?
When it was campaigning in 2017, Labour talked a lot about government underinvestment in all sorts of things. As recently as last week, the Prime Minister was talking up government “investment” in all sorts of things. But here is national accounts investment (GFCF) by general government (central and local) as a share of GDP.

The latest data are only for the year to March 2019, and I guess it takes a while for new governments to get things going. But, so far, we aren’t seeing much sign of movement (and do notice how much smaller government investment spending is relative even to the early-mid 70s when population was also growing very rapidly).
What about business investment? SNZ don’t release a series for this – but they could, and it is frustrating that they don’t – so this chart uses a series derived by subtracting from total investment general government and residential investment spending. It is a proxy, but a pretty common one.
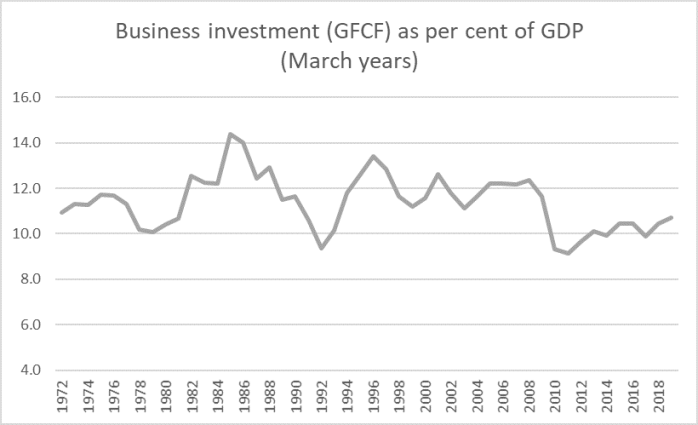
Business investment as a share of GDP has been edging up, but it is still miles below the average for, say, 1993 to 2008, a period when, for example, population growth averaged quite a lot lower than it is now. All else equal, more rapid population growth should tend to be associated with higher rates of business investment (more people need more machines, offices, computers, or whatever). The Governor often tries to talk up business investment, as if the only relevant factor was the interest rates, without ever apparently taking time to think about why business investment here is so subdued.
Within the aggregate numbers, there are the odd glimmers that might encourage some. The government is very keen on encouraging more R&D, and has recently brought in new subsidies to try to encourage firms to do more (again, without stopping to think hard about why more R&D investment wasn’t attractive to private profit-maximising firms). Here is (the total) research and development component of GFCF, expressed as a share of GDP.
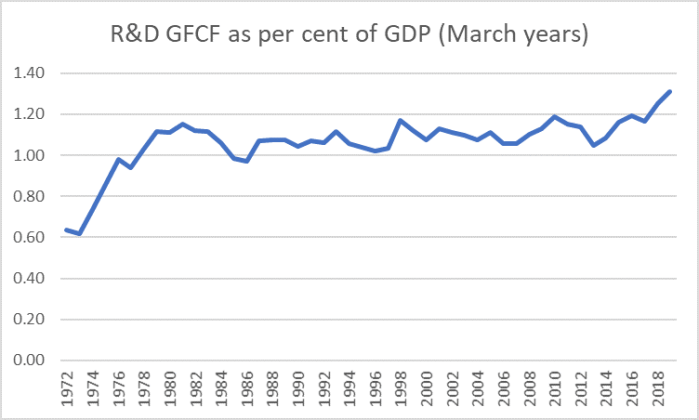
That tick up is before the new subsidies were put in place.
What about the (net, ie after depreciation) capital stock? I showed this chart a few days ago, components that might be expected to show some of the “digital transformation” were it happening apace.

It was rather less encouraging, especially in the last few years.
What about general government and business capital stocks?
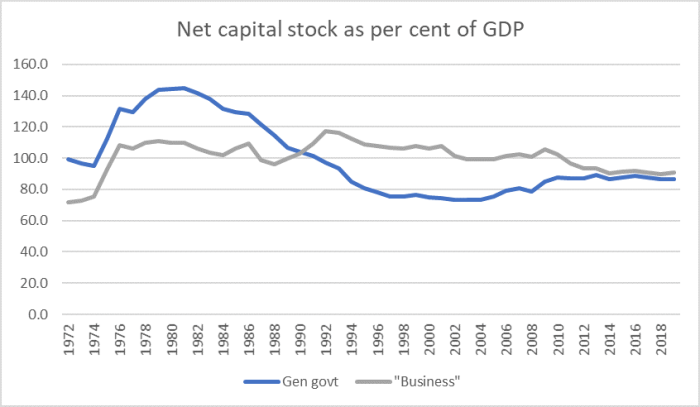
On this proxy measure of the (net) business capital stock, it has been falling as a share of GDP for the last 25+ years, and is still lower than it was in the late 1970s. Now, there is an argument that in advanced economies production is becoming less intensive in physical capital, and to the extent that is so one might expect to see a trend decline. But I doubt this is something to take much comfort from when thinking about New Zealand because (a) we don’t have the Google, Facebooks or the like, and (b) these measures don’t include farmland (although SNZ includes it in their sectoral productivity measures/models), which is still very important to the New Zealand economy. The stock of farmland isn’t changing, while the population (and GDP are), and the stock of farmland would be quite material relative to other business capital.
The point is not, of course, to whip businesses. The questions are really for analysts, economists, and then policymakers, to think hard about why it is that firms – actual or potential – have not regarded it as worth their while to invest more heavily in New Zealand in recent decades. It isn’t clear that any of the relevant government agencies, let alone their ministers, have a compelling story to make sense of what we observe (of private firms going about their business, pursuing oppportunities where they find them).
I’m pretty sure the answer involves some mix of these symptoms, policy instruments, unchanged constraint etc
- remoteness
- the real exchange rate, and
- rapid population growth, most of which is now accounted for by policy choices
On the latter, this chart shows cumulative population growth rates over five years.
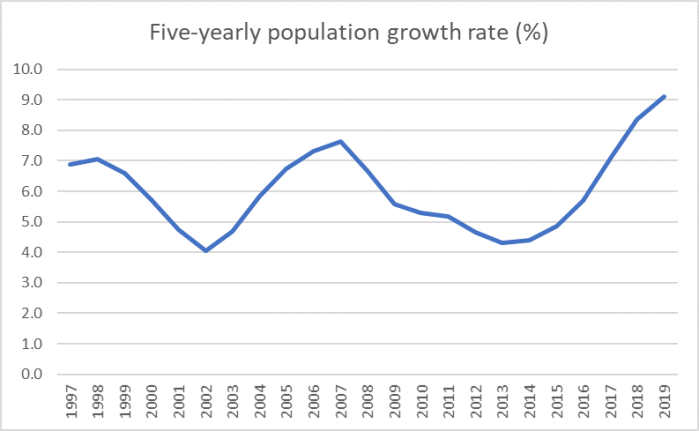
It takes a while for the capital stock to adjust to growth (especially unexpected) growth in population, which is why I’ve shown the (also smoother) five year totals.
Faced with this record, defenders of the New Zealand economic model – including cheerleaders like the Prime Minister and the Governor, but it is also much the same model as the previous government had – should really have been expecting to see investment rates at near-record highs at present. It isn’t even true of government investment – and government is directly responsible for such population-based capex as schools, roads, and hospitals – but it isn’t true of private business either.
The model simply isn’t delivering.
(I’m away for the rest of the week, so no more posts until Monday.)

I think most of this Labour/NZFirst/Greens government spending went into working groups to see where the spending needs to occur and to ban investments to offshore exploration, the expansion of the NZ Universal Super to the Pacific Islands and investments in their economic development, the mulching of trees by Shane Jones, the buyback of banned semi automatics and automatic guns, culling cow herds and compensating Kiwifruit vineyards.
LikeLike
And also wage increments and pay parity.
LikeLike
As at end of October 2019
According to MBIE, a total of 475,920 people were in NZ on work, residence or student visas at the end of October, almost 10% of the total population
LikeLike
Student Visas would number around 100k but many would be on short courses. The equivalent full time would be around 60k. Got a lift from my car repair shop this morning. The young driver was from South Africa. He asked me to guide him to Queen Street, so clearly a newbie on a work permit. I guess drivers fall into skilled migrant category these days. I think they also dropped the minimum $52k pay requirement as well.
LikeLike
In my opinion – forget the models – be courageous
Using Auckland as the focus for the year 2050
Go Big. Think Big. I don’t care how they do it.
To get there, Whangarei and Hamilton and Taurange should be designated as primary cities. SH1 between Auckland-Whangarei-Hamilton should be dual-carriage-ways. Begin upgrading the Ports of Whangarei and Tauranga. Don’t compete. Just do it. Prepare for 2050
Remember the Auckland Harbour Bridge. opened 1959. Reached capacity in 1969 when they had to add the clip-ons. Review the history on wikipedia. The Sydney Harbour Bridge opened in 1932 and did not reach capacity until 70 years later in 2000. The Hume Highway is 880 km long and was eventually dual-carriage-way’d. It took 50 years to complete the Hume highway dual-carriaging.
The biggest cheap-skate mistake New Zealand ever made was doing narrow-gauge railway, maximum speed 80 kph. Australia has wide-gauge maximum speed 200 kph
Auckland Mayor Sir Dove-Meyer Robinson wanted rapid-rail back in the 1970’s and the lobbyists and the naysayers laughed him down and it never happened. Look at it now. They still can’t make their mind up.
Port of Auckland. Gateway for 300,000 motor-vehicles annually and how many tonnes of containers. To get them out of the port they load them on trucks which head straight out onto the CBD streets and up Grafton Gully onto the southern motorway. When there is an accident on the Southern Motorway or the entrance to the North-Western Motorway all that stops. Look at all the clap-trap in the news and the blogs about business-cases and why the port shouldn’t be moved.
Rail infrastructure between Auckland-Whangarei-Hamilton-Tauranga has been starved of maintenance for 60 years. Of course it would cost a fortune to bring up to standard and double-track. But so what
Wellington Mount Victoria Tunnel. Wellington Airport extension. I don’t live in Auckland or Wellington. But you’ve gotta laugh.
LikeLike
August 2019 – after 50 basis points cut – what drives business investment
BNZ’s head of research Stephen Toplis said the biggest concern is that the Monetary Policy Committee continues to believe falling interest rates will drive growth higher in the same way that they have done in the past. “In particular, they remain fixated with the idea that business investment will respond to the cuts that have now been made. And we consistently get feedback from business that lower interest rates will not foster heightened investment”.
“Fixated” is a good description
November 2019 – Bank business loans and overdraft rates at 10%
I would not be advising business clients to invest in the current climate.
The biggest red-flag-warning is the 50 bps cut itself
LikeLike
Business confidence, consumer confidence and property investments confidence all up, so 50bps seems to be a good strong move. What is surprising is that rents are showing double digit rises even as education institutions shut down for the holidays. With 100k international students, departing for holidays, the expectations is falling rents. What happens when they return in Feb next year?
LikeLike
Did you see this Michael?
https://www.macrobusiness.com.au/2019/11/surge-in-low-skilled-visas-delivers-low-productivity-economy/
LikeLike