Having finished yesterday’s post I wasn’t going to give any more thought to the secondary teachers’ pay offer, but for some reason I was curious about the terms of reference the Arbitration Panel had been given, and found myself in the final report of the Panel.
The salary bits of it (the bits I read) were fairly underwhelming to say the least. I’m left assuming that by the time the two parties agreed to arbitration (not really arbitration, but a panel by that name) they both really needed a deal (grumpy parents, election looming etc), and the panel was really just a fig-leaf to enable everyone to save face. If it led to a settlement, both sides could point grumpy stakeholders (eg teachers or Treasury/PSC officials) to the panel and blame them for whatever was not to like.
(When you think of arbitration, one usually thinks of an arbitrator making a final decision. In this case however, the Ministry of Education simply agreed to recommend to Cabinet whatever the panel came up with and the PPTA agreed to recommend it to their members. The decisionmakers were still free to decide, settle, or continue in dispute. As it is, Cabinet has gone along, and the decision now rests with the PPTA members.)
The panel was, in principle, free to recommend whatever it liked. But…..there were the “guiding principles” of the two sides included in the terms of reference
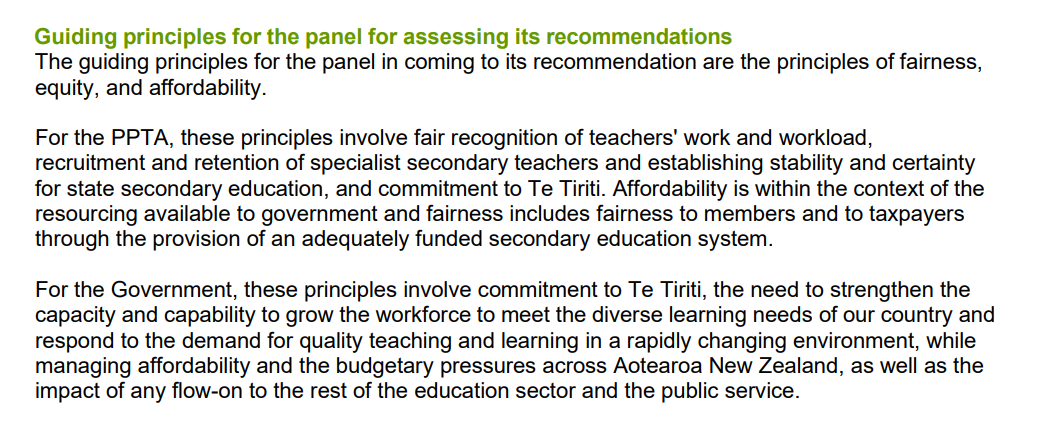
Two mentions of “Te Tiriti” and none of educational excellence, and nothing at all from the government side about recruitment and retention of an able group of secondary teachers (had the government really thought the union bid was out of line with labour market conditions it would have been natural for it to have included recruitment and retention as a key consideration – ideally perhaps the key consideration).
And then there were the panel members. The chair was a retired High Court judge, but the other two were real insiders. On the one hand (presumably from the government’s side), Tracey Martin their former Cabinet colleague now chair of NZQA, and board member of NZTA. Safe for the Ministry/government side you would suppose. And then there was Craig Renney, economist for the CTU but also former economic adviser to Grant Robertson, reputed to be keen on a political career himself, and (as we saw earlier this week) active partisan player in the election campaign that was just about to get underway. He didn’t seem like someone who was going to make life at all difficult for the Ministry/government.
Both sides had to agree to the make-up of the panel, but if you were an ordinary teacher there might have been hints there that things were unlikely to go your way, no matter what the substance of the teachers’ case (which, when all is boiled down really should come down to the question of whether pay and conditions are sufficient to attract and retain the desired quality of teachers).
That wasn’t really how the panel went about things though: instead the nebulous “fairness, equity and affordability” were to the fore.
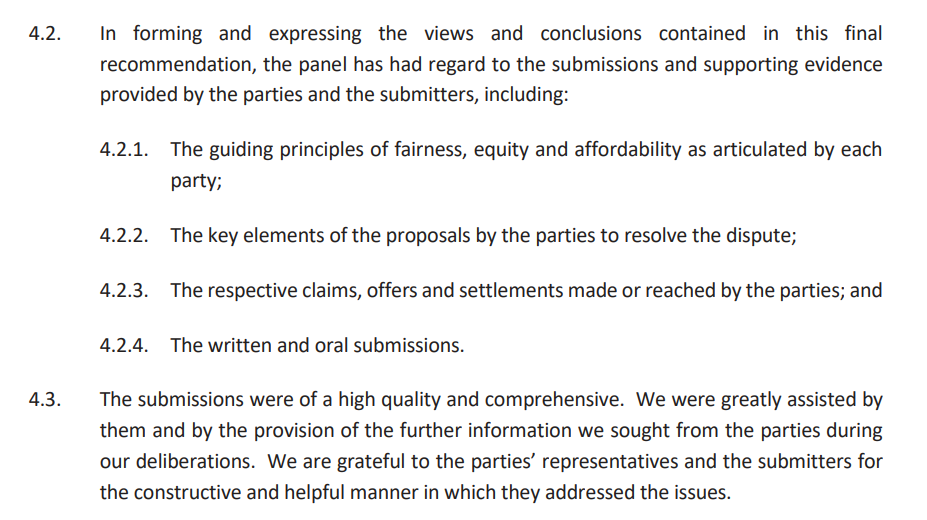
Note too those comments in para 4.3. We don’t have the submissions (presumably an OIA could eventually winkle out the Ministry’s) but what follows will suggest the submissions were probably anything but……but the parties will no doubt have been glad to read this soft-soap stuff.
The report goes on to note that the PPTA sought increases, partly backdated, sufficient to match the increase in the CPI (actual and forecast) over the proposed 3 year life of the deal (from the expiry of the old agreement in July 2022), while the government proposed something substantially less (a cut in real salaries). The union is reported to have cited the following considerations
Some of which are (much) more convincing than others, but several of which seem like very relevant considerations worth testing.
But instead, the panel reports that the Crown’s response was along these lines
Nothing at all about the relevant labour markets but, basically, “the government doesn’t want big wage settlements” (no matter how much inflation their central bank had generated).
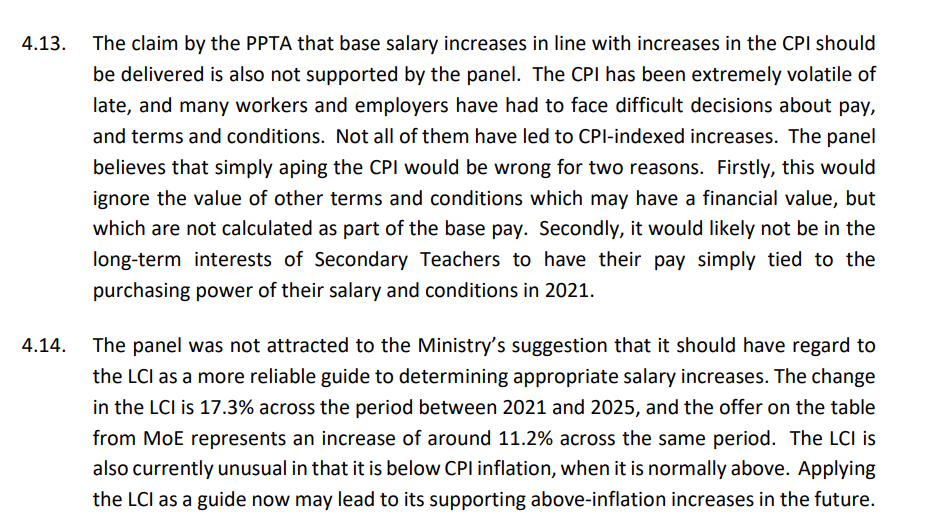
I’m not completely averse to affordability arguments. If your business is in deep trouble and it is a question of whether or not you will even be able to stay in business lines like “I know inflation has been high and other wages are rising a lot, but I simply can’t afford it” make sense and may resonate. Rather less so when the employer is firmly committed to remaining in the business (running high schools and paying their teachers). If you are going to be in the business come what may, and care at all about offering a quality product, you simply need to match the market, and debate should centre on how best to make sense of the relevant market data, details of implementation etc.
Centralised wage-setting may be a far less than ideal model generally, but….it is what both the government and the union seem to like.
When it got to numbers, the report tells us this
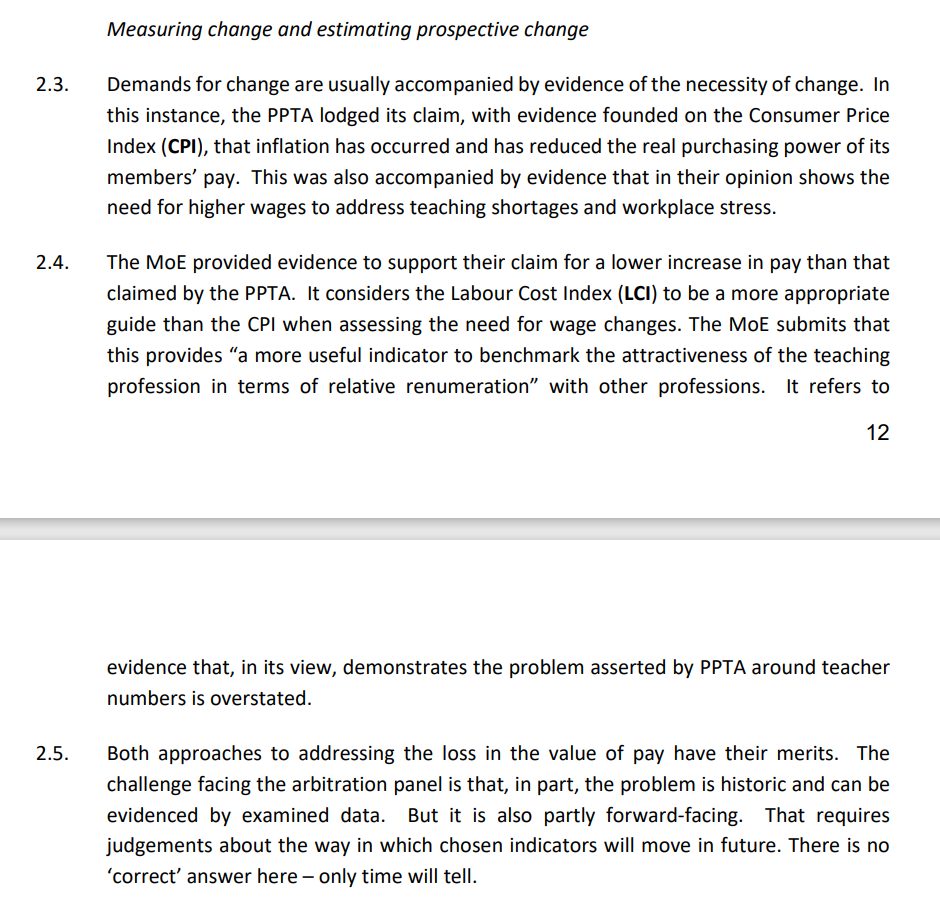
I would usually have fallen off my chair when I read the Ministry’s LCI try-on, except that…..just yesterday chatting about this issue to someone I said “I don’t suppose they were dumb enough to have used the LCI as a comparator. Surely not?” And that was before I knew there was an economist on the panel.
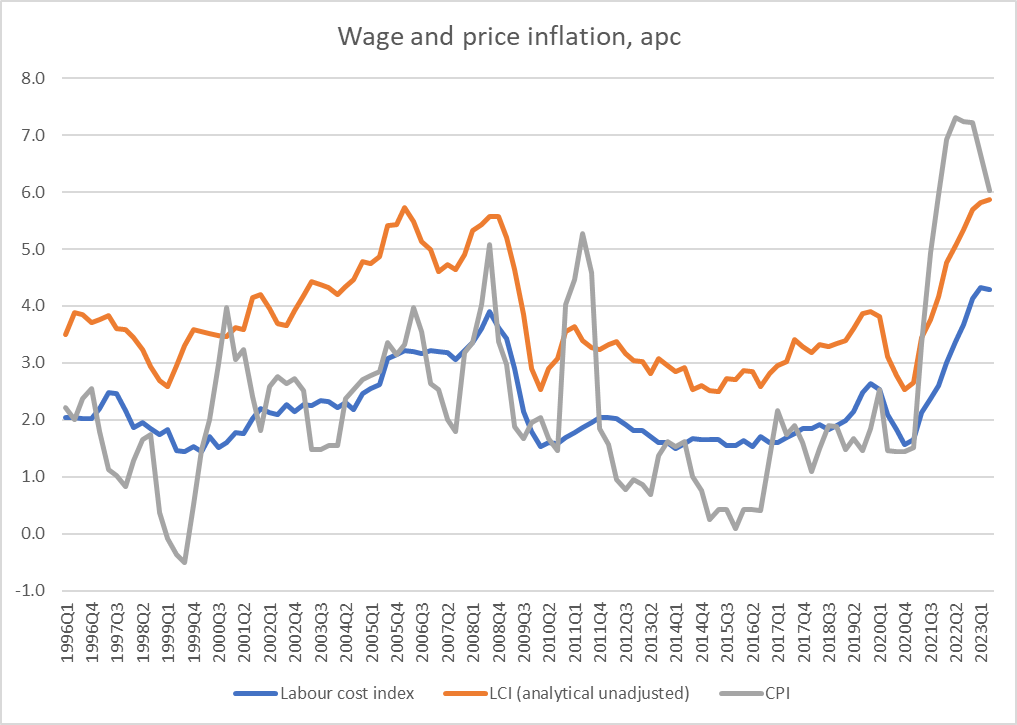
The Labour Cost Index is a stratified measure (good) so not affected by compositional changes, but it is not a measure of wage and salary rates. It is, by design, much closer to a measure of unit labour costs (respondents are supposed to adjust their responses for things like productivity gains). Unit labour cost measure can be very useful in their own right – for insights on competitiveness – but not for benchmarking wage increases.
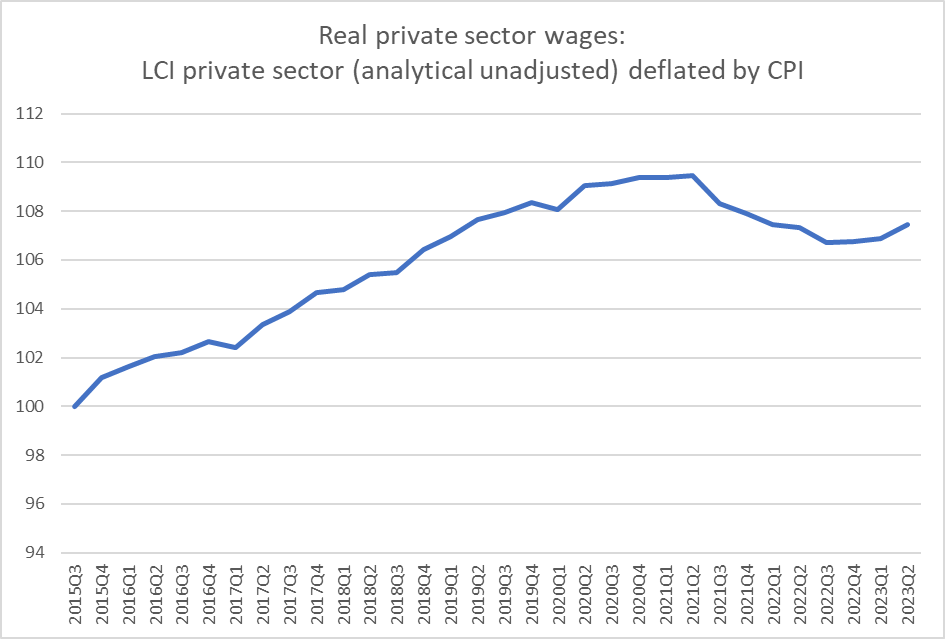
SNZ publish a (stratified) raw measure of wage increases, the LCI Analytical Unadjusted series, which is a stratified measure of wage rates. You can see the difference in this chart.
I’m quite sure the CTU’s economist knows all about this data (probably the Ministry does too, but they had an incentive to spin).
And if you are doubtful of my point, here is a chart of the QES measure of average ordinary time hourly earnings (which has all sorts of compositional issues and so is a lot more volatile) and the LCI analytical unadjusted series.
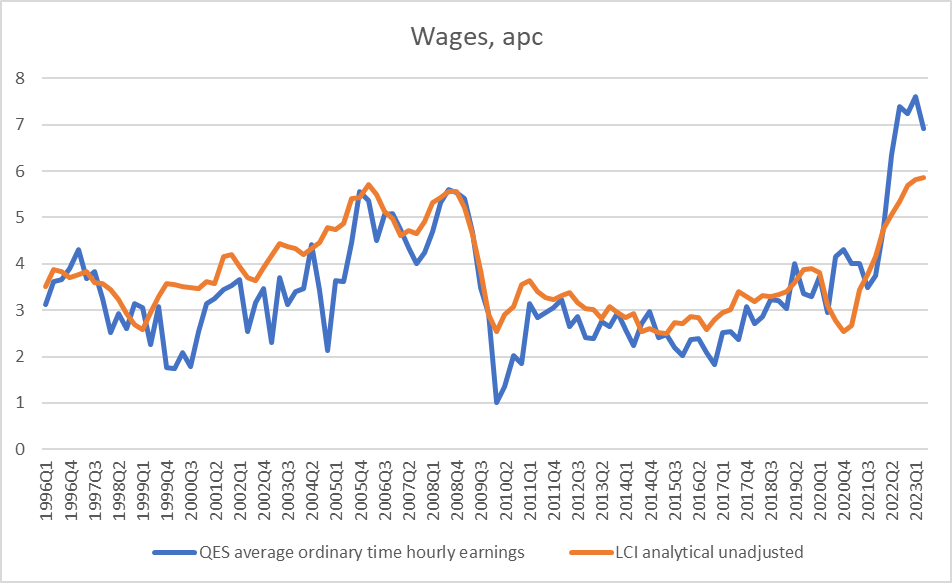
The LCI analytical unadjusted measure might be a mouthful of a label but it is the measure to use for purposes like this. I used the private sector component of it in yesterday’s post, because private sector wages are more responsive to market forces, less constrained by political imperatives and rhetorical stances. The panel itself is just wrong: there is no merit to using the plain LCI in exercises like this.
But nothing deterred here is the panel
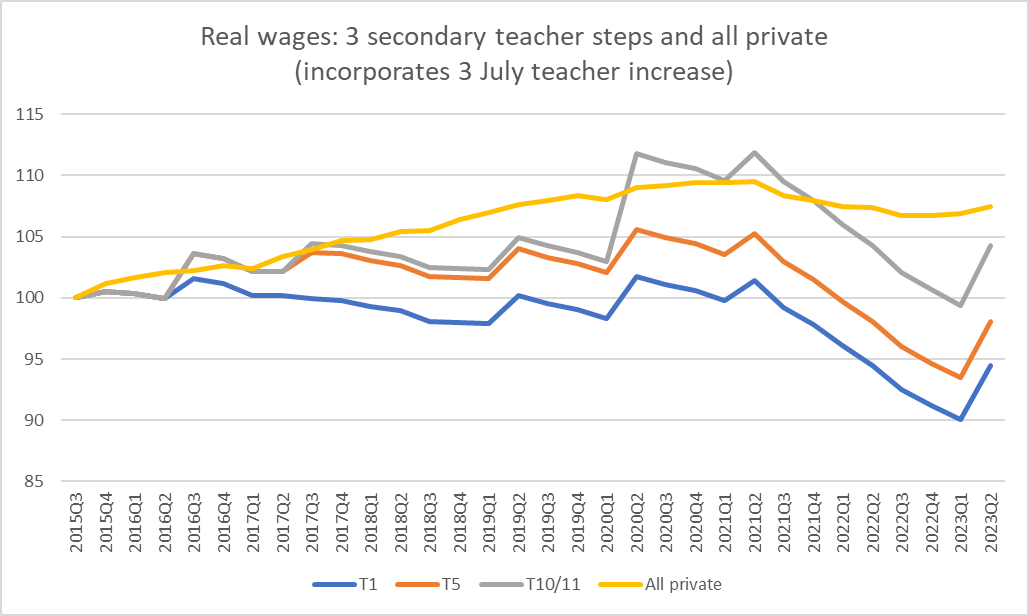
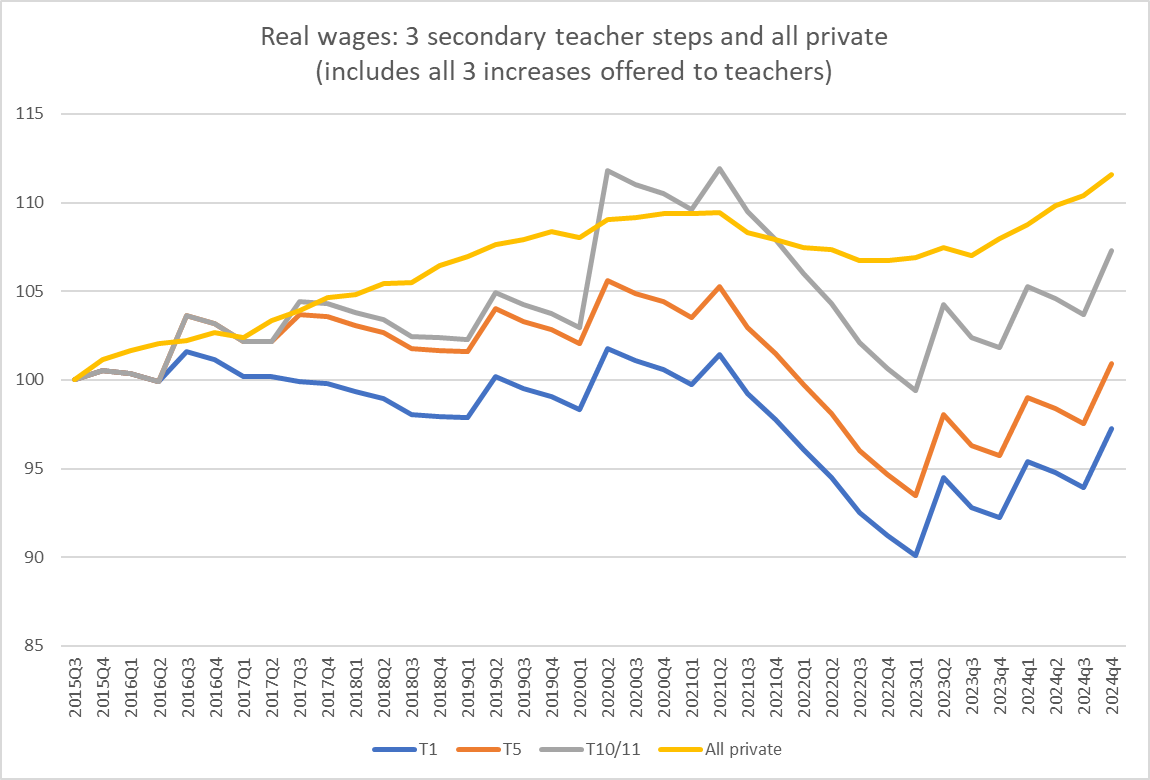
Like me yesterday, they use Reserve Bank May MPS forecasts. They extend the analysis to June 2025, which is sensible as that seems to be the end of the proposed contract period. This is what the chart looks like using the LCI Analytical Unadjusted series (note that both charts use private sector wages, because that is what the Reserve Bank forecasts).
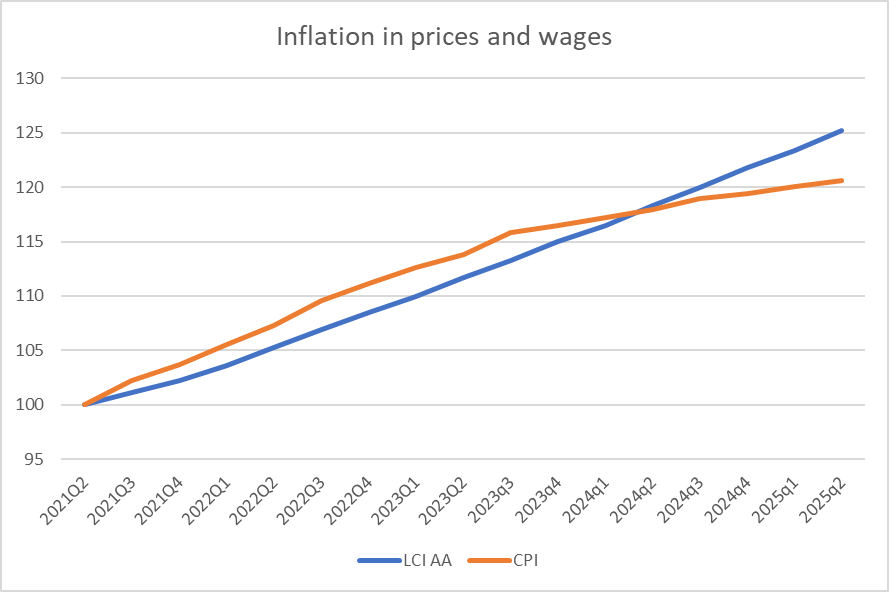
If you happen to prefer the (noisier but better known) QES measure, on RB forecasts it will have increased 27.7 per cent over this period, a bit more again. (The panel does show a chart of the QES, LCI, and CPI, but because the LCI itself undershoots inflation – see above – this seems to be an exercise in distraction, compounded by their repeated attempt to call the LCI a measure of “wage rates”, which it simply is not.
(Set aside here the absurdity of negotiating future wage increases in a climate where no one has any very robust idea what will happen to inflation in wages or prices over the next couple of years, having all gotten the last couple of years so wrong. But…..the Panel was stuck with that model.)
Anyway, the panel continues
Both are garbled messes really worth nothing. For example, few workers will have had wage increases formally indexed to the CPI (then again few workers have mass multi-year collective contracts) but as the chart above shows, over the period both sides want to look at, and using the forecasts both sides seem happy using, private sector wage rates are expected to have risen more than the CPI. The Panel pats the teachers on the head and suggests it wouldn’t be good for teachers to have their pay increased with inflation – even though future contracts will be negotiated in future years – and instead it proposes to give them even less…..
The following paragraph is made worse by the fact that the panel fails to recognise that it is using the wrong wage measure, and that it is quite normal for wages over time to rise faster than prices (that, ultimately is what productivity growth does).
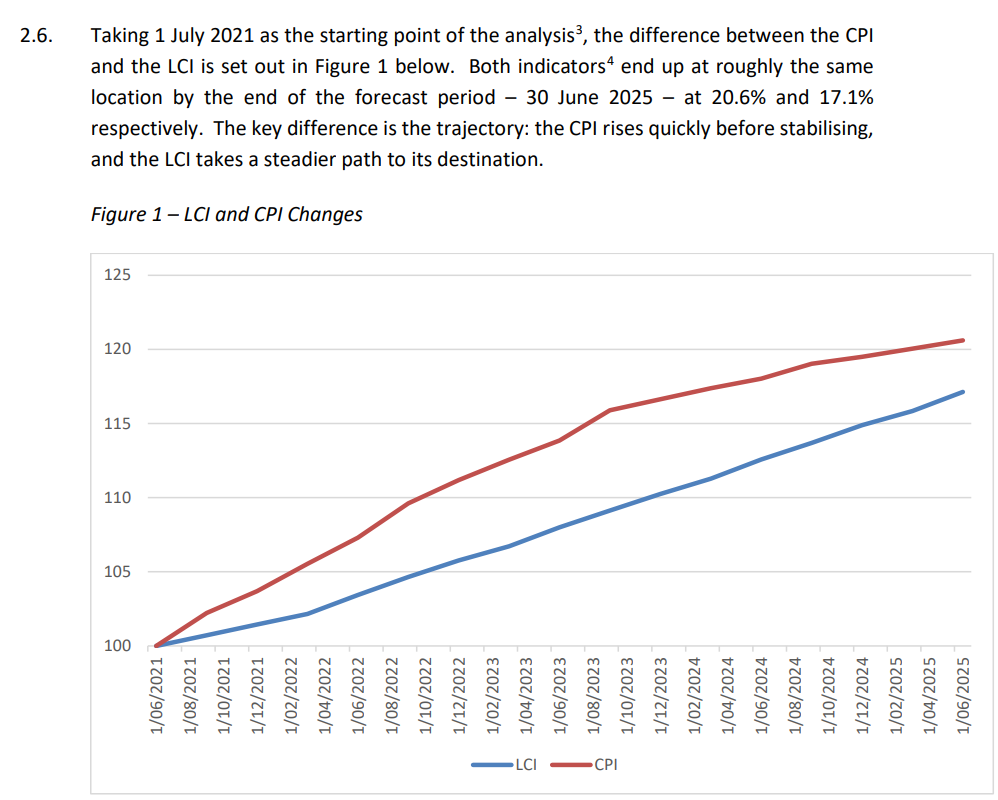
Then the panel does another exercise in distraction. Eschewing the CPI they drag up the Household Living Price Index.
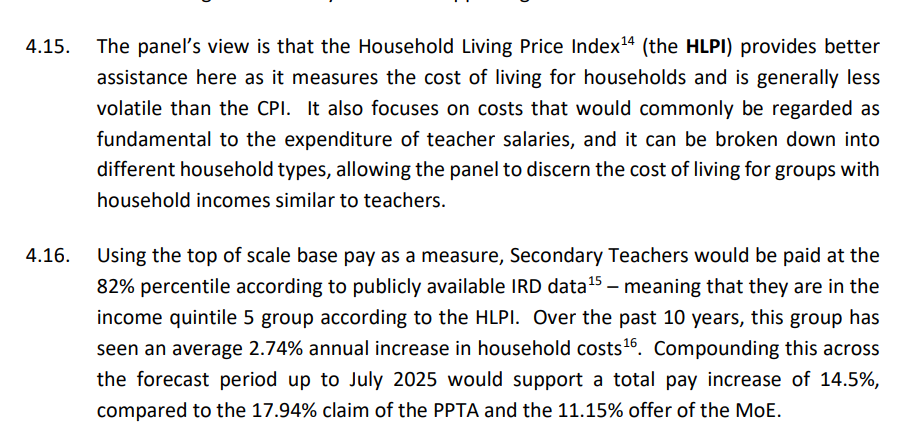
As it says, there are price indices by income quintile. What it doesn’t say is that the increase in the HLPI for the income quintile 5 from June 2021 to now was 15.9 per cent, while the CPI rose “only” 13.8 per cent. It isn’t clear what the last 10 years average increase in the HLPI has to do with anything and of course, there are no forecasts for the HLPI – so the Panel just plucks out of the air a number that suits the bottom line they are trying to produce.
All of this might seem tediously mechanical. What, you might be asking, did they make of recruitment and retention arguments? The short answer is that they never even tried. Here are their own words.
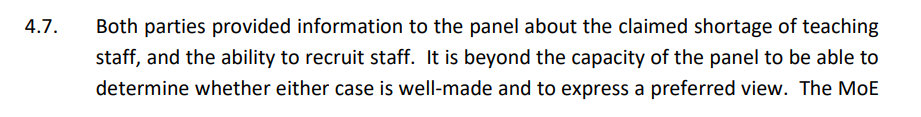
Remember how early on the Panel praised the submissions as “high quality and comprehensive”. But on this core issue they seem now to be saying they weren’t even in a position to know whether the submissions were of high quality. And they simply chose not to engage on the substantive issue. If there is, was, or will be a recruitment and retention issue, or it goes away when this offer is accepted, that will be all by chance because the panel had nothing even to say, and didn’t even try.
So, the bottom line of all this was:
Panel wage increase recommendation to June 2025: 14.5 per cent
CPI increase over same period: 20.7 per cent
LCI (private sector) Analytical Unadjusted increase: 25.2 per cent
QES private sector ordinary time average hourly earnings increases 27.7 per cent
Those last three use (as the panel did) Reserve Bank forecasts to June 2025.
So the Arbitration Panel proposed not only a material cut in real wages of teachers, but an even more substantial cut in real teacher pay relative to pay in rest of the economy (private sector). The logic of their position must be that there was an abundance of able teachers, easily retained, and now (real) pay rates should be cut to bring the market more into balance. But, of course, they never engaged on the substance of that issue and show no sign of having thought about it at all.
And just in case you were thinking, well maybe professional pay has increased less than that of all private sector workers in recent years, well…I checked that too
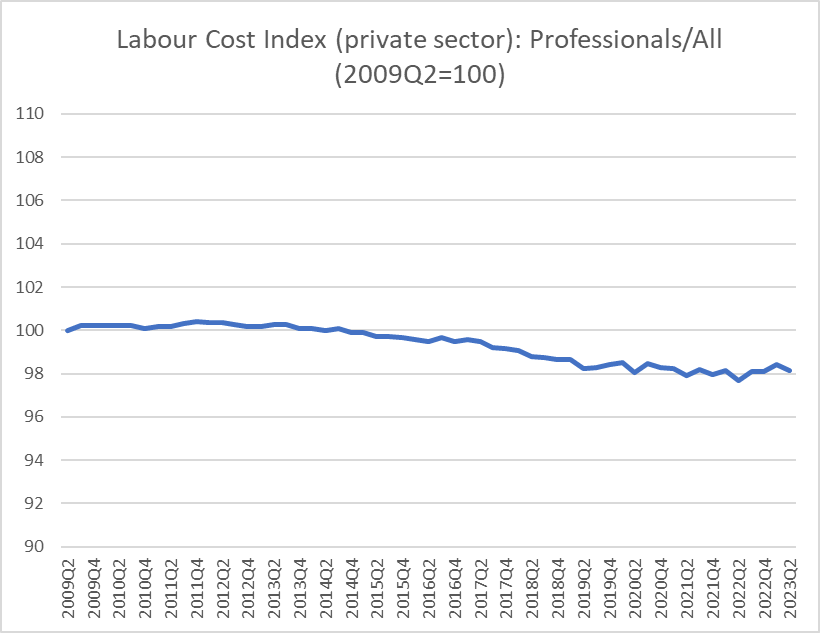
There was a bit of a dip in the second half of last decade, but the Arbitration Panel was focused on the period since mid 2021, and there is nothing of interest in that relationship over that specific period.
This Panel report was simply a shoddy piece of work, clearly much more about politics (face-saving settlement) rather than serious in-depth analysis and thought. I’m not usually a champion of teachers, and the standard of education has clearly been slipping, but on the government’s own terms – they deny the decline – it just seems extraordinary that over a period in which private sector wages are expected to have at least matched inflation, their panel proposes a material cut in teacher real wages, without a jot of evidence (or apparent thought) that recruitment and retention for (capable) secondary teachers has become materially easier than for the labour market as a whole.
Presumably the teachers will end up accepting the recommendation. Maybe at this point they should (election, new fiscal stringency etc), but it hardly seems a robust long-term basis, and we can only look forward to whole new disputes two years hence (especially if, as is far from impossible, the Reserve Bank inflation forecasts they all relied on prove to have been too optimistic (low)). What will attendance, achievement, and recruitment/retention look like by then?
(Some longer-term charts are in yesterday’s post.)
UPDATE: Saturday
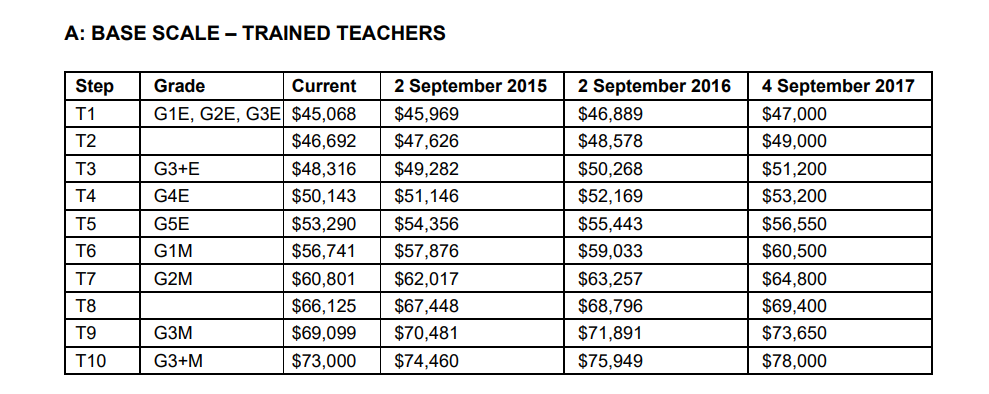
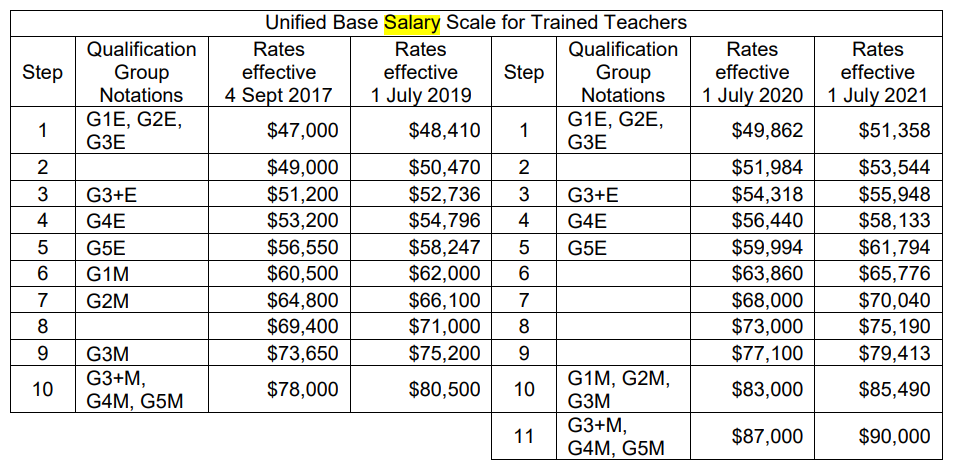
I found secondary teacher salary scales back to July 2009, and had a closer look at matching the various entry and maximum salaries for different levels of qualifications. These don’t matter for the current proposal, since it lifts all rates by a common 14.5 per cent, but it does over longer period.
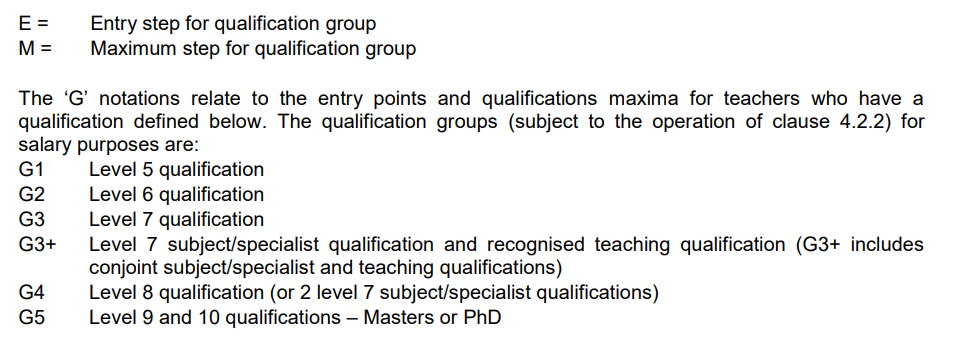
G3 is essentially a teacher with a general bachelor’s degree
G4 is a teacher with an honours degree or subject qualifications in two subjects
G5 is, as it says, a teacher with a masters or PhD
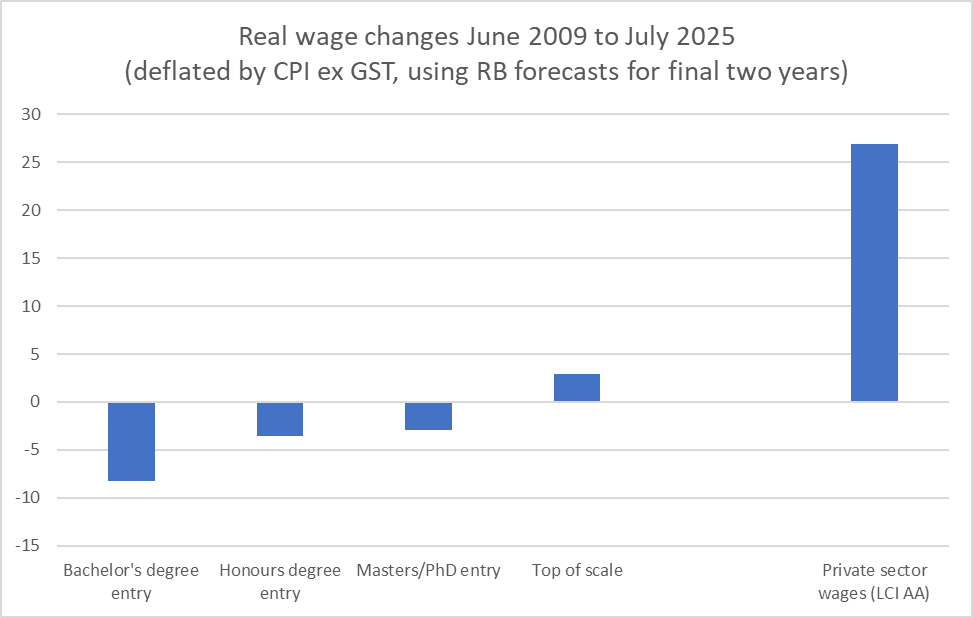
Maximum pay rates for all 3 levels have increased by much the same extent (49.4%) since July 2009 so I’ve shown only the common increase in maxima. Here are real wages changes for secondary teacher entry level salaries and maxima, alongside the real increase in private sector wages (all, as above, using RB May 2025 forecasts for the final two years of the proposed teacher agreement).