In a post earlier this week looking at national saving rates across the OECD, I included this chart

For the last few years, national saving rates in New Zealand have been higher than those in Australia. That isn’t the popular perception, and it hasn’t been common in the past – although for now, the gaps are no larger or more persistent than those recorded for a few years in the 00s.
Before digging behind the numbers, at least a bit, a reminder:
- these are flow saving rates we are looking at here (the share of the year’s net income accruing to residents of the country in question that is not consumed). In the case of business savings, the concept is akin to retained earnings from the profits for the year in question
- I am not looking at stock measures of accumulated wealth, financial assets or anything of the sort.
We can break down these saving rates for each country and see what has been happening in each of the broad sectors: households, governments, and business. All the charts below are expressed as a share of NNI (rather than of the income of that particular sector). In each of the charts below, New Zealand data are for March years and Australian data for June years.
First, lets have a look at general government savings
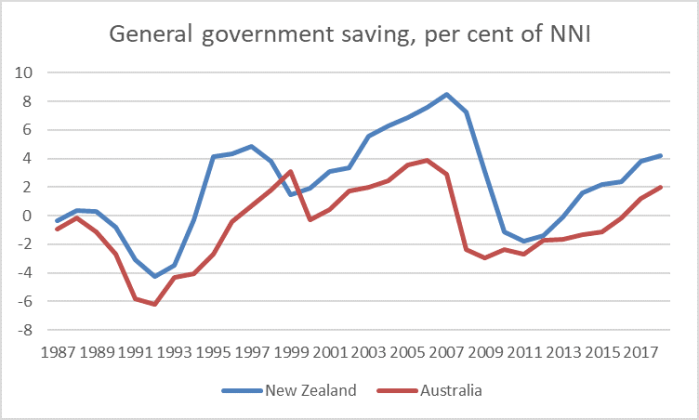
Every year but one the government savings rate (share of NNI) in New Zealand has been higher than that in Australia.
And that is so even though, diverting briefly to stock numbers, in every single year for which we have data, general government net financial liabilites (loosely, net debt) is larger, as a share of GDP/NNI, in New Zealand than in Australia. There are probably two main factors at work: first, the size of government here is larger, as a share of the total economy, than in Australia, and second, New Zealand tends to have a relatively large amount of government investment (GFCF) as a share of GDP.
What about households?
Probably to no one’s surprise
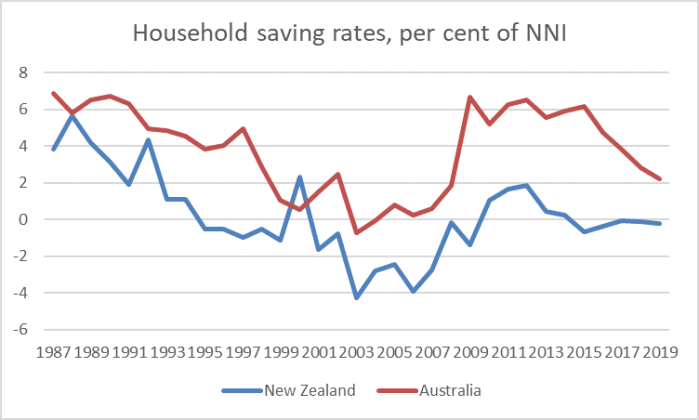
In all but one year, household (net) saving in Australia has been higher, as a per cent of NNI, than that in New Zealand. The size of the gap between the two series hasn’t changed much over time, and there is little sign that the gap now is consistently larger than it was 30 years ago before the compulsory private savings scheme was introduced in Australia. Both countries have had fairly rapid rates of population growth over these decades – although the growth has been concentrated in different periods. Over long periods of time, you’d expect a country with rapid population growth to have a higher household savings rate than one that doesn’t. What is, perhaps, interesting about the Australian series is how far the household savings rate has dropped back again in the last few years.
And what about the business saving rate? In aggregate the picture looks like this
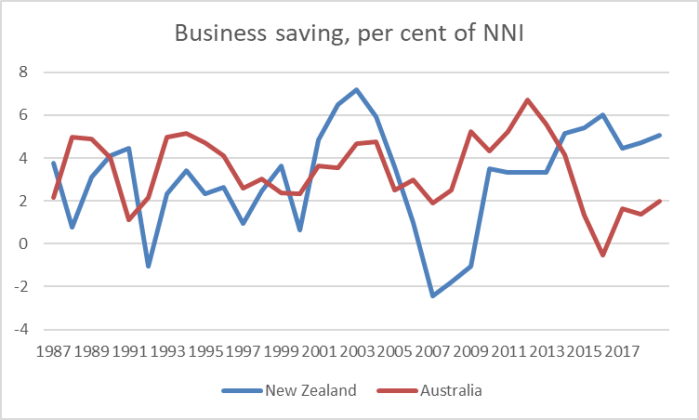
For the first decade or so of the data things are much as you’d expect. Business saving in Australia averaged a bit higher than that in New Zealand, consistent with the fact that business investment rates tend to be higher (partly reflecting the Australian economy concentrating in quite capital intensive sector). You can, loosely, see some cyclical effects: profits tend to fall away quite sharply in recessions and so, typically, will business savings rates.
But once one gets to this century things become harder to make sense of. And the Australia numbers seem easier to make sense of than the New Zealand ones: in Australia as the terms of trade surged and huge new mining sector investment opportunities opened up you’d expect firms to be using higher profits and higher retained earnings to finance part of the huge surge in mining investment. The Australian terms of trade peaked in 2011 and is much lower now. Mining sector investment is also well past its peak. Still, I was a bit surprised to see that overall business saving rates are now lower than they were, on average, in the 15 or so years before the terms of trade boom.
But what of New Zealand? Why did business saving rates surge at the very start of the 00s, and then fall away so sharply – the amplitude of that fluctuation is larger than for Australia more recently. Some of it probably had to do with the exchange rate – which reached a deep trough in 2000 at a time when commodity prices were high. But it doesn’t really seem like a sufficient explanation. And that trough was in the year to March 2007, more than a year before the recession really hit.
Despite my inclinations to look on the gloomy side, I’d almost be inclined to think positively about the recent rise in business savings rates – higher now than they were at any other time in the 1990s – except that there is little or no sign that these higher saving rates reflect any sense of an abundance of investment opportunities. Business saving rates in New Zealand may well now be being boosted by the pressure on dairy farmers to use whatever earnings they can generate to pay down debt.
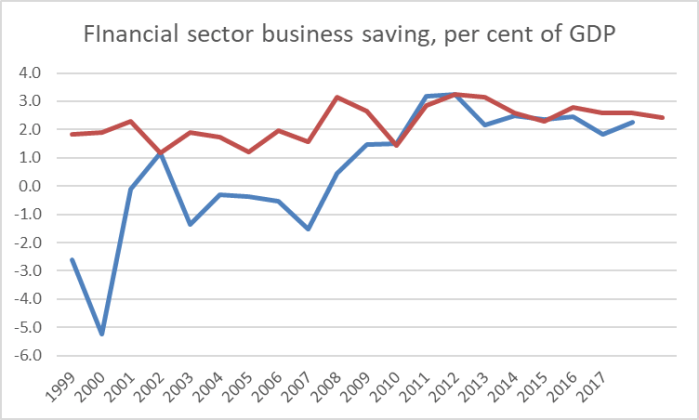
We can use official data to look a little further behind the business saving story, splitting the business saving rate into financial businesses and other businesses. I’m not sure why one would want to – they are all businesses after all – but as it happened there are some interesting, but puzzling, differences uncovered by doing so. Note that for New Zealand the data are not yet available for the March 2019 year. And the New Zealand data are available only for the last 20 years.
Here is financial sector (net) saving
and here is the non-financial business sector
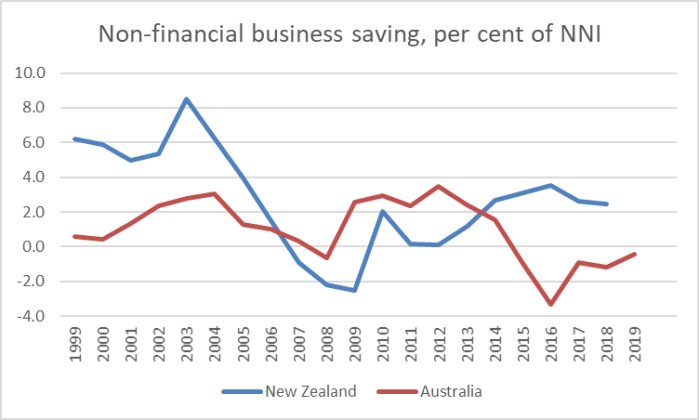
I just don’t know what to make of the earlier years: why would NZ financial sector saving (retained earnings) be so much lower than that in Australia, at precisely the same time non-financial sector business saving was materially higher. Something doesn’t look quite right (but perhaps it is, and I’d be happy to have any authoritative explanations).
More recently, this decade, the financial sector savings rates have been very similar on both sides of the Tasman: rather what one might expect given that the biggest players here (banks) are also big Australian banks. But if that is plausible and roughly right, it leaves the business saving rate in the rest of the business sector quite a bit higher here than in Australia. Which is interesting, and not necessarily what I would have guessed without checking.
I don’t purport to have any particular insights to offer on quite what has been going on. Digging any deeper would probably require more resources and data that I don’t have. But it is interesting that the relationship between New Zealand government savings and Australian government saving, and New Zealand and Australian household saving, have been pretty stable for a long time. The puzzles seem to rest in the business sector data, and unfortunately business saving is quite routinely overlooked when people talk,or think, about saving behaviour in New Zealand. A Treasury, Reserve Bank or Productivity Commission note might be able to shed more light on developments that we probably should understand better than (at very least) I do.

Interesting Michael, thanks.
I would hope/expect that the OECD consolidates Australian State Government data to arrive at general government. Are you confident that is the case?
Clive
LikeLike
Yes, I am confident the Aus numbers incl all levels of govt.
LikeLike
Thanks Michael
A couple of questions and an observation.
1) Does the government sector for Australia include state government?
2) Is the Financial business include KiwiSavers and super funds?
Business saving increased in 2000. I know I am a one trick pony – but that is interestingly correlated with the increase in the top personal rate and the implicit incentive to retain money in a company or transfer to a trust.
LikeLike
Yes, for both countries it is a “general government” concept, including central, state. regional, and local govt.
On 2) I don’t know. I would hope so, but would need to check with SNZ. Recall that asset revals etc shouldn’t affect these numbers, as (a) the revals mostly go to households (the owners), and (b) this is a flow income measure.
I also wondered about the role of tax changes, but if that were a material part of the story you’d expect to see a commensurate drop in household savings. But also bear in mind that the tax change didn’t come into effect until 1 April 2000 and this is March year data.
LikeLiked by 1 person
Perhaps investment property preferred holding entity is a Look Through Company and Qualifying Companies (previously LAQC regime) in NZ whereas in Australia they tend to use Hybrid Trusts. Falling interest costs have a significant boost to profitability and reduction in debt in the recent decade.
LikeLike
I do think Michael Pettis’ theory that international capital flows drive domestic savings rates is very intuitive. But he’s a theorist and I’m not sure if any researchers are following up with the necessary empirical work.
LikeLike
Michael
As you are well aware measuring savin rates ti get anything approaching the “true” underlying rates is notoriuosly difficult. This paper canvasses the issues and makes several adjustments
Measuring Saving Rates in New Zealand: An Update
Emma Gorman, Grant M. Scobie and Yongjoon Paek
New Zealand Treasury Working Paper 13/04
February 2013
Typically household savings are very much higher in NZ than the national accounts estimates.
Moral: B very cautious in interpreting headline savings data
LikeLike
Thanks for the link Grant (to other readers, the paper is worth reading). If I were trying to do some sort of (policy-oriented) overview of the NZ savings story, incl thru time, I would devote quite a bit of effort to the various caveats and possible refinements (in addition to the inflation distortion I discussed in earlier posts last week), but this series was mostly just focusing on what the official series are currently showing, without attempting to draw any strong policy-related conclusions.
LikeLike