Last week marked 10 years since the pressures that were to culminate in the so-called “global financial crisis” burst into the headlines .
Local economist Shamubeel Eaqub marked the anniversary in his Sunday Star-Times column yesterday. It grabbed my attention with the headlines “Ten years on from the GFC” and “We appear dooomed to repeat history” .
Frankly, it all seemed a bit overwrought.
It seems inevitable that there will be yet another crisis in the global financial system in the coming decade.
There have been few lessons from the GFC. There is more debt now than ever before and asset prices are super expensive. The next crisis will hopefully lead to much tighter regulation of the financial sector, that will force it to change from its current cancerous form, to one that does what it’s meant to.
The first half of the column is about the rest of the world. But what really caught my attention was the second half, where he excoriates both the Reserve Bank and the government for their handling of the last decade or so. This time, I’m defending both institutions.
There are some weird claims.
We were well into a recession when the GFC hit. So, when global money supplies dried up, it didn’t matter too much, because there was so little demand to borrow money in New Zealand anyway.
Here he can’t make his mind as to whether he wants to date the crisis to, say, August 2007 (10 years ago, when liquidity pressures started to flare up) or to the really intense phase from, say, September 2008 to early 2009.
Our recession dates from the March quarter of 2008 (while the US recession is dated from December 2007), but quite where he gets the idea that when funding markets froze it didn’t matter here, I do not know. Banks had big balance sheets that needed to be continuously funded, whether or not they were still expecting any growth in those balance sheets. And they had a great deal of short-term foreign funding. Frozen foreign funding markets, which made it difficult for banks to rollover any such funding for more than extremely short terms, made a huge impression on local banks. For months I was in the thick of our (Treasury and Reserve Bank) efforts to use Crown guarantees to enable banks to re-enter term wholesale funding markets. Banks were telling us that their boards wouldn’t allow them to maintain outstanding credit if they were simply reliant on temporary Reserve Bank liquidity as a form of life support.
Despite what he says I doubt Eaqub really believes the global liquidity crunch was irrelevant to New Zealand, because his next argument is that the Reserve Bank mishandled the crisis.
The GFC highlighted that our central bank is slow to recognise big international challenges. They were too slow to cut rates aggressively. They were not part of the large economies that clubbed together to co-ordinate rate cuts and share understanding of the crisis.
I have a little bit of sympathy here – but only a little. I well remember through late 2007 and the first half of 2008 our international economics people patting me on the head and telling me to go away whenever I suggested that perhaps events in the US might lead to something very bad (and I’m not claiming any great foresight into just how bad things would actually get). And I still have a copy of an email from (incoming acting Governor) Grant Spencer in August 2007 suggesting that it was very unlikely the international events would come to much and that contingency planning wasn’t worth investing in.
And, with hindsight, of course every central bank should have cut harder and earlier. I recall going to an international central banking meeting in June 2007 when a very senior Fed official commented along the lines of “some in the market are talking about the prospect of rate cuts, but if anything we are thinking we might have to tighten again”.
As for international coordination, well the Reserve Bank was part of the BIS – something initiated in Alan Bollard’s term. Then again, we were tiny. So it was hardly likely than when various central banks did coordinate a cut in October 2008 they would invite New Zealand to join in. Of its own accord, the Reserve Bank of New Zealand cut by 100 basis points only two weeks later (having already cut a few weeks earlier).
But what did the Reserve Bank of New Zealand actually do, and how did it compare with other advanced country central banks?
The OECD has data on (a proxy for) policy rates for 19 OECD countries/regions with their own currencies, and a few other major emerging markets. Here is the change in the policy rates between August 2007 (when the liquidity pressures first became very evident) and August 2008, just before the Lehmans/AIG/ agencies dramatic intensification of the crisis.
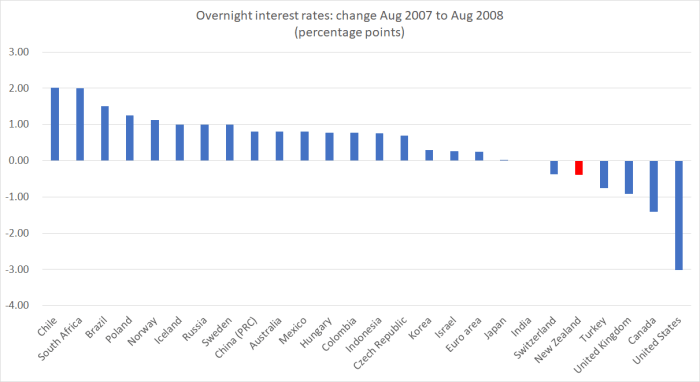
The Reserve Bank had cut only once by this time. But most of these countries had done nothing to ease monetary policy. It wasn’t enough, but it wasn’t exactly at the back of the field, especially when one recalls that at the time core inflation was outside the top of the target range, and oil prices had recently been hitting new record highs.
That was the record to the brink of the intense phase of the crisis. Here is the same chart showing the total interest rate adjustment between August 2007 and August 2009 – a few months after the crisis phase had ended.
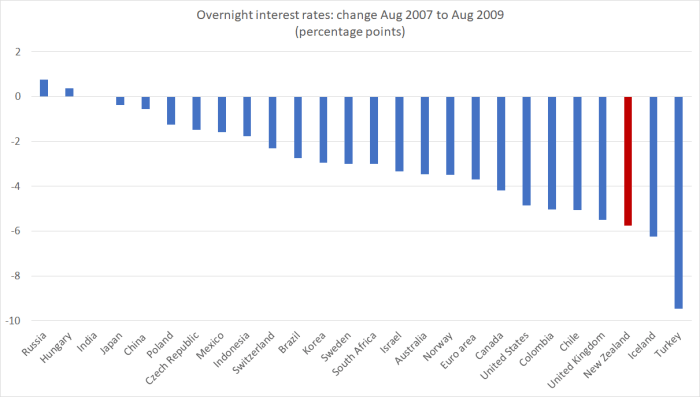
Only Iceland (having had its own crisis, and increased interest rates, in the midst of this all) and Turkey cut policy rates more than our Reserve Bank did. In many cases, the other central banks might like to have cut by more but they got to around the zero bound. Nonetheless, the Reserve Bank cut very aggressively, to the credit of the then Governor. It was hardly as if by then the Reserve Bank was sitting to one side oblivious.
Obviously I’m not going to defend the Reserve Bank when, as Eaqub does, he criticises them for the mistaken 2010 and 2014 tightening cycles. And the overall Reserve Bank record over several decades isn’t that good (as I touched on in a post on Friday), but their monetary policy performance during the crisis itself doesn’t look out of the international mainstream. Neither, for that matter, did their handling of domestic liquidity issues during that period.
Eaqub also takes the government to task
The government bizarrely embarked on two terms of fiscal contraction. This contraction was at a time of historically low cost of money, and a long list of worthy infrastructure projects in housing and transport.
Projects that would have created long term economic growth and made our future economy much more productive, tax revenue higher, and debt position better.
Our fiscal policy is economically illiterate: choosing fiscal tightening at a time when the economy needed spending and that spending made financially made sense.
To which I’d make several points in response:
- our interest rates, while historically low, remain very high relative to those in other countries,
- in fact, our real interest rates remain materially higher than our rate of productivity growth (ie no productivity growth in the last four or five years),
- we had a very large fiscal stimulus in place at the time the 2008/09 recession hit, and
- we had another material fiscal stimulus resulting from the Canterbury earthquakes.
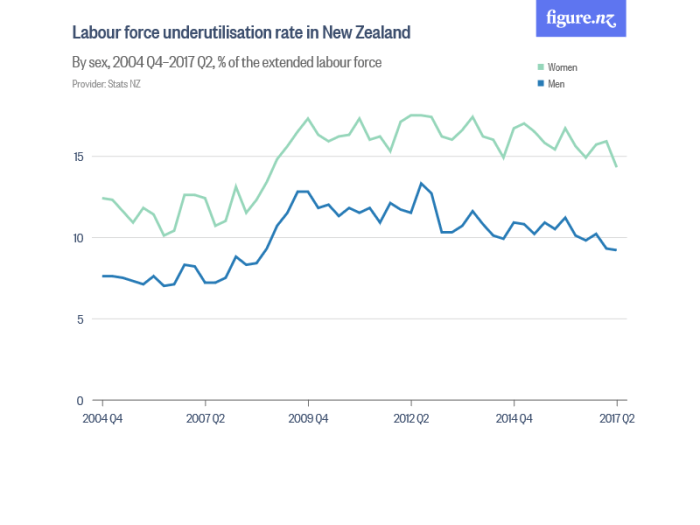
Actually, I’d agree with Eaqub that the economy needed more spending (per capita) over most of the last decade – the best indicator of that is the lingering high unemployment rate – but monetary policy is the natural, and typical, tool for cyclical management.
And, in any case, here is what has happened to gross government debt as a share of GDP over the last 20 years.
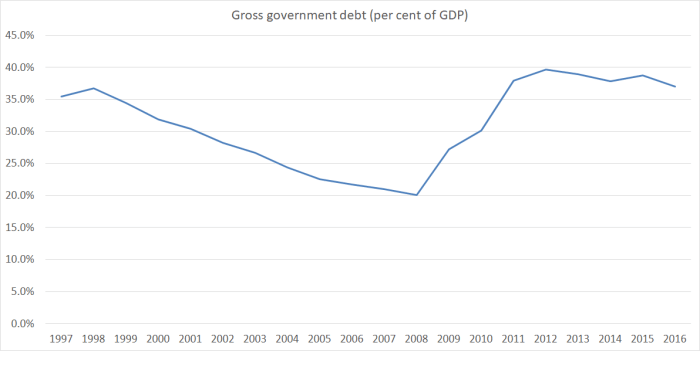
Not a trivial increase in the government’s debt. Not necessarily an inappropriate response either, given the combination of shocks, but it is a bit hard to see why it counts as “economically illiterate”. Much appears to rest on Eaqub’s confidence that there are lots of thing governments could have spent money on that would have returned more than the cost of government capital. In some respects I’d like to share his confidence. But I don’t. Not far from here, for example, one of the bigger infrastructure projects is being built – Transmission Gully – for which the expected returns are very poor.
Eaqub isn’t just concerned about how the Reserve Bank handled the crisis period.
Our central bank needs to own up to regulate our banks much better: they have allowed mortgage borrowing to reach new and more dangerous highs.
I’d certainly agree they could do better – taking off LVR controls for a start. But bank capital requirements, and liquidity requirements, are materially more onerous than they were a decade ago. And our banking system came through the last global crisis largely unscathed – a serious liquidity scare, but no material or system-threatening credit losses. Their own stress tests suggest the system is resilient today. If Eaqub disagrees, that is fine but surely there is some onus on him to advance some arguments or evidence as to why our system is now in such a perilous position.
Macro-based crisis prediction models seem to have gone rather out of fashion since the last crisis. In a way, that isn’t so surprising as those models didn’t do very well. Countries with big increases in credit (as a share of GDP), big increases in asset prices, and big increases in the real exchange rate were supposed to be particularly vulnerable. Countries like New Zealand. The intuitive logic behind those models remained sound, but many countries had those sorts of experiences and had banks that proved able to make decent credit decisions. And we know that historically loan losses on housing mortgage books have rarely been a key part in any subsequent crisis. Thus, the domestic loan books of countries like New Zealand, Australia, Canada, the UK, Norway and Sweden all came through the last boom, and subsequent recession, pretty much unscathed.
One of the key indicators that used to worry people (it was the centrepiece of BIS concerns) was the ratio of credit to GDP. Here is private sector credit as a per cent of GDP, annually, back to when the Reserve Bank data start in 1988.
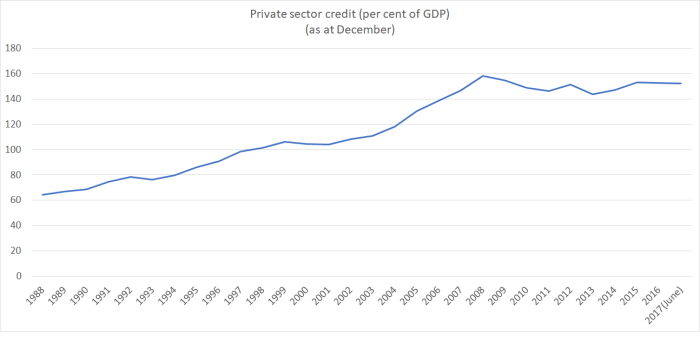
Private sector credit to GDP was trending up over the two decades leading up to the 2008/09 recession. There was a particularly sharp increase from around 2002 to 2008 – I recall once getting someone to dig out the numbers suggesting that over this period credit to GDP had increased more in New Zealand than it had increased in the late 1980s in Japan. It wasn’t just housing credit. Dairy debt was increasing even more rapidly, and business credit was also growing strongly. There was good reason for analysts and central bankers to be a bit concerned during that period. But what actually happened? Loan losses picked up, especially in dairy, but despite this huge increase in credit – to levels not seen as a share of GDP since the 1920s and 30s – there was nothing that represented a systemic threat.
And what has happened since? Private sector credit to GDP has barely changed from the 2008 peak. In other words, overall credit to the private sector has increased at around the same rate as nominal GDP itself. It doesn’t look very concerning on the face of it. Of course, total credit in the economy has increased as a share of GDP, but that reflects the growth in government debt (see earlier chart), and Eaqub apparently thinks that debt stock should have been increased even more rapidly.
It is certainly true that household debt, taken in isolation, has increased a little relative to household income. But even there (a) the increase has been mild compared to the run-up in the years prior to 2008, and (b) higher house prices – driven by the interaction of population pressure and regulatory land scarcity – typically require more gross credit (if “young” people are to purchase houses from “old” people).
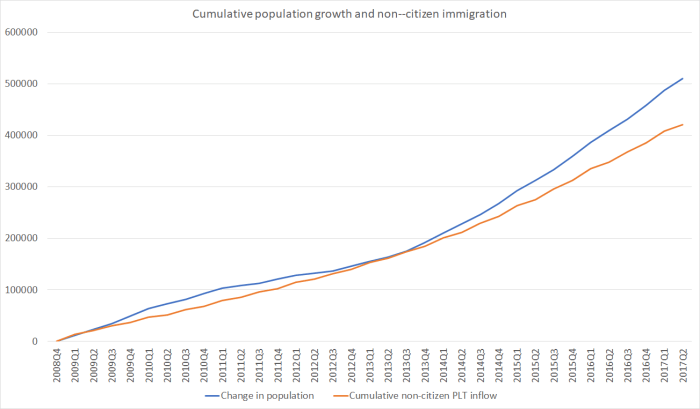
If anything, what is striking is how little new net indebtedness there has been in the New Zealand economy in recent years. Despite unexpectedly rapid population growth and despite big earthquake shocks, our net indebtedness to the rest of the world has been shrinking (as a share of GDP) not increasing. Again, big increases in the adverse NIIP position has often been associated with the build up of risks that culminated in a crisis – see Spain, Ireland, Greece, and to some extent even the US. I can’t readily think of cases where crisis risk has been associated with flat or falling net indebtedness to the rest of the world.
There is plenty wrong with the performance of the New Zealand economy, issues that warrant debate and intense scrutiny leading up to next month’s election. In his previous week’s column, Eaqub foreshadowed the possibility of a domestic recession here in the next year or two: that seems a real possibility and our policymakers don’t seem remotely well-positioned to cope with such a downturn. But there seems little basis for “GFC redux” concerns, especially here:
- for a start, we didn’t have a domestic financial crisis last time round, even at the culmination of two decades of rapid credit expansion,
- private sector credit as a share of GDP has been roughly flat for a decade,
- our net indebtedness to the rest of the world has been flat or falling for a decade,
- there is little sign of much domestic financial innovation such that risks are ending up in strange and unrecognised places, and
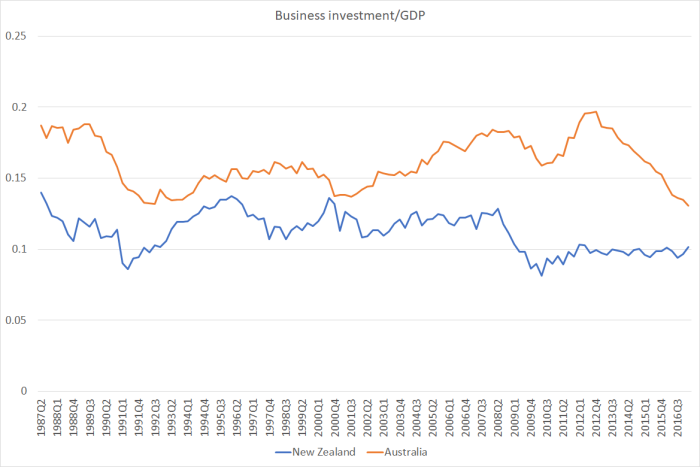
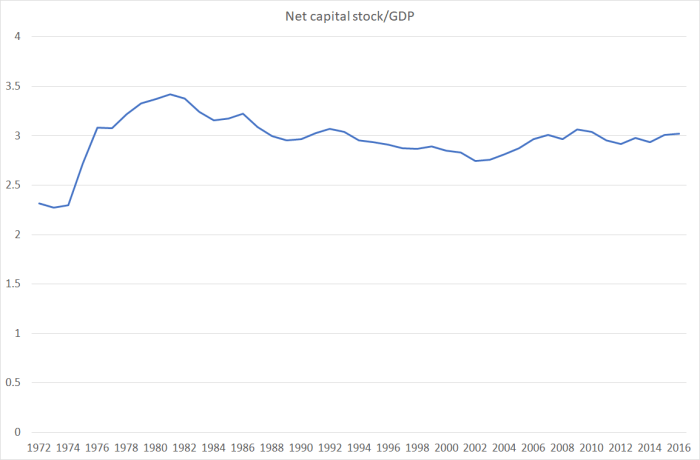
- whereas misplaced and over-optimistic investment plans are often at the heart of brutal economic and financial adjustments, investment here has been pretty subdued (especially once one looks at capital stock growth per capita).
In other words, we have almost none of the makings of any sort of financial crisis, “GFC” like, or otherwise.
House prices are a disgrace. We seem to have no politicians willing to call for, or commit to, seeking lower house prices. But markets distorted by flawed regulation can stay out of line with more structural fundamentals for decades. If house prices are distorted that way, it means a need for lots of gross credit. But it tells you nothing about the risks of financial crisis, or the ability of banks to manage and price the associated risks.
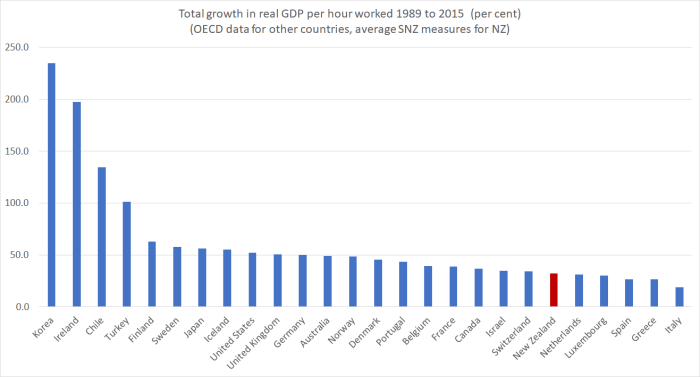
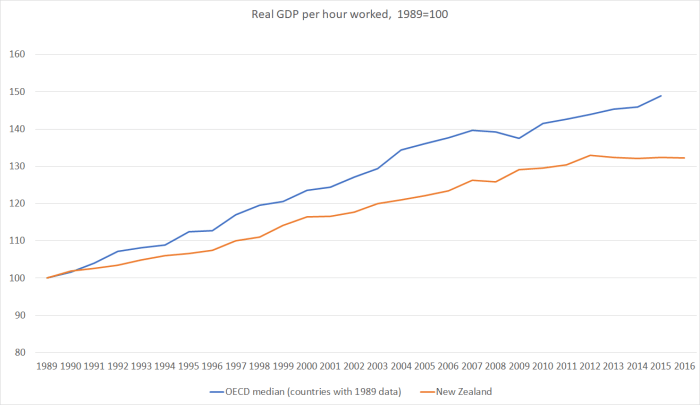

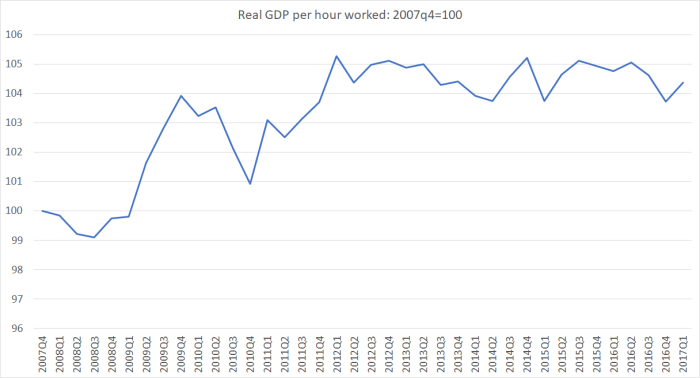
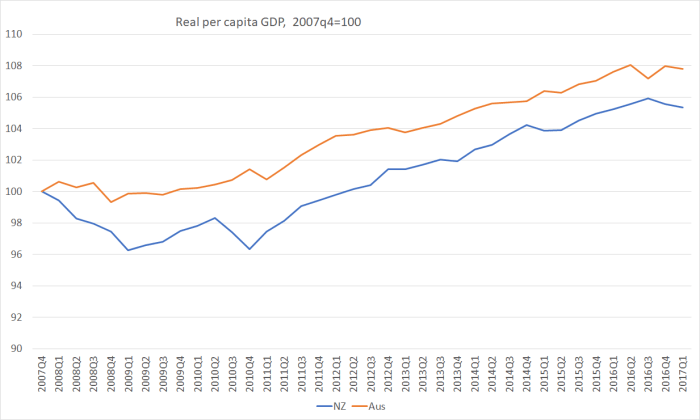
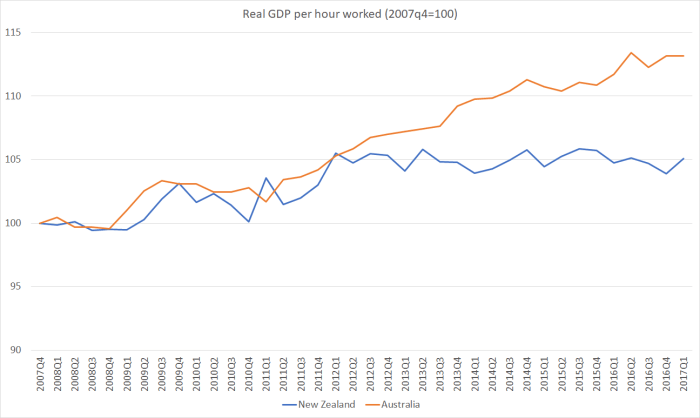
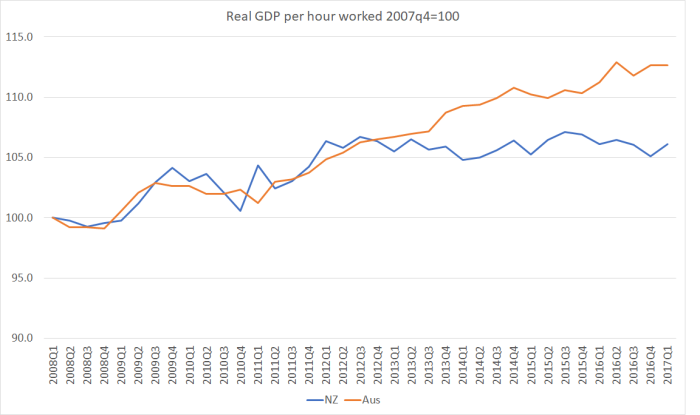 Not only have we had no labour productivity growth for five years, but our near-neighbour Australia – which the government was once willing to talk about catching up to – has gone on generating continuing labour productivity gains. Yes, there has been a productivity growth slowdown in much of the advanced world, dating back to around 2005. But our additional and more recent slowdown – well, dead stop really – looks like something different, and probably directly attributable to New Zealand specific factors. Things New Zealand governments have responsibility for responding to.
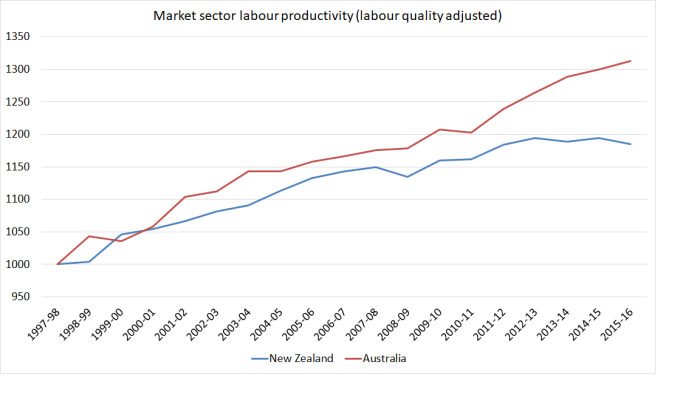
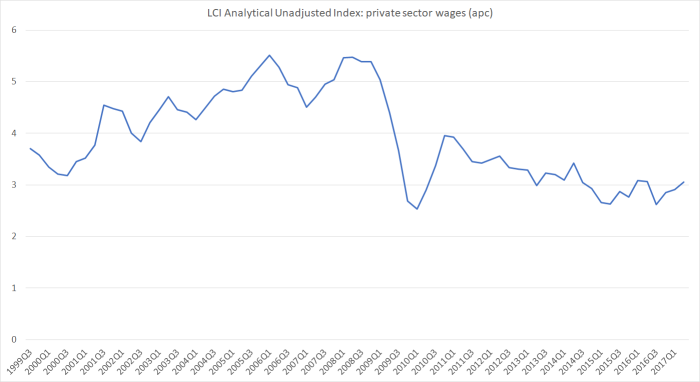
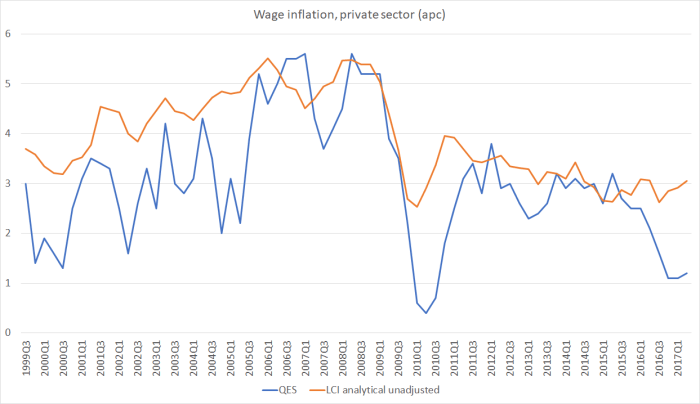 No economic analyst thinks wage inflation is anything like as volatile as the blue line – in fact, wage stickiness, and persistence in wage-setting patterns is one of the features of modern market economies.
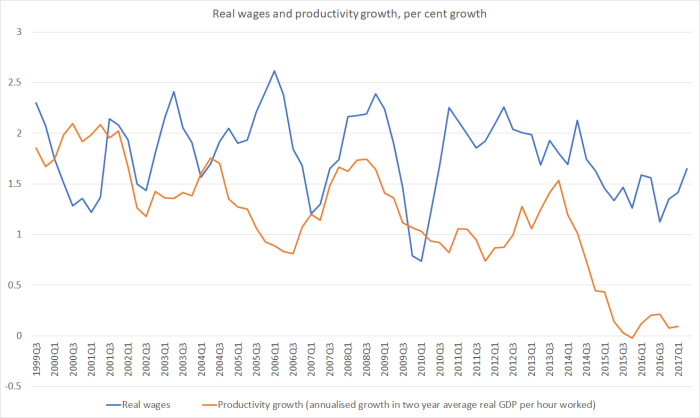


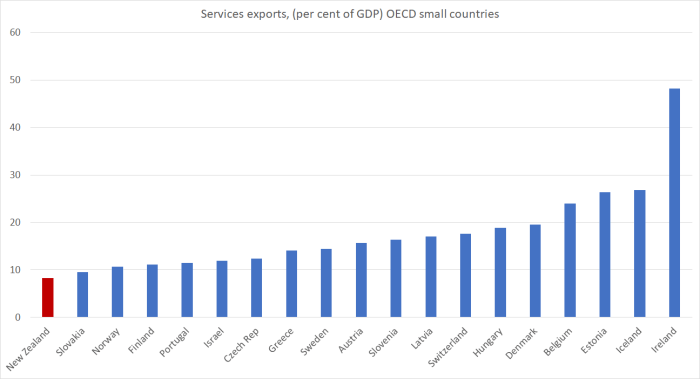
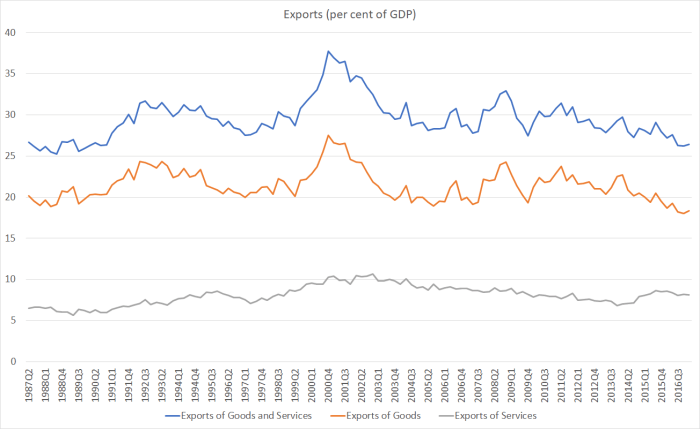 It is easy for one’s eye to go to those peaks in 2000 – at a time when the exchange rate had fallen sharply – but even much more recently the trends haven’t been favourable. Even the vaunted services exports are lower now as a share of GDP than they were 10 years ago, or than when the government came to power. The Minister talked of “high-tech value-added manufacturing” as the future, but then overall goods exports are lower as a share of GDP now than at any time in the last 30 years.