Having done Saturday’s post unpicking some of Steven Joyce’s claims about New Zealand’s productivity performance, I thought it might be worth using the data for a few more charts illustrating something of our performance relative to other advanced countries going back a few decades.
Of the official SNZ data I used in my nine measures of real GDP per hour worked:
- real GDP measures go back to 1987,
- the HLFS goes back to 1986, and
- the Quarterly Employment Survey goes back to the start of 1989.
Thus, using official SNZ data, we can really only do the international comparisons back to full year 1989. The OECD and the Conference Board produce numbers of New Zealand going rather further back (using earlier SNZ data for much of that), and those estimates usefully illustrate our longer-term relative decline. But in these particular posts, I just want to use the official New Zealand sources for New Zealand (and the OECD-reported data for other advanced countries).
Many of the current OECD countries (largely the former eastern bloc ones) don’t have useable data going that far back. So in these charts I’m comparing New Zealand against the 25 OECD countries that have such data all the way back to 1989. That includes all the more “traditional” advanced OECD countries except Austria. But the OECD only has data for all these countries to 2015, so this chart compares total productivity growth across countries from 1989 to 2015.
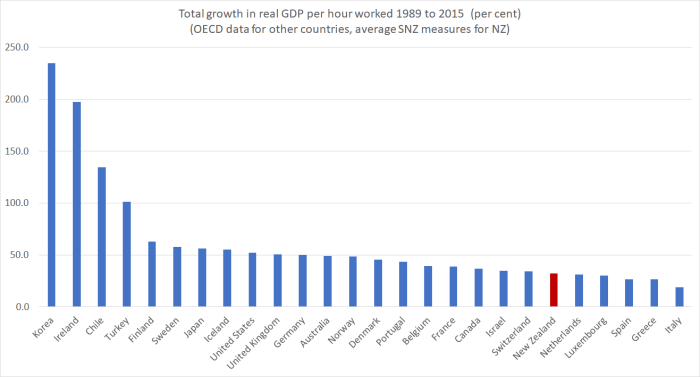
“Pretty dismal” would be my summary of New Zealand’s performance over that entire period. There is a handful of countries that have done even worse. Two are much richer and more productive than us anyway; the others some of the basket cases of the euro-area. And recall that at the start of the period we were in the midst of an economic restructuring programme sold, in part, as designed to reverse the decades-long deterioriation in New Zealand’s economic performance. As a comparisons, in 1989 Ireland is estimated to have had around the same level of real GDP per hour worked as New Zealand.
As I noted in Saturday’s post, there are nine simple ways to combine the various GDP and hours series to produce estimates of GDP per hour worked. In the chart above, I used the average of those nine measures – a 32.4 per cent increase. The range of the nine measures was from 29.0 per cent to 35.7 per cent. At best, we also beat out Switzerland and Israel. At worst, Netherlands and Luxembourg beat us. Over that long period, data uncertainty just doesn’t change the picture much.
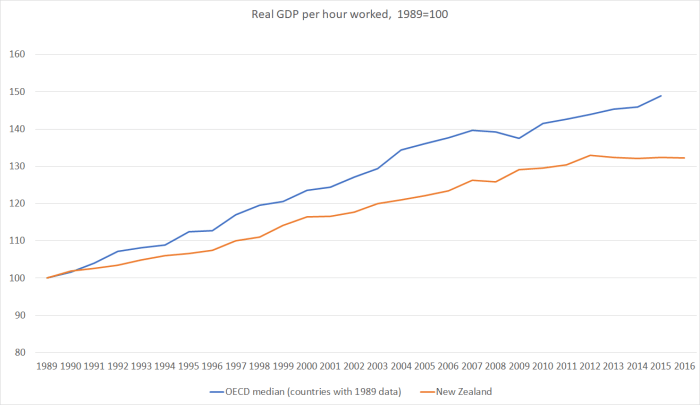
In the next chart, I’ve shown the annual path of real GDP per hour worked for New Zealand (again using the average measure) and for the median OECD country for which there is data throughout the period. In all cases, countries were indexed to 100 in 1989, and so the chart is showing cumulative growth over the period in the two series. The OECD does not yet have data for all countries for 2016.
And here is the same data transformed into a ratio: the New Zealand line divided by the median OECD line, again indexed to equal 100 in 1989.

On this chart, I have included an estimate for 2016, by taking the median productivity growth rate for those OECD countries (most of them) that have 2016 data. I’ve also marked the final year of each of the three governments that changed during this period (1990, when Labour lost office; 1999 when National lost office; and 2008 when Labout lost office).
Over the course of these 27 years, the trend has been downwards – we’ve done (cumulatively) a lot worse than these other advanced countries (and the decline relative to those former eastern bloc countries is materially worse).
I don’t regard the dates around changes of government as being particularly meaningful for these economic comparisons: structural policy changes affect outcomes with a lag, and anyway, at least for the last two changes of government (1999 and 2008) there has been a lot more continuity than differences between the economic policies of the outgoing and incoming governments. But in each of the different governments’ terms there have been years when our productivity growth was faster than that of the median OECD country. Under the current government that year was 2009. And so, as I noted the other day, in their first few years in office we actually made up a little ground relative to these other advanced countries. But since then, the picture has been downhill again. Over the last four to five years all those gains have been lost, and more.
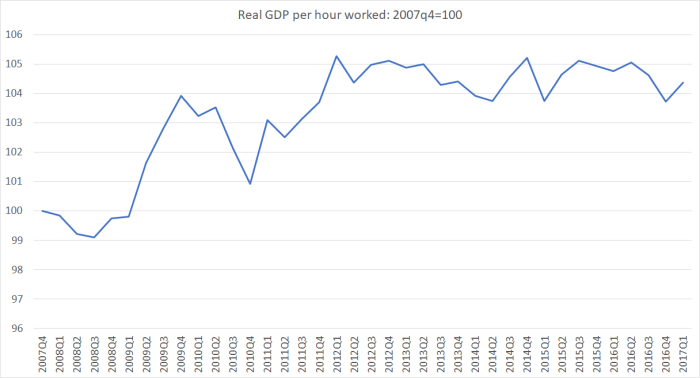
It is what happens when your country manages no productivity growth at all for five years or more (illustrated here using the average of the nine measures).
I chose 1989 for the cross-country comparisons for the practical reason that 1989 is when the consistently-compiled New Zealand data go back to. But it was also David Caygill’s first year in office as Minister of Finance. I’ve shown previously this photo in which he was illustrating his aspirations.
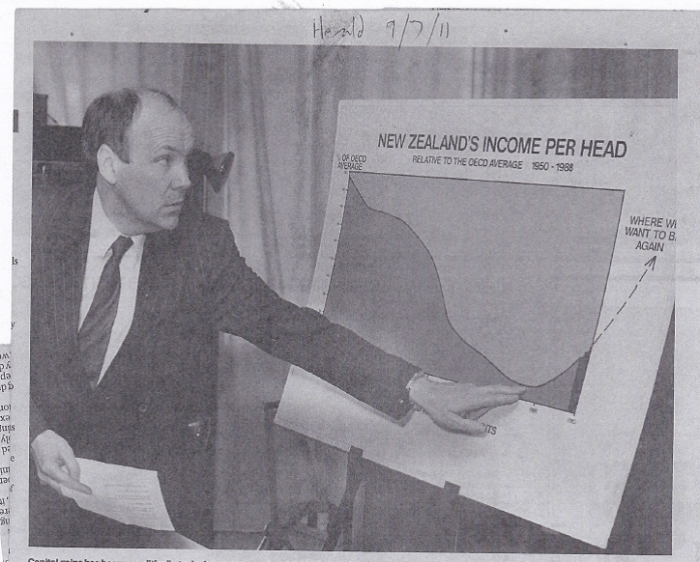
But like his predecessors for several decades before him, and all his successors – including those in the last Labour government and the current National government – he failed. Terms of trade windfalls have help our incomes, but over the longer-term improved living standards – catching up with other countries – depends on improved productivity performance. Our governments have consistently failed that test, and I can’t see anything in the current electoral offerings that seems likely to change the picture in, say, the next decade.

Hi Michael
One thing I wonder with these comparisons is that we tend to import low to moderately skilled immigrants (you’ve done plenty of work showing this). Now, if these immigrants are lower skilled than natives on average, then they will tend to reduce average real GDP per hour worked as they add their low productivity to the economy. But that doesn’t (by itself) make natives worse off. They haven’t reduced natives’ productivity, but in aggregate the economy looks less productive “per hour worked”.
If immigrants are less productive on average, and get paid less on average than natives, why should that worry natives?
I realise you have other macro-economic concerns with immigration, but have you addressed this sort of issue in your writings before?
Thanks
LikeLike
Phil
I’ve never devoted a whole post to the issue, altho I did touch on it in commenting on the New Zealand Initiative paper.
The proposed channell is certainly a theoretical possibility. Perhaps it is even true in, say, Qatar, where there is a really strong bifurcation between citizens and, typically, pretty low-skilled immigrant construction workers etc.
I’d be surprised if there was much to the story here because, inter alia:
– OECD data suggest that our immigrants have had the highest skills relative to natives of any OECD countries (still less skilled than the average native but less so in other countries,
– in recent decades, Canada and Australia have also had high immigration, and actually score a bit less well than us on the migrant skills, and their productivity growth has exceeded ours
– my story involves the pressure rapid population growth puts on real interest rates and the real exchange rate, in a country with a modest savings rate, and the effect that has on business investment and the growth of the tradables sector. that basic model is happy to grant that immigrants are just as skilled as natives, and still concludes that high immigration will lower productivity across the economy (including in “native sectors” or whatever),
– the continued decades-long outflows of NZers to Australia – after a century when it didn’t happen, except cyclically – also suggests that whatever has gone on is (a) real, and (b) affecting natives as well (most of those leaving are native).
That is just a quick brain dump. I will think some more about it.
LikeLike
The problem is that you are making wild assumptions based on inaccurate PLT data that shows that NZ population recently has been growing at a rate of 2.1% per annum which is equivalent to an average of 90,000 per annum. If we go back to the last census in 2013 and compare that to 2006 the population actually only grew by 214,000 which is an average of 30,000 per annum which is less than 1% growth per annum. At the time Statistics NZ had grossly exaggerated the population to be an additional 400k rather than the actual 214k over that 7 year gap between census.
Statistics NZ has been consistently getting it wrong due to the effect that International students and foreign workers have on PLT data. The difficulty arises to to their change is their visa categories and the high churn rate.
LikeLike
See the 12/16 numbers in my post on Friday. This time, and so far, the PLT numbers have been a reasonably good indicator of the people coming and staying for longer than a year.
https://croakingcassandra.com/2017/09/01/whats-happening-to-immigration-data/
the uncertainty about the population is only about (a) the period since 2013, and (b) are the met migration contribution. Whatever the best guesses on the last few years post next year’s census won’t alter the underlying story, that NZ’s growth over recent decades has been accompanied by much more rapid population growth than has been seen in most advanced countries. That might be a good thing for NZers or, as I argue, it might not.
LikeLike
Michael you do us a great service in these articles. I think you have proven that mass immigration has not solved NZ’s poor productivity and low income woes. I am less convinced that you have proven the case that NZ should return to a low population reliant on high natural resources per capita economy.
Looking at your graph. Finland has done well in its productivity growth.
Here is some information about Finland
1. Finland has no direct road or rail access to Europe’s large urban areas (other than Russia -which is poor). If access and proximity are the key factor for productivity -then Netherland would have higher productivity growth than Finland.
2. Finland has language barriers -Finnish is not a germanic or latin language so it is hard to learn. Finland has put enormous resources over decades into teaching its population english to overcome this barrier.
3. Finland a century ago when it became independent realised that its package of natural resources was not enough to ensure the population would have a growing high standard of living. The country committed itself to investing in human resources. There is now a well established culture that the best way forward individually and for country is education.
4. This strategic approach of investing in human resources has worked -look at the productivity figures.
LikeLike
Hi Brendon
I’m trying to stay clear of causes in this particular pair of posts. But on Finland, it is worth bearing in mind that its population is only about 20% higher now than it was in say 1960 (chosen only because the chart I pulled up started then) while our population is double 1960 levels. Even since 89, their population is up about 12% and ours is up by 40-45%. And on those OECD skills numbers, our workers seem to do at least as well as theirs. You know Finland better than I do, but if anything I’d be inclined to use the Finland vs NZ comparison as not inconsistent with my story.
Michael
LikeLike
Yes Michael I think you could use Finland as a country as an example of country that has done very well with only moderate population growth. So again I think this is evidence that high population/high immigration rates are not necessarily needed to have a successful economy.
What I am advocating for with my agglomeration argument is subtly but importantly different. Urban agglomeration is not about the total city size -it is about how much access people have to amenities, workplaces, retail outlets,,,, it is about the ease of interacting and the opportunities this creates……
I believe New Zealand hasn’t invested in that, we have not valued it. I think the housing crisis, congestion, travel time delays etc are all symptoms of agglomeration productivity barriers our collective attitude has created.
P.S there is empirical evidence in my article backing up my contention that productivity in cities is about mobility/access not raw population numbers.
LikeLike
You certainly won’t get any disagreement from me on, eg, congestion charging, or something along the lines of your reciprocal (voluntary intensification). But, welcome as the sorts of gains the Bertaud paper cites would be if we could get them, they would close our productivity gaps to places like France, Germany, Netherlands, the US, or even Australia. Take the Melo paper he cites for the US, even if one could double the 6.5% real wage gain for Auckland, and capture just as much in Wgtn and Chch, you’d still only be looking at around a 6.5pp closing in the gap nationwide. Better than any govt has achieved for decades, but still small relative to the scale of the gaps (and I’m still sceptical how applicable such results will turn out to be in Akld, where it isn’t obvious that there are outward-oriented industries just on the brink of growing a lot faster).
LikeLiked by 1 person
I know your argument just name-drops it once, but Ireland is a poor data point to compare to: see https://ftalphaville.ft.com/2016/07/14/2169550/placing-irelands-economic-recovery-in-context/?mhq5j=e3 for example. The first sentence of the article is “Being a corporate tax haven can do strange things to your national accounts.” Things like aircraft leasing bugger up GDP massively.
LikeLike
Yes, it certainly has its problems as a comparator, as I noted when i mentioned Ireland in my post on Saturday. Nonetheless, i don’t think anyone doubts that there has been a huge improvement in the national (Irish) bits of the economy, per capita, relative to NZ over the last 30 or 40 years. Some of that is genuine gains from low company tax rates.,
But i certainly caution people not to pay much attention to Irish numbers for the last few years – real GDP per hour worked is recorded as having risen 21.8% in 2015 alone (while the years prior to it look more sensible in underlying terms)
LikeLike
Michael you have criticised the agglomeration argument as a way of improving NZ’s productivity by showing that relative to the rest of NZ, Auckland’s GDP growth has been poor for the last 18? years.
This may be true and there may be specifics policy problems around transport and housing which means that Auckland (and other metropolitan areas in NZ) are not benefiting as much from agglomeration related productivity growth as they could be.
Perhaps if the country addressed those barriers -then productivity would rise?
That is my contention here in this article.
View at Medium.com
LikeLike
You are trying to stay clear of causes but anyone with the curiosity to read your posts are unlikely to be so self-controlled.
As per previous comments I remain puzzled by measuring productivity – as a computer programmer I was often most useful when I had the sense to leave a working manual system in place but that meant my productivity in lines of code was zero. And I wonder which doctor is most productive; the one who amputates two limbs rather than one or even the doctor who places patients on a queue that results in some deaths before surgery date. However like quantum theory and relativity which are both critical to a working smart phone I will take on authority that international statisticians have everything under control.
So here is my theory: productivity is most commonly found among young bright open-minded people. So just when a Kiwi is most probably productive he/she is likely to take an extended OE. The anecdotal evidence is that Kiwis were usually very productive workers when I met them in London and Port Moresby. If my theory has any substance there would be a correlation between numbers on OE and declines in productivity. I still like your theory that rapid population growth makes small businesses lazy and non-competitive.
If this productivity quandary is not solved then NZ will continue to decline and our bright Kiwis on OE will stop returning home. We could become a colony of a more successful country?
See http://www.nzherald.co.nz/business/news/article.cfm?c_id=3&objectid=11914711
for an example of how New Zealand is losing exceptional talent – Dr Privahini Bradoo proud to be a Kiwi but her factory is in Arkansas and I wonder how many days a year she spends in New Zealand.
LikeLike
Remember that productivity isn’t really a matter of how hardworking or smart people are – there are elements of that, but no one really doubts that NZers are pretty hardworking and as smart/educated as their peers in the other traditional advanced countries. Here it is more about the economic opportunities that are able to turn a profit here and, thus, the level of real wages the economy can support. Really able people can relocate from London or San Francisco to, say, St Helena and – with very few exceptions – just won’t be able to replicate their London/SFO earnings. In many cases, the same issue will arise moving from London to Londonderry (or any remote provincial city)
For some activities location doesn’t matter – much – but for most it still seems to matter rather a lot, arguably (in many of today’s leading sectors) more than ever. Thus my argument is that NZ is really remote – not many high value operations will naturally locate here – and that we’ve further skewed things against ourselves by using policy to drive up the population quite rapidly, both putting lots of people in a place that people were naturally leaving (see outflow to Aus last 50 years) and skewing the exchange rate and real interest rates against anyone thinking of building an outward oriented business based here.
Perhaps there is something (of macro level significance) in what Labour is saying about skills/education, but in the absence of evidence that our people are systematically less skilled/less able than their OECD peers, it feels more like a redistributive policy, and perhaps even a feel good one, rather than a structural economic solution. I don’t have an in-principle objection to redistribution, but it isn’t a substitute for policy that lifts productivity.
LikeLike
This is a huge conundrum to ponder. Its perplexing in that I see people working harder and smarter all around the place. So if observation is any thing to go by the something must be wrong somewhere else.
Never have liked GDP.
Thought I google GDP NZ and see what I could find.
so.
New Zealand’s diverse market economy has a sizable service sector, accounting for 63% of all GDP activity in 2013.[17] Large scale manufacturing industries include aluminium production, food processing, metal fabrication, wood and paper products. Mining, manufacturing, electricity, gas, water, and waste services accounted for 16.5% of GDP in 2013.[17] The primary sector continues to dominate New Zealand’s exports, despite accounting for 6.5% of GDP in 2013.[17]
GDP From Agriculture 3266.00 NZD Million
That is just over 3 billion. Now Fontera inputs about 8 billion to our economy. Whats going on here.
Are our offshore transactions being accounted for?
No Idea but something is screwball.
https://tradingeconomics.com/new-zealand/gdp-from-agriculture
Exports NZ$61.722 billion (FY 2013)[9]
https://en.wikipedia.org/wiki/Economy_of_New_Zealand
LikeLike
Fonterra isn’t in agriculture itself, but in manufacturing and (I think) wholesale trade.
LikeLike
Nope, doesn’t appear to be there either.
GDP From Manufacturing 5809.00 5754.00 6266.00 3968.00 NZD Million
http://www.nzherald.co.nz/business/news/article.cfm?c_id=3&objectid=11916806
worth a read of this. Game industry hots 100 million. BUT most of that is siphoned off via China so will never appear it seems on our GDP even if classed as an export.
“Finland’s game industry earned over $4b last year, for example.”
Everett said the main thing holding the sector back was a lack of R&D funding.
“[It’s] the most pressing need facing the sector. It’s what is needed to develop more original creative IP [intellectual property] for export.”
LikeLike
i suspect you are quoting quarterly figures rather than annual figures for the GDP components. Food manufacturing alone is around a $10bn pa business (a couple of years ago at the bottom of the dairy cycle) and Fonterra is primarily a manufacturer and marketer. of course, Fonterra activities in China or Aus or elsewhere won’t appear in the NZ GDP numbers (altho any profits will appear in our GNI numbers). (GNI is the value accruing to NZ residents, whereas GDP is the value-added in physical NZ).
LikeLike
Correct. Missed that.
LikeLike
Clearly the service sector dominates. Now also with a booming international student export worth $4billion plus Tourism a $11 billion export industry, both of which also are service based industries the whole productivity argument goes out the window. The best service equates to more people and not less. Until AI robots can fulfil that service role, productivity is a poor measure of success.
LikeLike
Productivity growth is the only sustainable basis for real wage growth. Doesn’t really matter whether the econ activity is in services or other sectors, or even whether official statisticians can properly measure the productivity.
LikeLike
Seems the good people of NZ, Spain, Italy, and Greece have shown a growing preference for leisure: certainly feels like summer has increasingly zapped energy levels in recent years…
LikeLike