Investment data again highlight fundamental weaknesses

After an early morning with some boisterous visiting nieces and nephews, there is a certain calm retreat in getting back to some of the details of yesterday’s national accounts release.

I’ve written previously here about the investment numbers.  The state of investment spending is a useful, if never foolproof, indicator of the state of the economy.  Not so much in a mechanical adding-up sense –  a quarter of weak investment probably translates into a weaker quarter for GDP – as in the questions the data can pose about just what is going on more broadly, and the viable opportunities that businesses are finding, and taking up (or not), in New Zealand.

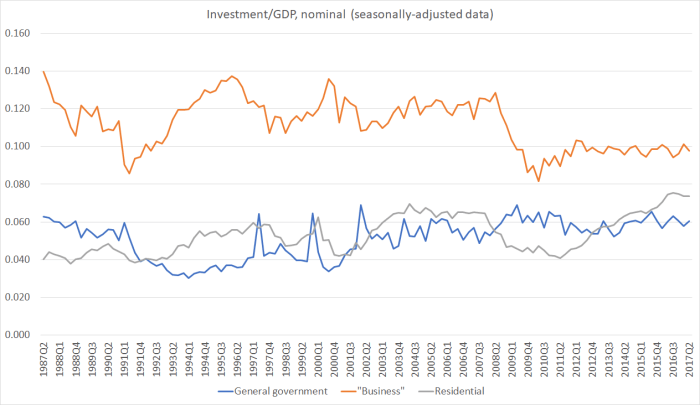
My typical starting point is a chart like this, breaking out investment spending into residential, government, and “business”.  (I put “business” in quote marks because, as the OECD does, it is calculated residually –  subtracting the other two components from total fixed capital formation.)

I shares of GDP june 17

Using quarterly data means living with a bit of “noise”, but not that much, and doing so enables us to see if there are any material changes emerging at the very end of the series.

I don’t want to say much about general government investment spending.   In recent years, that share has been averaging a bit higher than what we saw in, say, the five years before the last recession.  Then again, government (central and local) has faced significant post-earthquakes repair and rebuild expenditure, and the population growth on average over recent years has been a bit faster than that in the previous decade.  If anything, one might have expected the government investment share would have needed to be a bit higher still, at least given the range of functions governments currently take on,

What of residential?   In nominal terms, residential investment spending (new builds and renovations etc) as a share of GDP is now just below the highest levels seen in the history of this series (and actually in the annual series which goes all the way back to the year to March 1972, thus capturing the peak of the building boom in the early 1970s).    Given the rapid rate of population growth –  a little higher, but lasting longer, than the growth rates 15 years ago –  one would expect to see a pretty high share of GDP being devoted to housebuilding and associated activities.   But you will notice that the residential line has fallen a bit in recent quarters, and consistent with that the volume of residential investment spending undertaken in the June quarter this year was about 1.4 per cent lower than such spending in the June quarter of last year.

popn growth apc

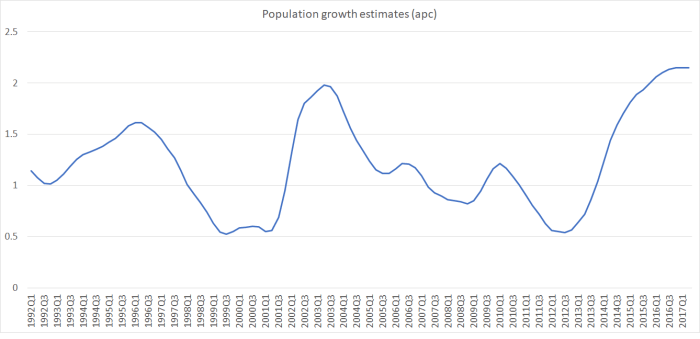
In this post, my main interest is in the business investment component (the orange line in the chart).  Strip out the modest quarter-to-quarter fluctuations up and down, and there has been no real change in the share of (nominal) GDP devoted to business investment for almost six years now.   Over the six years, business investment as a share of GDP has been materially lower (around 2 percentage points of GDP) than the average for the 15 years or so prior to the 2008/09 recession.    That is a big change.    And doubly so because of the sustained acceleration in the population growth rate in the last few years (and with it growth in the number of jobs).  Workers typically need capital equipment, even if it is nothing more than a laptop (and associated software) and a place to work.

Ratios of nominal investment spending to nominal GDP aren’t the only sensible way to look at things. In particular, in New Zealand a lot of capital equipment is imported (eg vehicles and most machinery, but not buildings themselves).  A high exchange rate –  such as we’ve had in recent years, but also had to a lesser extent in the last few years of the 2000s boom –  tends to lower the price (in NZD terms) of capital equipment.  The volume of business investment might still be growing quite rapidly, even if the nominal investment spending share of GDP is pretty weak  (of course, for tradables sector firms the high exchange rate is no gain –  capital equipment might be cheap, but the expected returns to any investment are also dampened).

So here is a chart of the annual percentage change in real business investment.

bus i 2

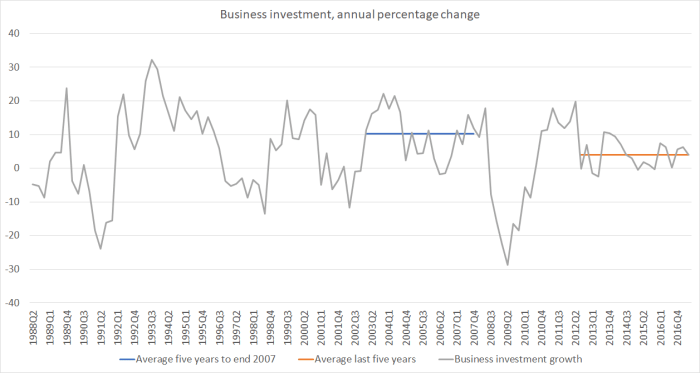
The volume of business investment has been growing, but at a quite modest rate.  In the last five years of the previous previous boom, the annual growth rate was around 10 per cent per annum.  Over the last five years, the annual growth rate in the volume of busines investment has averaged only about 4 per cent (which also happens to have been the growth rate for the last year).

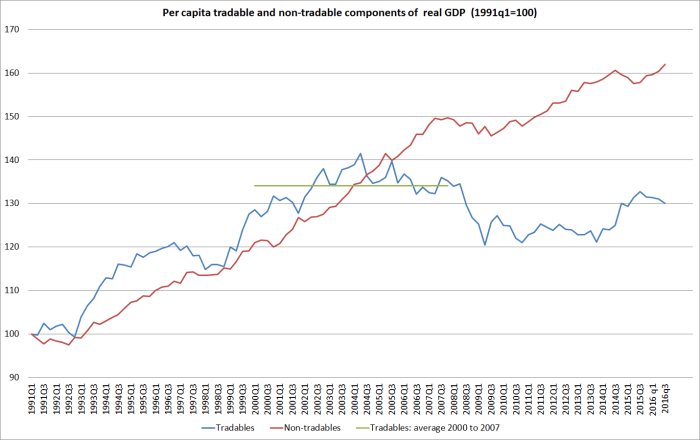
These pictures don’t really surprise me.  They are what one would have expected once one knew of (a) the magnitude of the damage caused by the earthquakes (from day one  at the Reserve Bank we knew this was a large non-tradables shock, which would skew activity away from business investment, especially in the tradables sector, for several years), and (b) the scale of the population increase.   Those pressures have helped hold our real exchange rate up so much and for so long, and reinforced the persistent large margin between our real interest rates and those abroad.  In that sort of environment, total business investment (share of GDP) is less than it otherwise would be, and –  although it isn’t able to be illustrated here –  what business investment does occur will be skewed away from tradables sectors.   Not even very high terms of trade levels were enough to counter-act the downward pressure on business investment growth, and monetary policy held tighter than it needed to be didn’t help either.

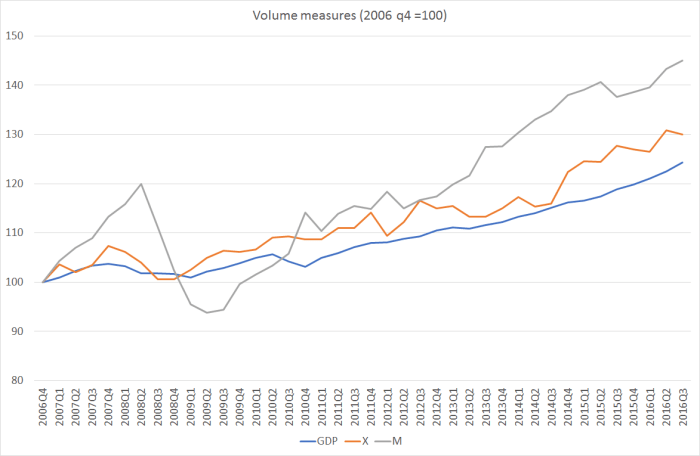
Looking back at that first chart, the weak and almost dead-flat business investment line was reminiscent of the productivity chart I showed yesterday.  It is also consistent with the weak export performance I wrote about last week.  The three indicators are causally related: business operating in, or which might have contemplated entering, the tradables sector, and thus taking on the world, simply haven’t been able to find sufficient attractive and remunerative opportunities.

The pressures associated with post-earthquake rebuild expenditure will wane, and probably already are.  But meanwhile, policy continues, year in and year out, to supercharge our rate of population growth, bringing in huge numbers of modestly skilled people, to a location where the successful opportunities for firms to take on the world with great products and services seem to be growing much more slowly than the number of people living here.  The flawed policy –  shared across both main parties and several of the minor ones –  just keeps making it harder than it needs to be for New Zealanders as a whole to get ahead.   Our immigration policy was crazy when lots of New Zealanders were leaving each year, but it is even more deeply problematic when the travails of Australia’s labour market mean that the outflow has (probably temporarily) largely ceased.


Mr Joyce tries to defend New Zealand’s export record

Alex Tarrant, at interest.co.nz, has done a couple of interesting interviews, one each with the current Minister of Finance, Steven Joyce, and with the man who would replace him, Labour’s Grant Robertson.     There are various things in each interview that I might comment on in the next few days –  including in particular Robertson’s comments on his plans re the Reserve Bank.

In the interview with Joyce, this blog even got a mention, as the Minister was forced to concede that five years of no productivity growth (at least as measured at present) might perhaps be something that should be taken seriously.

“Productivity has been a struggle everywhere. If you look across the eight years – and let’s be clear, these people that talk about productivity measures over a year, they’re really…”
I cut in: former Reserve Bank economist, and Croaking Cassandra blogger Michael Reddell’s talking about the last five years, when productivity growth has been negative by most measures.
“Five years is getting more like it,” he accepts. “The thing about measuring productivity is it’s generally measured more effectively a couple of years after the fact, which is very frustrating for those us who are focussed on it,” he said.

So now, apparently, we are reduced to just hoping that the last few years’ data end up revised away?  Maybe……

But today I wanted to focus on Joyce’s comments around the New Zealand export performance and the government’s export target, partly because on this occasion he has articulated his perspective more fully than I’ve seen previously.     Here is the heart of that section of the interview

I ended by putting a couple of numbers to Joyce – one was on the goal to increase exports as a proportion of GDP from 30% to 40% by 2025. It hasn’t shifted from 29% since 2008. Is he disappointed?
“I’d like to see more growth in that.” He couldn’t really have said much else. “But you have to go and look at what’s been happening under the hood. And under the hood, world trade intensity has dropped.
“So, if you look at New Zealand relative to say, your Singapores, your Denmarks or so on, which are the big traders, they’ve gone back a bit, because we’ve had an extended period of a decline in world trade,” he says.
“We’ve held our own. Again, it’s nothing to write home about necessarily, except that we haven’t slipped back the way other countries have.”
Another thing New Zealand had been dealing with was our biggest export had been “down a bit of a hole over the last two or three years,” Joyce said (about dairy).

Actually, Tarrant’s introduction is a bit generous.   Exports as a share of GDP in New Zealand were 29.2 per cent in the year to March 2008, rose quite a bit when the exchange rate plummeted in the following year, but were down to 26.7 per cent in the year to March 2017.  The last time the export share was lower than that was 1990.

exports 1

What of the Minister’s claim about what’s gone on in the rest of the world?   It isn’t entirely clear how relevant it is to New Zealand anyway, given that the government has set, and regularly updated, the New Zealand target, including in the Business Growth Agenda refreshes as recently as this year.  But set that to one side for the moment.  What do the data show, and how do we compare?

For the whole world, the best source of data is the World Bank.  Often it is only available with a bit of a lag.

exports 2.png

For the world as a whole, exports as a share of GDP have indeed dropped slightly since 2007 or 2008.  But that is very largely a China story –  after a couple of decades of very strong export-led growth, the story of China in the years since the 2008/09 recession has been a domestic credit and infrastructure phase.  The foreign trade share of GDP has fallen back a long way –  and is probably still above what would expect in the long-term for a country the size of China.    For high income countries (a World Bank category) exports haven’t grown markedly as a share of GDP, but they have grown.  Of the Minister’s other examples, Singapore’s export share is very high and quite volatile, and has fallen back somewhat  –  as I illustrated in a post a few months ago, they’ve had a huge increase in their real exchange rate –  but Denmark’s hasn’t.

The usual group we compare New Zealand against is the other advanced economies in the OECD.   Here is how New Zealand has done relative to the median OECD country.

exports 3.png

The shifts aren’t dramatic but (a) we’ve done less well than them, and (b) we were the country whose government set a target for a dramatic change.

If we use calendar year 2007 as a reference point (the last full year before the recession), there are a few countries whose (nominal) export share of GDP has dropped by materially more than New Zealand’s.  They are Chile, Israel, and Norway.   Of them, Chile and Norway have experienced very substantial falls in their terms of trade –  sustained falls in copper and oil prices.    By contrast, New Zealand(despite the ups and downs in dairy prices) and Israel have had the largest increases in the terms of trade of any OECD country over that (almost) decade.  All else equal, a rising terms of trade should have tended to lift a country’s export share of GDP relative to those in other countries (matched, in time, by a higher import share of GDP, as the proceeds of the better prices are spent).

All of these numbers to date have been measures of the nominal value of exports relative to nominal GDP.  The government has expressed its export target in terms of volumes.  As I’ve noted before, ratios of real variables don’t make a lot of sense, and Statistics New Zealand advises against using them.   But one way of looking at volumes that does make some sense is to compare the volume growth of exports to the volume growth of GDP over a reasonable period.  In this case, I’ll look at the most recent year (to March 2017) relative to that last pre-recession year, calendar 2007.

In this chart I have calculated the total percentage growth in the volume of exports since 2007 and substracted from that the total percentage growth in real GDP over that same period.  (It might be more proper to do this multiplicatively, but I’ve checked and it doesn’t change the rankings.)

exports 4

There are OECD countries that have had a weaker relative export volume performance than New Zealand over this period, but not many.  And the median country’s experience is very different than ours has been.  And that is even with all those subsidised additional education exports and (as the Opposition parties might note) additional unpriced water pollution and methane emissions associated with the growth in agricultural exports.

Recall too that the whole logic behind the government’s export target was about closing some of those income and productivity gaps to the rest of the advanced world.  As Mr Joyce noted elsewhere in that same interview “productivity has been a 30 to 40-year issue for New Zealand” (longer than that actually).    One of the ways in which sustainable success of an economy tends to manifest is in the ability of firms based in a country to sell more stuff successfully abroad, enabling us to purchase more stuff from them.

In a post the other day, I highlighted our experience relative to a bunch of other countries that had been setting out to catch up, eight (now) fairly-advanced central and eastern European former communist countries.

Here is how (nominal) exports as a share of GDP have done in New Zealand and in those countries since 2007.

exports 5

and here is a chart showing the gap between the growth rate of export volumes and the growth rate of real GDP (again, latest 12 months compared to calendar 2007).

exports 6

And, drawing this towards a close, in case anyone was hoping (against hope) that the services sector might provide a more encouraging export story (death of distance as technology advances etc) here is the chart of how services exports as a share of GDP have done.

exports 7.png

But no.

Were I trying to make a case for the defence, I would highlight two relevant considerations that Steven Joyce didn’t mention:

  • first, the impact of the Canterbury earthquakes.  Real resources have had to be used for the repair and rebuild process that simply couldn’t be used elsewhere (eg to build export industries), particularly as much of the cost was covered by offshore reinsurance (which gave people cash, but not more real resources to do the rebuilding with).  As that phase passes, resources will be freed up and we might expect them to flow back towards the tradable sectors of the economy,
  • second, the unexpected sharp and persistent reduction in interest rates which (for a country with a large private external debt) represented a considerable windfall.  We have been able to consume more without having to produce (or export) more.  It is a windfall, but in the longer-run it is no substitute for a policy climate that supports productivity growth and the growth in both the export and import share of our economy.

And, on the other hand, you might have noticed that I mentioned earlier that Israel had been somewhat like us.  Exports as a share of GDP had fallen further than in New Zealand, and the terms of trade had increased over the last decade by about as much as New Zealand’s had.   The other thing that constantly marks out Israel is the rate of population growth, from a mix of high (but falling) birth rates and high rates of immigration.    Israel’s population has increased by just over 20 per cent since 2007  (New Zealand’s population has increased quite rapidly by international standard, but “only” by about 12 per cent).

Just like the earthquake story, real resources required to build the considerable infrastructure (houses, road, offices, factories, schools etc) associated with a rapidly growing population aren’t available for growing other industries.  In New Zealand’s case that rationing process works through a persistently high real exchange rate and real interest rates persistently high relative to other advanced countries.   I’ve written previously about Israel’s underwhelming long-term productivity performance, and suggest that, as with New Zealand, rapid population growth in an unpropitious location, has made it hard for firms based in either country to take on the world (economicially) and succeed.   The experience of recent years –  remember, no productivity growth at all in New Zealand for five years now – looks like another straw in the wind in support of that suggestion.

Relative to the government’s target, export performance in New Zealand has been poor.  Relative to other advanced countries, it has also been poor.  And all that notwithstanding very favourable terms of trade.   Exports aren’t everything by any means, but the only OECD country in the last decade that has had a worse overall export performance than New Zealand and had a good terms of trade has been the one advanced country with a consistently faster rate of population growth.   Export volumes have grown quite a lot in the last decade – just over 20 per cent –  but they’ve barely kept up with overall GDP growth (in most countries, there has been much more export volume growth), and even then only through new subsidies (export education) and unpriced environmental externalities.  It is a flawed strategy.  And it is an unsustainable one.


Treasury not convinced about the economic strategy?

Or so it would seem from looking at the forecast tables accompanying today’s PREFU.

Recall that the government has long had a goal of materially increasing the share of New Zealand’s GDP accounted for by exports (with, presumably, a more or less matching increase in imports).  As I’ve highlighted on various occasions –  yesterday most recently – if anything the actual export share of GDP has been shrinking.

Here is the share of exports in GDP, showing actuals for the last decade or so, and Treasury’s projections for the next few years.

x to gdp

By the end of that forecast period, there will only be four more years until the goal of a much-increased export share of GDP was to be met.  On these numbers, exports as a share of GDP would by then be at their lowest since 1989, 32 years earlier.  So much for a more open globalising economy.

(The government actually specifies their target as the ratio of real exports to real GDP, while this chart is nominal exports to nominal GDP.    Statisticians generally advise against using the real formulation.  But on this occasion, it doesn’t make much difference either way.    Over the five forecast years, the volume of exports is forecast to rise by 10.8 per cent, and real GDP is forecast to rise by 15.6 per cent.   Whichever way you look at it, The Treasury expects the export share of the economy to carry on shrinking over the next few years.)

In many respects that isn’t very surprising.  Treasury expects no fall in the exchange rate at all over the period, and they expect rapid increases in the OCR from around the end of next year.  And they expect continued rapid population growth.

It is a non-tradables skewed economy, and while there is nothing intrinsically wrong with non-tradables, it isn’t usually a successful path for countries seeking to achieve higher productivity and sustained national prosperity.    (Although Treasury does forecast that six years of zero productivity growth will finally come to an end, and we’ll have respectable productivity growth from 2019 onwards.  What this is based on, who knows.  We can hope I suppose.)


Economic performance

The second half of the Grant Robertson/Steven Joyce debate on Sunday was around things to do with overall economic performance and management.

On one thing they agreed: Winston Peters’ proposal that New Zealand should adopt a Singapore-style approach to monetary policy and the exchange rate isn’t an option for New Zealand.  I agree with them, and explained why in a post a few months ago.

Grant Robertson reminded viewers that John Key had promised to close the gaps between New Zealand incomes and productivity and those in Australia, noting that no progress has actually been made.   Steven Joyce likes to push-back by citing numbers that suggest that after-tax real wages have been rising faster here than in Australia.    When I’ve looked at that claim previously, a lot appeared to depend on which exchange rate one used to convert wages in the two countries into a common currency.  Using PPP exchange rates, the gap has actually widened a bit further.    Comparing wage series across countries isn’t that easy –  countries measure things differently, and things that are effectively part of remuneration (eg employer superannuation contributions) often aren’t included.

Personally, I prefer to focus on economywide measures, which are compiled in a consistent manner across countries.   Here is real GDP per capita for the two countries, indexed to 2007q4, just before the global downturn/recession began.

real gdp pc nz and aus

I could have started the chart a few quarters later, to coincide with the change of government.  Either way, no progress at all has been made in closing the gap to Australia.

Things look worse if we focus on labour productivity (real GDP per hour worked).

real gdp phw nz and aus aug 16

Best summary?  We haven’t lost much ground against Australia when we focus on GDP per capita, but since relative productivity has dropped away badly we’ve only maintained even that mediocre real GDP per capita record by working even longer hours on average.

But if the government’s record is pretty poor, it isn’t clear that the Labour Party is offering anything much different.   It is all very well to criticise the current government for making no progress in closing the gaps, but Labour doesn’t even seem to be talking about doing so.    Robertson did highlight the four or five years now of zero productivity growth, and talked of needing a plan for something different.  But it wasn’t obvious from anything he said, or anything I’ve read, quite what the plan is, that might be equal to the challenge.   There is plenty of talk of lifting skills –  but the OECD data already suggest New Zealand skills levels are among the very highest among advanced countries.    There is talk of a tax working group, with an apparent presumption that that is likely to lead to a capital gains tax.  And there is talk of R&D tax credits.  But I doubt anyone –  even those who support such measures – believes that they are remotely enough to make the sort of difference closing the gaps to Australia might involve.

Of course, the National Party’s position seems no better.  The Minister’s rhetoric is that people are voting with their feet and realising that the jobs and incomes are now here.  Sure, the annual outflow of New Zealanders to Australia has dropped, but it is still an outflow each and every year.   And no one seriously thinks other than that average incomes in Australia remain much higher than those here.  But it is tougher to get established in Australia at present –  that’s a bad thing for New Zealanders, not a good one.

Steven Joyce was touting the success of certain subsets of firms exporting from New Zealand.  It is perhaps easy to forget that the government has long had a goal of substantially increasing the export share of GDP (and, presumably, the import share, since we export to import –  sell stuff to other people so that we can consume ourselves).

Here are exports as a share of GDP.

exports joyce 
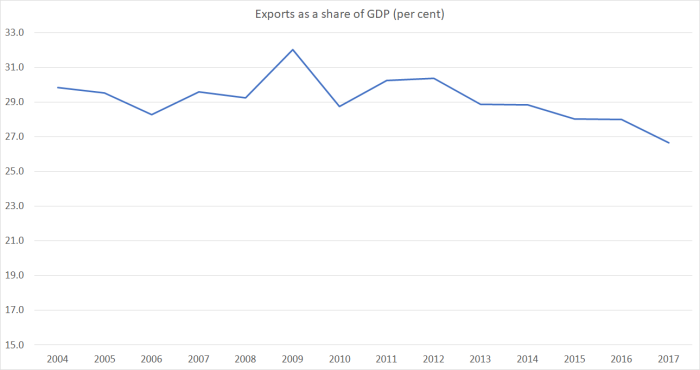
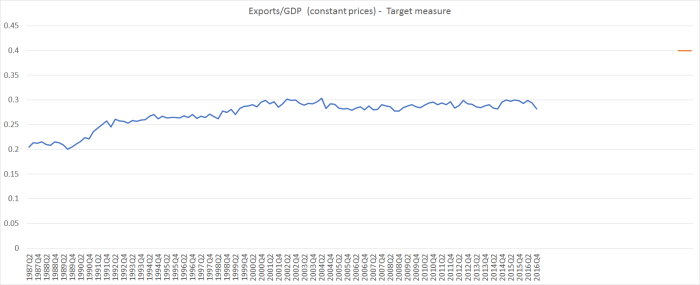
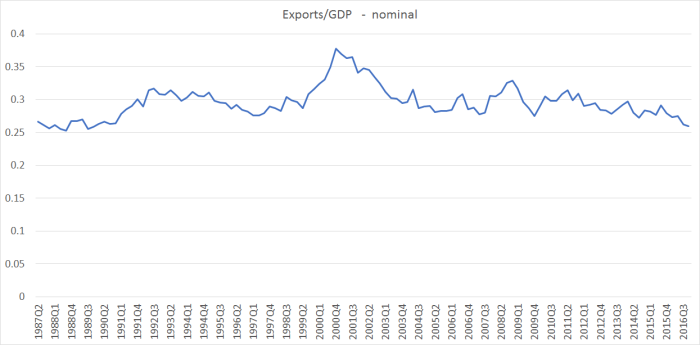
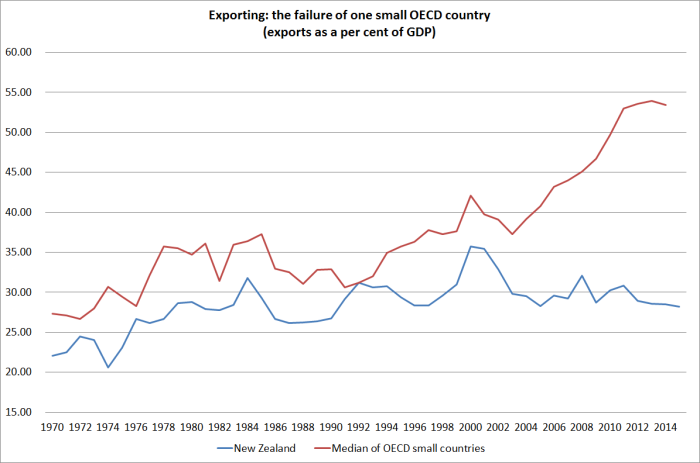
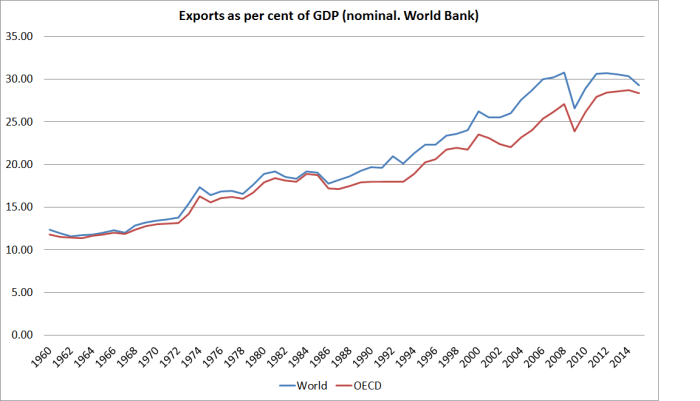
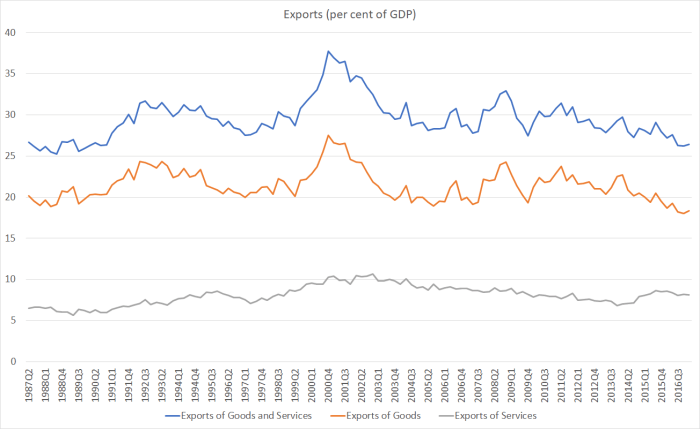
It is easy for one’s eye to go to those peaks in 2000 –  at a time when the exchange rate had fallen sharply – but even much more recently the trends haven’t been favourable.  Even the vaunted services exports are lower now as a share of GDP than they were 10 years ago, or than when the government came to power.   The Minister talked of “high-tech value-added manufacturing” as the future, but then overall goods exports are lower as a share of GDP now than at any time in the last 30 years.

Mr Joyce talked of a slump in global trade, as if our experience was just something like everyone else had experienced.  But even that isn’t true.     The share of exports in GDP for the median OECD country has increased by around 5 percentage points in the last decade.  In that decade before that, it increased by about 6 percentage points.

And for all the talk of services exports, here are exports of services as a per cent of GDP for New Zealand and the other small OECD countries.

services x small countries

Grant Robertson was prepared to go as far as to say that the exchange rate is “too high”.  Artificially lowering it wasn’t, we were told, the answer (and I’d agree, if by that he meant eg a Singapore-style monetary policy).  But there was no hint of how Labour thought a lower exchange rate might be brought about in a more sustainable manner.

New Zealand has faced some obstacles to growing the tradables sector of our economy in the last decade.  The earthquakes meant that real resources had to be used for other things –  repair and rebuild –  and other activities had to make room.  Policymakers have known this since the very days after the earthquakes occurrred.  The substantial amount of offshore reinsurance just reinforced the way in which the earthquakes represented a large shock skewing the economy for a time more towards the non-tradables sectors.

But what was extraordinary is that the same policymakers allowed, and cheered on, another even bigger non-tradables-skewing shock.

Here is a chart showing cumulative population growth since National took office, and the cumulative inflow of non-citizens (the PLT data, with all their pitfalls).

popn and immigration

We’ve had a 510000 increase in population over the term of this government, 421000 of which is accounted for by the net inflow of non-citizens.    The fertility and migration choices of New Zealanders would, all else equal, have given us only around 2 per cent population growth over the eight and half years, putting a great deal less pressure on

  • housing markets
  • other infrastructure
  • the physical environment, and
  • the tradables sector as a whole.

Remember that each new arrival need a lot more physical capital stock than is accounted for by the labour those people supply early on.   Policy has been deliberately skewing our economy away from the tradables sector.    We’ve had a net non-citizen migration inflow of almost exactly 300000 people in just the last five years.   With no productivity growth at all in that time, and an export (and import) sector shrinking as a share of GDP, and business investment pretty subdued too, one might reasonably ask ‘to what end?’ for New Zealanders.

We should be left wondering why, if we vote for them, either main party expects anything different than the mediocre economic performance of the last few years.   Gareth Morgan criticised Labour’s apparent lack of much policy substance  as “putting lipstick on a pig”.  It isn’t obvious that the National Party is even offering the lipstick.

And all this is without even repeating for the umpteenth time that the unemployment rate now is still higher than it was at any time in the last five years of the previous Labour government, at a time when demographics appear to be lowering the natural rate of unemployment.  Or the underutilisation rate of almost 12 per cent.      We should be able to do a great deal better for New Zealanders.


Exports, as seen from the 2009 Budget

I was exchanging notes with someone earlier this afternoon about how the government has lapsed into blather and “making it up” in so many areas.  I was pointing out how doubly sad it was because when the government had first taken the office, the then Minister of Finance –  now Prime Minister –  seemed to have a real concern about some of serious underlying imbalances and indicators of underperformance.  I used to help provide material to his office in support of that.

It is hard to track down old ministerial speeches that far back.  But take the 2009 Budget speech as just one example.  The Minister of Finance said

Indeed export volumes have on average grown by less than 2 per cent annually over the past five years. It has been hard being an exporter in recent times.

noting that

in the long term New Zealand must balance its economy in favour of more investment and jobs in internationally competitive industries.

So how has New Zealand done since?

English on exports

The Minister delivered this speech in May 2009, so presumably the latest data he had available was that to December 2008 (right at the worst of the recession).  In the five years to December 2008, export volumes had indeed –  even with subsequent data revisions –  increased by a bit under 2 per cent per annum.

Export growth had certainly been falling away quite sharply over the previous few years, and those peak growth rates from the five years to 1995 (almost 8 per cent) and to 2003 (almost 6 per cent) were distant memories.  But perhaps a fairer benchmark might not be growth rates to the depth of the severe recession, but perhaps in the five years to the end of the boom.  That seems doubly so because the Minister was arguing that the boom had been severely unbalanced, an opportunity wasted etc.  In the five years to December 2007 (the last pre-recession quarter) export volumes had grown at an average annual rate of 2.7 per cent.

And how are things now?   In his Budget last week, the new Minister of Finance asserted that

Under the Government’s strong economic leadership, New Zealand is shaping globalisation to its advantage.  We’ve embraced increased trade, new technologies, innovation and investment.

In the last five years, export volumes have grown at an annual average rate of 2.83 per cent.   It is a little better than those five years to December 2007.   But if 2.7 per cent annual growth was unsatisfactory, it must be hard to regard 2.83 per cent with equanimity.   Average export growth rates have been much lower under this government than under its predecessor.    Not exactly “shaping globalisation to our advantage……embraced increased trade”.

Now, of course, exports aren’t everything, and we only export so that we can import.  But it is a pretty meagre result.  At least back in 2009, the government could face the challenges squarely (they happened on someone else’s watch).   By now, eight years on, all they seem to have left is falling back on rhetoric, and hoping no one notices the data.

As the (now) Prime Minister noted in 2009, it had been “hard to be an exporter in recent times”.  The real exchange rate had increased a lot during those boom years.    In his 2009 Budget speech the Minister was welcoming the sharp fall in the exchange rate.  Unfortunately –  given the lack of sustained productivity growth to match –  that proved rather fleeting, and it has averaged just as high in the last seven years or so, as it did in the last few years of the previous government’s term.

rer
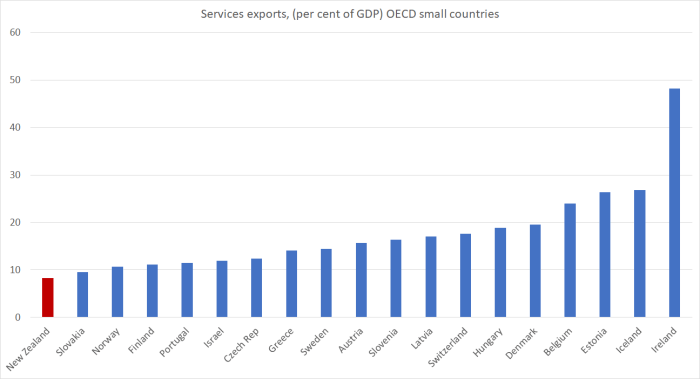
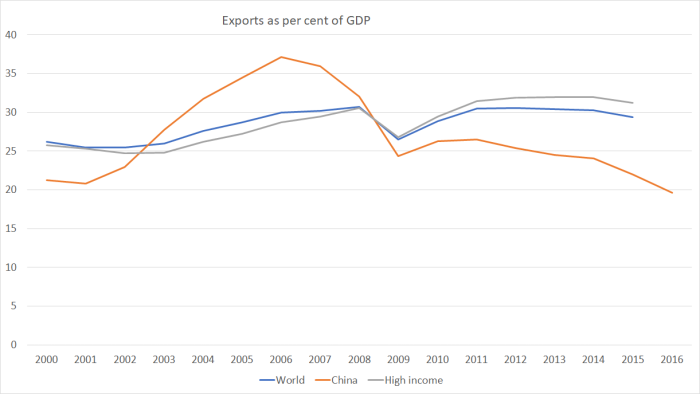
Real exchange rates aren’t things that ministers or governors directly control.  They reflect the balance of (tradables vs non-tradables) forces in the economy.  That balance here –  still –  makes it hard to manage much export volume growth from New Zealand.


Still going nowhere: the government’s exports target

The government’s target for a substantial increase by 2025 in the share of exports in GDP has been something of a hobby-horse issue of mine.  I’m sure it was well-intentioned (the thinking behind it probably recognises that successful economies, catching up with the most highly productive countries, typically experience a more rapid increase in exports than in GDP as a whole).  It isn’t that exports are special, just that (among other things) one measure of the success of one’s firms/industries is the ability to sell more and better stuff on the (much larger) wider world market.  That, in turn, enables us to import lots (more) of stuff from the rest of the world.

In parliamentary questions earlier in the week (number 8 here), Labour’s Finance spokesperson Grant Robertson was asking the Minister of Finance about that export goal, now expressed as aiming for real exports as a share of real GDP to get to 40 per cent by 2025.   Unfortunately, the government’s record on this item is so poor that one could almost feel sorry for the Minister, except that he devised the target and has repeatedly championed it.   He has also been the man behind such questionable “export subsidies” as the amped-up assistance to the film industry, and the large scale pursuit of foreign students attracted not so much by the excellence of our institutions as by the work and potential residence opportunities dangled in front of prospective students.   Export subsidies are just a bad idea, but export targets increase the risk of being tempted by such bad policies.

Statisticians (including those at Statistics New Zealand) advise against using ratios of real variables over long periods of time.  I know why the government and MBIE do it for exports (it abstracts from the direct effects of fluctuations in export prices and in the exchange rate), but it still isn’t really kosher.   Nonetheless, that is how they’ve expressed their target.    And here is the data, all the way back to 1987, and with the target level for 2025 highlighted in orange.

exports to GDP april 17

In his answer in Parliament, the Minister noted that the export share had been “remarkably stable for the last 10 or 12 years”.  Actually, make that more like 16 years.

Now somewhat oddly, in his answer the Minister of Finance kept referring to the recent drop in dairy export receipts as some sort of mitigating factor.    But that has been largely a result of the drop in prices, and the main reason for using the real exports to real GDP measure in the first place was to focus on volumes and abstract from the influence of fluctuations in global prices.   The drop in dairy prices is, for these purposes, simply irrelevant.

Incidentally, within that real exports measure we can break out the data on exports of services.  Between the political rhetoric around foreign students and tourism recently one might have supposed those bits would have been doing well.  And we are often told that “weightless” services exports are part of the way of the future.  But here are real services exports as a share of real GDP.

services exports apr 17

There was a bit of a pick-up a couple of years ago, but the current level is around a level first reached in 1995.

As the statisticians recommend, I prefer to look at ratios of nominal exports to nominal GDP.  There are no deflator problems, just the straight dollar value of what is exported from New Zealand and the dollar value of New Zealand’s GDP.  The trade-off is that there is bit more noise in the series.   Since neither series is mechanically controllable or even directly targetable in a market economy, I don’t think it is much of a loss.  Here is the chart of nominal exports to nominal GDP, again back to 1987.

exports to GDP nominal

Here the fall in global dairy prices does matter, but even then not in a straightforward way. After all, all else equal, when the price of our largest export falls one might expect the exchange rate to fall.   On this measure –  the simplest measure –  exports as a share of GDP are at a level not seen since the very last quarter of the 1980s.  A generation ago.

The Minister of Finance was also at pains to point out that over the last decade or so the pace of growth in world trade has slowed, and that is true (although a significant part of that has been the rebalancing of China’s economy).    So perhaps no one would hold it against him if the progress towards his own 2025 target –  now, as he notes, only eight years away –  was lagging a bit behind expectations.  But on his preferred measure there has been no progress at all.  On the better, if a little more volatile, measure things have been going backwards.     And yet this was the government that once had the ambition of closing the income and productivity gaps to Australia.

Australia provides an interesting comparison.  Here is the constant price ratio for them (the measure our government prefers for NZ),

aus exports to gdp.png

Historically, Australia had a materially lower export share of GDP than New Zealand – as one would expect in a larger country (where there is more scope for efficient profitable trade within national borders). And for a decade or so their real export share of GDP also went sideways, but for the last few years it has been rising again quite strongly.

They are also affected by changing commodity prices and exchange rates.  But here is the simple chart of nominal exports to nominal GDP.

aus exports to gdp nominal

It hasn’t been rising for some time.  But whereas our export share of GDP is back at 1989 levels, in 1989 Australian exports were about 15 per cent of GDP, now they are about 20 per cent.

That is the sort of change our government needed to be seeing (roughly a one third increase in the export share of GDP) if its 2025 exports target was to be met.   It looks exceedingly implausible at present.  There was no progress under the previous government, and has been none under the current government.  That strongly suggests something wrong with the policies both governments have been pursuing.

I like to think I’m an equal opportunity sceptic.  There is a little sign of the sorts of policies from the current government that will change this picture.  But while it is fine –  and no doubt fun –  to tease the Minister about the failure of his policies, we don’t yet know what policies, if any, Labour and the Greens will advance to have the economy change course, and shift to new higher levels of international trade.  Without something that does that, our prospects for closing sustainably any of the productivity or income gaps are slender to non-existent.

A dynamic and diversified export sector or “alternative facts”?

The Prime Minister went to Auckland yesterday, accompanied by his Deputy and his Minister of Finance, to deliver what is popularly billed as a “state of nation” address at the Auckland Rotary Club.   I’m staggered that the Prime Minister could give such an address in Auckland and not once mention that house price debacle that his government, and the previous Labour government, have presided over, and done little to address.

But the bit of the speech that caught my eye was this

I’m proud that on the other side of the globe from the European capitals I visited a few weeks ago, New Zealanders have built a cohesive and globally competitive country that can provide valuable lessons to the rest of the world.

In recent years, New Zealand has dealt with the biggest financial crisis since the Great Depression, we’ve dealt with devastating earthquakes and we’ve made significant progress on deep-seated social and Treaty issues.

We now have a dynamic and diversified export sector,

In particular the suggestion that we have “built a globally competitive country” and as a result we “now have a dynamic and diversified export sector”.  (I wasn’t too sure about the “valuable lessons” we can apparently offer to the rest of the world, but I’ll leave that aside for now.)

Statistics New Zealand typically advise that the best way to look at longer-term trends in components of the national accounts is to use ratios of the various nominal series.    Doing so avoids deflator problems, and also recognises that prices –  earned and paid –  matter.   Here is the chart showing exports –  and imports –  as a share of GDP.

exports-and-imports-over-gdp

Exports as a share of GDP are now below where they were when the Prime Minister was Minister of Finance/Treasurer in the last days of the Shipley government in the 1990s (and lower than at any time since then, under Labour or National governments).

In a thriving, globally competitive, economy one would more normally expect to see both exports and imports trending upwards as a share of GDP.  For small countries that is even more important than large countries.

Out of curiosity I did dig out the data on export and import volumes and how they’ve grown relative to GDP.  Here is the chart for the last decade.

x-and-m-volumes

Export volumes have certainly increased a little faster than real GDP has, and import volumes more so.  But if the value of what we sell to the world (and then buy from it) hasn’t increased as a share of GDP, it doesn’t look like a particularly impressive story.

And finally, here is the chart I run every so often, showing an estimate of GDP broken down between the tradables sector (primary plus manufacturing plus export of services) and the non-tradable sector (the rest).  And I’ve presented both series in real per capita terms.  It isn’t a perfect proxy by any means, but it tries to get at the idea that domestic production for domestic consumption –  especially in the manufacturing sector – is often exposed to global competition too.

t-and-nt-gdp-feb-17

In real per capita terms, this estimate of tradables sector GDP hasn’t grown in more than 15 years.  The current estimated level is lower than the average for the 2000 to 2007 pre-recession period.

The evidence for this economy being globally competitive is slim at best.  There are no doubt plenty of individual firms doing well, but it doesn’t add up to much, especially as the starting point –  the initial share of exports (or export value-added) in our economy –  was already so low for a country our size.

In part, firms seeking to export –  or produce locally in competition with imports –  have been battling uphill.  The TWI measure of the exchange rate is around 79 this morning –  on the Reserve Bank’s real exchange rate measure only around 5 per cent off the post-float peak.    High real exchange rates can be a welcome thing, when they result from rapid productivity growth and the growing success of New Zealand firms in international markets. The high exchange rate rate then helps share the gains around.  But that simply isn’t –  and hasn’t for a long time –  been the New Zealand story.

I’m not entirely sure why politicians come out and say this sort of stuff (“globally competitive”, “dynamic and diversified export sector”).  It is particularly sad coming from the Prime Minister, who in his early years as Minister of Finance used to make exactly the sorts of points I’ve made in this post in speeches up and down the country: he was particularly fond of a version of the tradables/non-tradables chart.  And the government has long had as one of its targets a material increase in the share of exports in GDP, suggesting that they knew there was something not quite right about New Zealand’s economic performance.

But now, almost nine years in, they seem reduced to simply making up lines like these, that perhaps might feel or sound good, so long as no one actually looks into them.  Doing so discredits the speaker, and perhaps as importantly it further cheapens and debases political dialogue and debate.  Bill English should be better than that.

Eden Park advertisers and the NZ tradables sector

My wife and son were watching the rugby test on Saturday evening but, not being overly interested in rugby, I started paying attention to the companies that were advertising at the ground.

All Blacks tests are one of the international showcases of New Zealand, with a substantial overseas broadcast audience.  And that particular test was against the Wallabies, and Australia is the largest export market for New Zealand firms’ goods and services.

I can’t be sure I jotted down all the advertisers: I was dependent on the camera angles Sky showed and I wasn’t paying rapt attention to every second of the game.

But these were the companies/brands whose adverts I thought I spotted:

AIG,  Adidas, American Express, Ford, Mobil, Asteron Life, DeWalt, Stihl, KitKat, Gatorade, Kia

Kennards, Owens, Resene, ASB, Pacific Build Supply, Bedpost, Barfoot and Thompson, Drymix, Rebel Sport, G.J. Gardner, Steinlager, Air New Zealand, Mainfreight and Zestel Gum (yes, I had to look up that one) and Auckland (Council or a CCO).

So I noted 26 advertisers.  One was a local government agency.  Of the remaining 25, 11 were overseas firms/brands, selling into the New Zealand market and in other countries.

It was the other group of firms/brands that interested me.  Of them, as far as I could tell only two were New Zealand based internationally-oriented firms: Air New Zealand, and Mainfreight (which now has substantial overseas operations).  And Air New Zealand, while currently very successful, collapsed only 15 years ago, remains majority state-owned, and one assumes its continuing independent status largely depends on the heavily regulated nature of the international airline and landing rights market.

I gather there are some reasonable substantial exports of Steinlager, but then Steinlager is a product/brand now produced by a Japanese-owned company.

Perhaps on another occasion a rather different mix of companies would have been advertising, and the New Zealand based ones might have been a more outward-oriented group.  But in microcosm, it did seem to capture something of the strangely-imbalanced New Zealand economy, struggling to make inroads in international markets or against international competition.

That phenomenon is nicely illustrated by my regular chart showing tradables and non-tradables components of GDP (recall that primary production and manufacturing, and exports of services make up “tradables” –  and the rest of GDP is non-tradables).  It is only a rough indicator, but it seems to have told quite sensible, intuitively plausible, stories.

T and NT GDP oct 16.png

In per capita terms, tradables sector GDP is still lower than it was on average in the first eight years of the 2000s (prior to the recession). In fact, the peak in the series was way back in 2004q2.  There has been no sustained growth in average per capita tradables sector production for 15 years.

That shouldn’t really be very surprising.  With able people and fairly good institutions, still the main thing New Zealand has going for it, as location for internationally-oriented businesses, is the natural resources that are here.  And when the population increases as rapidly as it has in the last 15 years, with no major new natural resources to tap, and with sustained upward pressure on the real exchange rate, it is hardly surprising that there has been so little (per capita) tradables sector growth.

Or so few successful outward-oriented New Zealand firms to advertise to the world from Eden Park.


Not a recommended way to raise the export share of GDP

Flicking through the World Bank data for the previous post, I noticed Greece.

greece-exports-to-gdp

A very substantial –  10 percentage point –  increase in the export share of GDP in just a few years.

Unfortunately, of course, almost all the action is in the denominator.

Here is real GDP for Greece –  not per capita.

greece-gdp

And here are real exports.

greece-exports

Domestic demand collapsed, and there just hasn’t been much real improvement in competitiveness (or probably policy certainty, of the sort that might encourage much new investment).

Boosting exports: the exchange rate really matters

I noticed the other day a short piece on Treasury’s blog, written by one of their very able analysts, Mario di Maio, headed “How to get an export take-off“.  It appeared to be prompted by the government’s now long-standing target to raise the export share of GDP by 10 to 15 percentage points by 2025.  As I’ve noted before, the general sentiment behind the goal is probably broadly sensible –  successful economics typically trade more (imports and exports) with the rest of the world.  After all, the rest of the world is where the bulk of potential customers/suppliers are.  Of course, the problem with this particular goal is that (a) it doesn’t look as though it is going to achieve itself (good bureaucratic technique can include setting goals for things that were likely to happen anyway, and then claim the credit when they do), and (b) the government is doing absolutely nothing to bring about the sort of transformation of the economy that might reasonably be expected to lift the export (and import) share of GDP.  It is an old line, but no less true, that it is pretty crazy to keep on doing the same old thing, and expecting a different result.   So perhaps they don’t really expect a different result….and perhaps they don’t even care greatly, as by 2025 no doubt the government will have changed, perhaps more than once, and Key, Joyce and English will be doing something else (as Clark and Cullen –  who had similar vague aspirations –  are now).

The Treasury note is worth reading. It takes a quick look at some countries (all now advanced) that have achieved a 10 percentage point increase  in 10 years in the export share of GDP over the last 50 years or so.  The author finds 14 such countries, and has a quick look for any common factors.  Perhaps not surprisingly –  in a note of three pages of text – he doesn’t find many.  Indeed, he goes so far as to conclude

The diversity of the case studies cautions against drawing simple policy lessons from other countries for any New Zealand strategy to lift trade intensity. The diversity of approaches and circumstances means any single policy (or policy mix) would be misleading.

Personally, without a lot more background analysis –  and perhaps Treasury has done the analysis but just not published it – that seems too strong a conclusion.  If one were uncharitable, it could be seen as tending to avoid the real issues that specifically help explain New Zealand’s underperformance.  But perhaps that wasn’t the intention at all, and all they really mean is that we have to think hard about the specifics of New Zealand, and not simply latch onto one or other favoured overseas country as an example. If so, I agree.

I’m not going to use this post to pick at specific points in the Treasury note, but wanted to come at a similar issue in a slightly different way.

But first, lets remember quite how underwhelming New Zealand’s international trade performance has been.  This is a chart I ran a few months ago, comparing New Zealand and other small OECD countries since 1970.

exports small countries

The foreign trade share of GDP has gone basically sideways for almost 40 years.  It is hard –  but not impossible –  to get ahead with a performance like that.

I usually use OECD data –  as in the chart above –  but the Treasury piece used the World Bank data, which has some advantages in capturing a wider range of countries.  For some countries, and aggregates, they also have data going a bit further back.

Here is the World Bank’s estimate of exports as a share of GDP, for the whole world and for the OECD, back to 1960.

exports-as-share-ofg-gdp-world

Over the 40 or so years when the export share of New Zealand’s GDP has barely changed, that for the OECD and the world as a whole has increased by between 10 and 15 percentage points.  The trend –  world, and advanced countries –  has been strongly upwards, and somehow we’ve managed to defy that trend.    Not all of that growth has been in export value-added, some has been the rise of global supply chains and the increased cross-border trade in componentry –  something that is never likely to be a feature of remote countries’ trade –  but that isn’t the bulk of the story by any means.

From the World Bank’s data, I picked out the advanced countries (OECD plus a few others), the emerging Asian countries, and Latin American countries (the latter mostly because they fascinate me, but also because they add a large number of countries that have underperformed for long periods).  The official New Zealand export data start in 1971, so I had a look at how the export shares of the countries I had data for had changed from 1971 to 1975 to 2011 to 2015.  Using five-yearly averages gets rid of some of the noise that arises from short-term exchange rate or commodity price fluctuations.  Data don’t go back that far for most of the former Communist countries of Eastern Europe, but I was still left with a sample of around 45 countries.

Over that period, New Zealand’s export share of GDP had increased by 5.9 percentage points.  Nine countries had had less growth in their export share than New Zealand.

Change in export share of GDP : 1971-75 to 2011-15  (percentage points)
Costa Rica 5.70
South Africa 5.00
Japan 4.80
Brazil 4.30
Guatemala 3.70
Israel 2.90
Norway 2.80
Colombia 2.50
El Salvador -3.50

Of those countries, only Norway could be counted as am unambiguous economic success story over that period.  All the others –  like New Zealand –  were underperformers at best.  One might make an exception for Japan –  until the late 1980s its economic performance was very strong – but then it is also worth remembering that at the start of the period exports as a share of GDP in Japan were only around 10 per cent of GDP (less than half of the export share in a small country like New Zealand).  Over the period since the early 1970s, Japan has increased the export share of GDP by almost 50 per cent (from around 10 per cent to around 15 per cent) while the increase from New Zealand has been only around 25 per cent.

The Norway experience is a reminder that a large export (and import) share of GDP is not a necessary conditions for a sustained acceleration in economic (and income) growth.  Then again, countries can’t count on discovering a huge new extremely valuable natural resource as a basis for improved prosperity.  Typically the path to prosperity involves firms finding products and services they can sell successfully to the rest of the world. We’ve failed on that count, and that shows no sign of changing.

Although Treasury seems to want to play down the importance of the real exchange rate, I think that in the New Zealand context it is much more important than they suggest.   One can never sensibly think of the real exchange rate is isolation from what else is going on in the economy.  A country with fast productivity growth might find that its export share of GDP is growing even as the real exchange rate is high or rising –  such is, say, the quality of the products or services firms in that country are selling.

But as everyone knows, New Zealand’s productivity performance over decades has been lousy, among the very worst in the advanced world.  Sure we have a few years from time to time when things don’t look too bad, but the multi-decade pattern of underperformance is clear and shows no sign of reversing.  Against that backdrop, it seems not just plausible –  but entirely reasonable –  to suggest that a real exchange rate that has been high or rising (rather than weak and falling) will, in the specific context of New Zealand, have been the main proximate contributor to the weak foreign trade performance (exports and imports).

I ran this chart recently.  It only goes back 20 years, but over longer periods the picture is much the same.  Our relative productivity performance deteriorated, but our exchange rate didn’t sustainably fall.

real exch rate

That sort of pattern typically happens only when some sort of domestic demand pressures keep holding up the real exchange rate (and domestic real interest rates).  In a country with a modest national savings rate, government policies that result in rapid population growth are an example of just such a pressure.   It is hard to foster an environment in which exporting is profitable/attractive when so much resource constantly needs to be devoted to meeting the (individually entirely reasonable) needs of a rapidly growing population.

Of course, “the exchange rate” can’t be fixed in isolation.  It is a symptom of what else has gone wrong with the policies of successive governments.  But like the old canary in a coal mine, the persistently strong exchange rate –  in a country of such persistently weak productivity growth –  is supposed to be a warning signal that something about economic policy is very wrong.

But why would we be surprised that nothing changes?  The Opposition appears to have no compelling analysis or ideas, and we have a government run by a Prime Minister who in a recent interview declared that

Where would chairing the UN Security Council rank in your career highlights?

Right up near the top

I guess when there have been eight years of no substantive economic reform, no progress in improving the relative performance of the New Zealand economy, no progress in reversing decades of relative economic decline –  just the pretence that somehow we are a global economic success story –  we shouldn’t be surprised that chairing an ineffective meeting of foreign officials and ministers, dealing with an intractable problem in a far-away land, counts as some sort of career highlight.

Young New Zealanders, facing unaffordable houses, and  the prospect of growing up in a country slowly drifting ever further behind, might perhaps have hoped for something rather more tangible rather closer to home.