Reflecting on Puerto Rico

For those not totally absorbed in the hour by hour machinations of Greek politics, another highly indebted area that has been getting attention this week is  the US territory of Puerto Rico.  The focus is on the debt, and Gillian Tett has a nice column in today’s FT on the complexities of trying to deal with that.

But the piece that got me more interested was a short post by Paul Krugman on the economic challenges of Puerto Rico.  Many probably disagree with Krugman on macro issues, and on politics, but issues around trade and economic geography are where he made his name.  He concludes:

But I’d argue for paying a lot of attention to the non-specific forces affecting the island, and in particular the economic geography side. Puerto Rico may to an important extent just suffer from being a slightly hard to reach island in a time when corporations place a high premium on easy, just-in-time shipments.

It got me thinking again about New Zealand and Australia.  Now, to be clear, I’m not suggesting that most of the parallels are close:

  • We have our own exchange rate, currency (and minimum wage).  Puerto Rico doesn’t.
  • And our public debt, while not low, is at pretty comfortable levels.  Issues of public debt unsustainability just don’t arise here.

But, on the other hand, we are a fairly small country, quite distant even from Australia.  We have a lot more land than Puerto Rico (but no warm winters) –  and have historically have had a land-based economy,  And no more land is being made.  We used to have a big manufacturing sector, but only when we built up huge and costly protective barriers that meant manufacturing here was the only way into the market.   If we had 10 million people we would still be small and remote.

For decades, tens of thousands of our fellow citizens have been leaving for what they perceive to be a better life, and better economic returns, in Australia.  The annual outflow fluctuates a lot, but over time the numbers mount up.  935000 New Zealand citizens (net) have left since 1970, mostly to Australia.  Even though I use these numbers often, every time I calculate totals like that the scale of the cumulative outflow still takes me aback.

Puerto Rico has been seeing outflows too, and the pace has stepped up in recent years. The most recent census was the first ever in which Puerto Rico’s population has fallen.  As Krugman notes, this is not necessarily a bad thing

Put it this way: if a region of the United States turns out to be a relatively bad location for production, we don’t expect the population to maintain itself by competing via ultra-low wages; we expect working-age residents to leave for more favorable places. That’s what you see in poor mainland states like West Virginia, which actually looks a fair bit like Puerto Rico in terms of low labor force participation, albeit not quite so much so. (Mississippi and Alabama also have low participation.)

And outmigration need not be such a terrible thing. There is much discussion of what’s wrong with Puerto Rico, but maybe we should, at least some of the time, just think of Puerto Rico as an ordinary region of the U.S.; at any given time, we expect some regions to be in relative and maybe even absolute decline, as the winds of technology and global trade shift. I wonder, in particular, whether Puerto Rico is suffering from the forces that seem to be leading to a general shortening of logistical chains and the “reshoring” of manufacturing to advanced economies.

We’ve had plenty of  towns/regions in New Zealand in which the population has fallen.  My usual examples are Taihape and Invercargill.  In one sense, emigration from those places is difficult for those left behind but, given the changes in relative economic opportunities, the departures are better (even for those left behind) than the alternative.  If everyone had just stayed in Invercargill or Taihape, even though the opportunities had moved away, the social and economic outcomes would almost certainly have been worse.  No one argues that as a matter of public policy we should aim to replace those who’ve left such towns.

But at a national level that is exactly what we have been doing in New Zealand for the last 25 years.  Rational economic agents –  our fellow New Zealanders –  respond to changing economic opportunities by moving to Australia.  Basic economics –  and plenty of formal literature on the great migrations of the 19th century –  suggests that those outflows will not only have benefited those who left, but will have contributed towards factor price equalisation – closing the gaps (but only somewhat ) between returns in New Zealand and Australia.  But central government, endued  with (or rather implicitly asserting) a superior sense of what is wise or right, stands in the way of that process of  factor price equalisation by bringing in yet even more people than the number who are leaving.  Having just come from one hubristic disaster –  Think Big –  we stumbled into thinking big on foreign immigration too.

They don’t do it in other countries.   Plenty of fast-growing successful countries have attracted large number of migrants, to take advantage of the opportunities (Singapore is a recent example, and Ireland –  after it had already become successful –  was another).    But countries that are aiming to catch-up with the rest of the advanced world don’t use inward migration as a means to that end.    It doesn’t work.  Ireland didn’t, the eastern European countries didn’t, and Korea and Taiwan didn’t.

Advocates of agglomerationist arguments will be spluttering by this point.  But there isn’t a lot of evidence for such effects in comparisons between countries.  Over 100 years big countries haven’t grown faster than small countries.  Indeed, many of the countries with the highest per capita incomes are resource-based economies with small populations.  I occasionally run  the line that perhaps the optimal population of New Zealand (if there such a thing) is either 2 million or 200 million.  At 200 million perhaps we’d be like Japan, albeit still facing a “distance tax”.  At 2 million we might be maximising the per capita value of our natural resources.  Would, for example, any fewer cows be being milked?

We aren’t going to have a population of 2 million or 200 million in my lifetime.  But if we pulled inward migration of non-New Zealanders back to around 1980s levels, we’d now have a slightly falling population.  We’d have a much better chance then of beginning to close the income and productivity gaps, of sustainably slowing the outflow of New Zealanders, and perhaps even in  time of attracting home again some of those 935000 New Zealanders who’ve already gone.    We’ll do that when, and if, we succeed.  We won’t help the prospects of success by simply importing more other people.
Brian Fallow covers my criticisms of the proposed new controls

In his weekly column in today’s Herald, Brian Fallow outlines and reviews some of the criticisms I have made of the Reserve Bank’s proposed Auckland investor property finance controls.   The accompanying cartoon (only part of which is online) shows pygmies attacking the giant Wheeler, secure in his moated castle.

Fallow’s piece is a very fair presentation of some of the arguments I have made, particularly in my LEANZ address last week (and he also notes the Treasury’s evident disquiet about the proposed controls).  I’m not going to repeat old material here, but will just highlight a couple of the points that arose in subsequent discussion.

Brian noted that Grant Spencer, the Bank’s Deputy Governor, has often argued that even though the stock of debt is not currently growing rapidly, there are a lot of new loans occurring and hence the risks are rising.  My response to that point is that, in normal times, there will always be lots of new loans, and lots of repayments going on.  It is great that the Bank is now collecting more detailed flow data that enables us to better see that breakdown.  But because we have no historical time series, we don’t have any good basis for interpreting it, and knowing what it might mean about risk.  In particular, as I noted, we don’t know what the pattern of new loans vs repayments was in the credit and housing boom of 2003 to 2007 when, for example, housing turnover was much higher (and from which episode, as a reminder, banks emerged unscathed).   That drives me back to the international empirical literature on crises, which suggests that big increases in the stock of debt (relative to GDP) over short periods of time has been one of the best indicators of building crisis risks.  Of course, historical empirical work is also limited by data availability, but at this stage with no material increase in debt to GDP ratios, and no sign of any material deterioration in lending standards, there doesn’t seem a basis for great concern about financial stability in New Zealand.

I have also suggested that the Bank should be doing more careful comparative research and analysis on the similarities and differences between New Zealand’s situation and those of countries that have had nasty housing busts (US, Spain ,and Ireland) and those that did not (UK, Canada, and Australia for example).  Brian posed the reasonable question as to whether people won’t just focus on the superficial similarities and differences, cherry-picking points of similarity or difference that suit their own argument.  That is a risk, but in a sense that is the point of doing research and analysis (for which the Bank has far more resources than any else in New Zealand), and making it available.  It enables informed debate to occur, and each piece of data or analysis is open to scrutiny and challenge.  The contest of ideas and evidence is a big part of  how we learn.

Fallow concludes his article thus:

A financial crisis is a low probability but high-cost event, as the Treasury says.  If you focus on the low probability, like Reddell, the conclusion is that the bank should pull its head in.  If you focus on the high potential cost, like Wheeler, you would want to do whatever you can to slow the growth in house prices and buy time to get more built and for the net inflow of migrants to return to more normal levels.

Maybe, but actually I suspect that misrepresents both Graeme and me.  Graeme Wheeler probably thinks the probability of something nasty happening in the New Zealand financial system in the next few years is higher than I do.  And I’m not just focused on the low probability of serious financial stresses.  That is the importance of stress tests.  They aren’t probability-based.  Instead, they take an extreme scenario (in the Bank’s stress tests, a tough but appropriate extreme scenario) and examines what happens to banks if the scenario happens.  On the evidence the Bank has presented so far, the soundness of the financial system is not jeopardised in such an extreme scenario.  Whatever Graeme Wheeler’s personal inclinations or feelings, a threat of that sort is the only statutory basis on which the Reserve Bank should be acting.

What the government does is, of course, another matter. I reckon it should be doing more about liberalising land use restrictions and, since large scale change in these restrictions seems unlikely, should probably reduce the very high target level of non-citizen immigration.

Criticism of the RB is “bizarre”

Reading the Herald over lunch, I found a column by Matthew Goodson, the head of a funds management company.   Authors don’t get to write the headlines, but I think the gist of Goodson’s piece is summed up here in his own words:

“Thank goodness that Graeme Wheeler and the RBNZ are beginning to pay attention to the issue.  It is simply bizarre that they are being criticised for being the one official institution to show some leadership and tentatively use their limited tools to lean against Auckland house prices.”

I assume that I’m one of those whose views are being described as “bizarre”.

But let’s step through Goodson’s argument:

First, he seems to suggest that critics of the Bank think house prices will never come down.  Perhaps there are some who believe that, but I’m quite happy to work with an assumption that some event, at some point, could lower Auckland house prices by 50 per cent.  Indeed, that is what the Reserve Bank assumed when they did their stress tests.  And the banks came through unscathed.  Goodson does not mention this work, which has been published by the Bank, and Graeme Wheeler has not engaged with it.  Perhaps it is wrong or seriously misleading –  I’m open to the possibility –  but let’s see the evidence and argumentation.

Second, Goodson rightly stresses the bad economic consequences that have at times followed from credit-fuelled asset price booms.  As he says, the post-1987 New Zealand equity and commercial property crash springs to mind.  But the operative word is “credit-fuelled”.    Credit is growing at around 5 per cent per annum, just a little faster than nominal GDP, right now.  But over the years since 2007 the ratio of credit to GDP has fallen, not risen.  Big increases in the ratio of debt to GDP over quite short periods of time have been one of the better indicators of future problems (but there have been plenty of “false positives” too).  We had those sorts of increases from 2002 to 2007.  We’ve had nothing similar since.

Third, Goodson invokes Spain and Ireland, and fails to mention that these were economies that had German interest rates during the boom when they needed something more like New Zealand ones, and when the construction boom burst –  and construction booms do much more damage than pure asset prices booms – they were still stuck with German interest rates, not something lower, and couldn’t adjust their nominal exchange rates either.  There are plenty of lessons from Spain and Ireland if New Zealand is ever thinking of adopting a common currency.  But otherwise not.

Fourth, Goodson does not mention that all his points could have been made, more compellingly, about New Zealand in 2007.  We’d had rapid rises in the prices of all types of assets, rapid growth in credit across all components of bank lending books, signs of material deterioration in credit quality around dairy loans, and probably commercial construction, and big corporate-finance loans as well.  And yet, the banking system came through unscathed.  If controls had been put on back then, would they still be on today, at what costs to individuals and to the efficiency of the financial system?

Fifth, Goodson does not engage with the provisions of the Reserve Bank Act.  Perhaps what Graeme Wheeler is doing is in some sense good for the country –  I doubt it, but let’s grant the possibility.  But Graeme is not the elected Minister of Finance, proposing legislation to a Parliament of elected members.  He is an unelected official, supposed to operate within the confines of a specific Act.  That Act requires him to use his banking regulatory powers to promote the soundness and efficiency of the financial system.  But his own stress tests tell him that the soundness of the banking system is not impaired –  and even if it were to be, the capital buffers in the system are much bigger than they were in, say, 2007.  And what of the adverse impact on the efficiency of the system?  Equally creditworthy borrowers in Auckland will not, by the coercive power of the state, be permitted to take a loan from a bank that they would be able to if they were in Wellington or Christchurch. And non-banks can make such loans in Auckland, but banks can’t. Where is the evidence that banks and borrowers are behaving so recklessly that they cannot safely be permitted to have a single cent of debt secured on investment property if the loan is above a 70 per cent LVR?  Goodson doesn’t present it, and neither has the Bank.  Build bigger capital buffers if you must –  they have much smaller efficiency costs, and  don’t directly come between willing borrowers and willing lenders.

Finally, Goodson observes that “the RBNZ’s tools need to be sharpened rather than tempered, with other countries providing plenty of evidence for the success or failure of tools such as stamp duty, removing the tax advantages of so-called investors, overseas investment restrictions, loan restrictions et al”. To which I would make two responses.  The first is to say “Really?”   I think the evidence of the impact these differences make to house prices is much less clear.  Tax regimes differ enormously around the world, and if ours offer unjustifiable advantages to anyone it is to unleveraged owner-occupiers, rather than those operating residential rental services businesses (“so-called investors”).

But perhaps more importantly, I hope he isn’t suggesting that such tools should be wielded by the Reserve Bank.  We live in a democracy, where key economic policy decisions should be taken by those whom we elect, and whom we can vote out.  Goodson alludes to Sir Robert Muldooon.   Some of Muldoon’s interventions were pretty damaging and unwise, but we voted him into office, and we could (and did) vote him out again.

As I’ve said previously, the sense that “something needs to be done” seems to be  leading to sense that “anything is something, so let’s welcome anything”, with no proper problem definition, no sense of what should properly be done by whom, and no sense of the risks and costs if the authorities have it wrong.    The Reserve Bank has an important role to play. It should be doing two things.  It should be continuing to refine its stress-testing exercises, and the risk-weighting models used by banks in their internal capital models, to ensure that the banks really can cope with a very nasty shock.  And beyond that should be using part of the significant research and analysis capability the taxpayer funds to produce rigorous and well-grounded papers identifying the real issues in the local housing (and housing finance) markets, reviewing the lesssons from countries that have, and have not, had banking crises related to their house prices booms, reviewing lessons from past interventions (successful and otherwise).  They might even develop (or commission) expertise in things like capital income taxation or urban planning regulations, to better be able to provide advice on the costs and benefits of action, or inaction.  Considered analysis of this sort, complementing that from core government departments, can provide a good foundation for political decision-makers to act, or not act.  But these are the sorts of instruments that, in a free society, only elected people should be deciding on.

Serious liberalisation of planning laws, and/or a reduction in the non-citizen target immigration level would be good places to start.  Both would, very belatedly, lower house and land prices, probably rather a lot.  But they would not threaten the soundness of our financial system..

Productivity growth worse than in Greece

In the interview with Richard Harman I noted that one of my main interests and (rather more importantly) one of the bigger challenges for New Zealand was its disappointing economic performance over the last 25 years.    The liberalisation of the economy in the 1980s and early 1990s was generally expected to have reversed the earlier decades of relative decline.  Not everyone shared that optimism, but among the advocates of reform within government and the public service, and among most international observers (for example, the IMF and OECD, and financial markets), that sort of re-convergence was generally expected.

But it didn’t happen.  For a while there was a “the cheque is in the mail” hypothesis doing the rounds –  it hadn’t happened yet, but it surely wasn’t far away.   But 25 years is a long time, and it just has not happened.  Around 1990, the former eastern-bloc countries started serious liberalisation.  Their economies had been much more heavily distorted than New Zealand’s (notwithstanding the Bob Jones crack in 1984 about the New Zealand economy resembling a Polish shipyard), but they have subsequently seen considerable convergence.

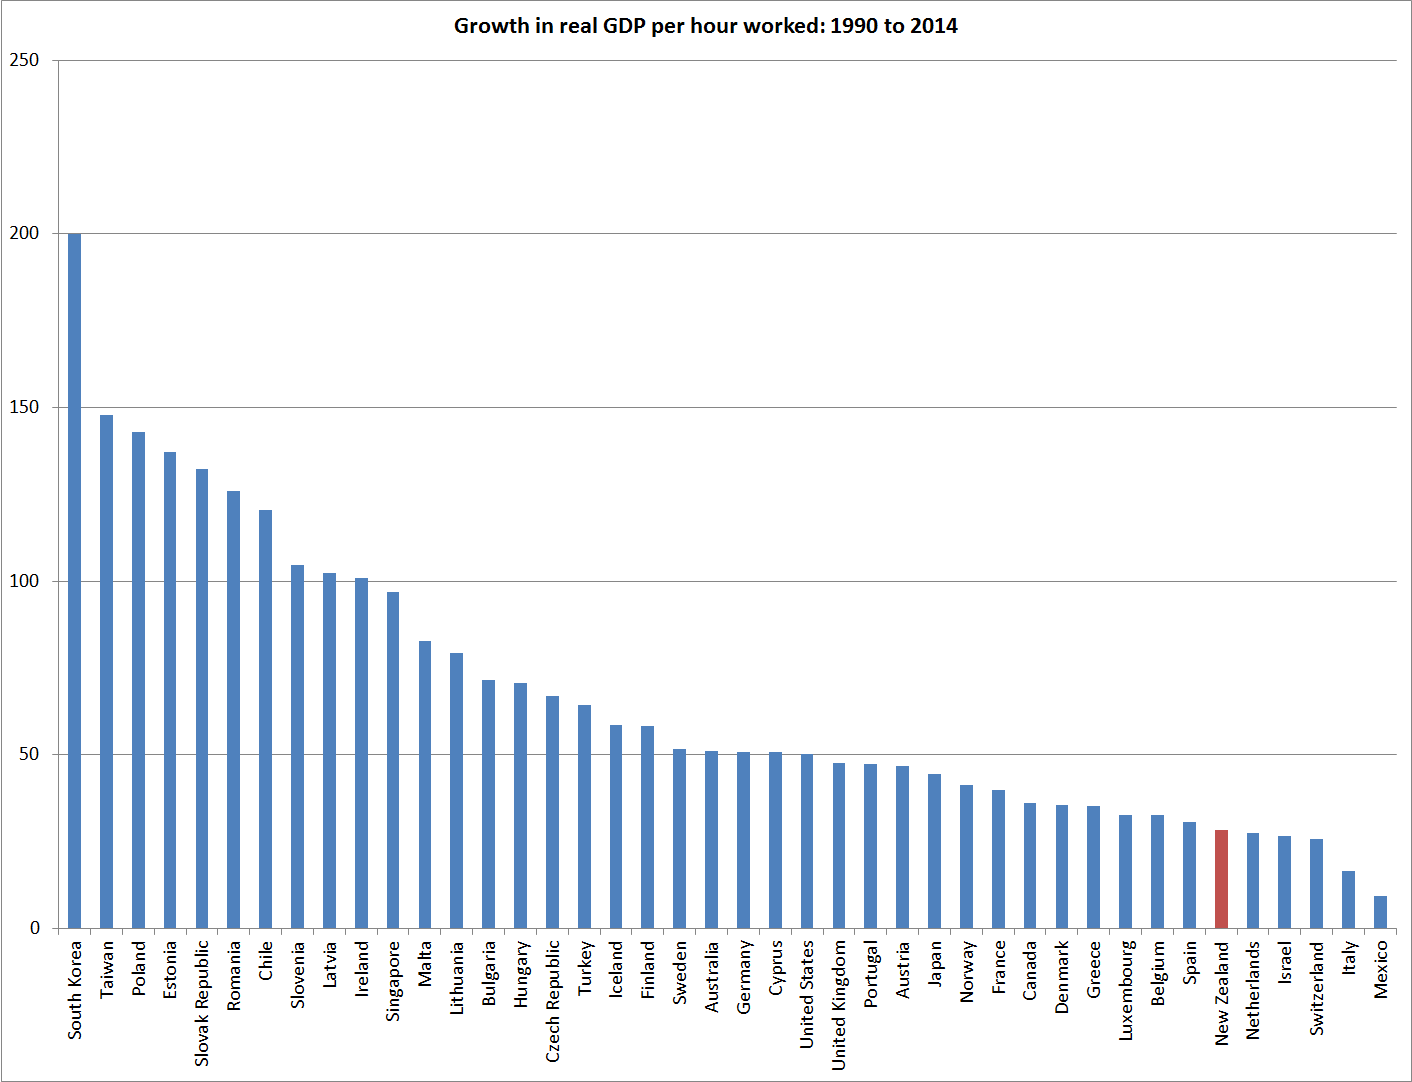
Here is my favourite summary chart of our underperformance over that period.  Using the Conference Board data, it is total growth in real GDP per hour worked for 42 advanced countries (OECD, EU, and Singapore and Taiwan) since 1990.  Only five countries had had slower growth over that period than New Zealand –  and two of them (Switzerland and the Netherlands) had had among the highest levels of labour productivity in any of these countries in 1990 (so one might have expected unspectacular growth subsequently).  No cross-country comparative measure is perfect, but I don’t this one is particularly unrepresentative of New Zealand’s relative performance  On this measure, Greece and Portugal have done less badly than us  (but recall that this is GDP per hour worked, and in the current Greek Depression total hours worked have dropped away precipitously).

GDPphw since 1990

I’ve been running a story about the role of immigration policy in explaining that failure to converge –  total GDP has grown a lot, even if GDP per hour worked hasn’t.  In this wider sample of countries, New Zealand has had among the faster rates of population growth, despite the huge outflow of New Zealanders (around 525,000)  over that period.   Singapore (86%) and Israel (77%) have had much faster rates of population growth than New Zealand (30%) over this period.

My argument has been that in a country with a low savings rate, rapid population growth has put considerable sustained upward pressure on real interest rates and the real exchange rate, squeezing the share of GDP devoted to business investment and preventing the emergence of new tradables sector firms/products at the rate that (a) convergence would have required, and (b) the rest of NZ’s microeconomic policy framework might have suggested/warranted.  A few weeks ago, I showed how our real exchange rate against Australia had failed to decline despite the deterioration in our relative economic performance over decades.

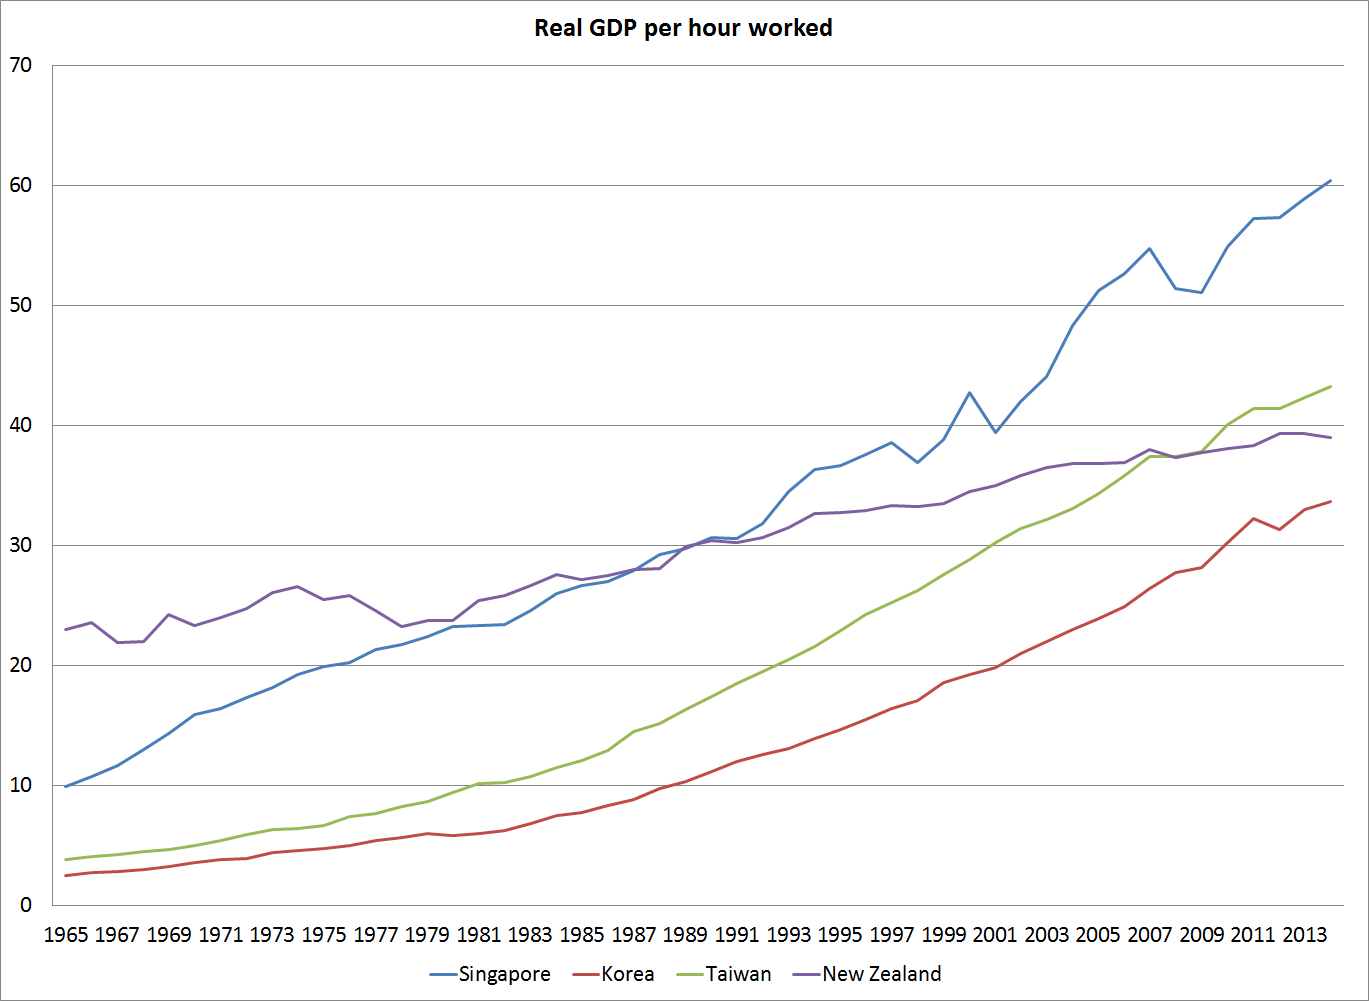
Here is another way of looking at the same point.  The two countries with the fastest growth in the chart above were Taiwan and Korea.  Singapore has also done impressively well.  In 1990, Taiwan and Korea were well behind New Zealand, and Singapore had about the same level of real GDP per hour worked as New Zealand  (precise comparisons depend on which set of relative prices are used, but on any measure all three countries have had growth outstripping that of New Zealand).

And here is the picture over 50 years, again using the Conference Board data
gdpphw asia
All three Asian countries have had some of the more dramatic catch-ups in productivity levels seen anywhere.  New Zealand, by contrast, in 1965 was among the advanced countries with the highest levels of labour productivity, and has been in relative decline since.

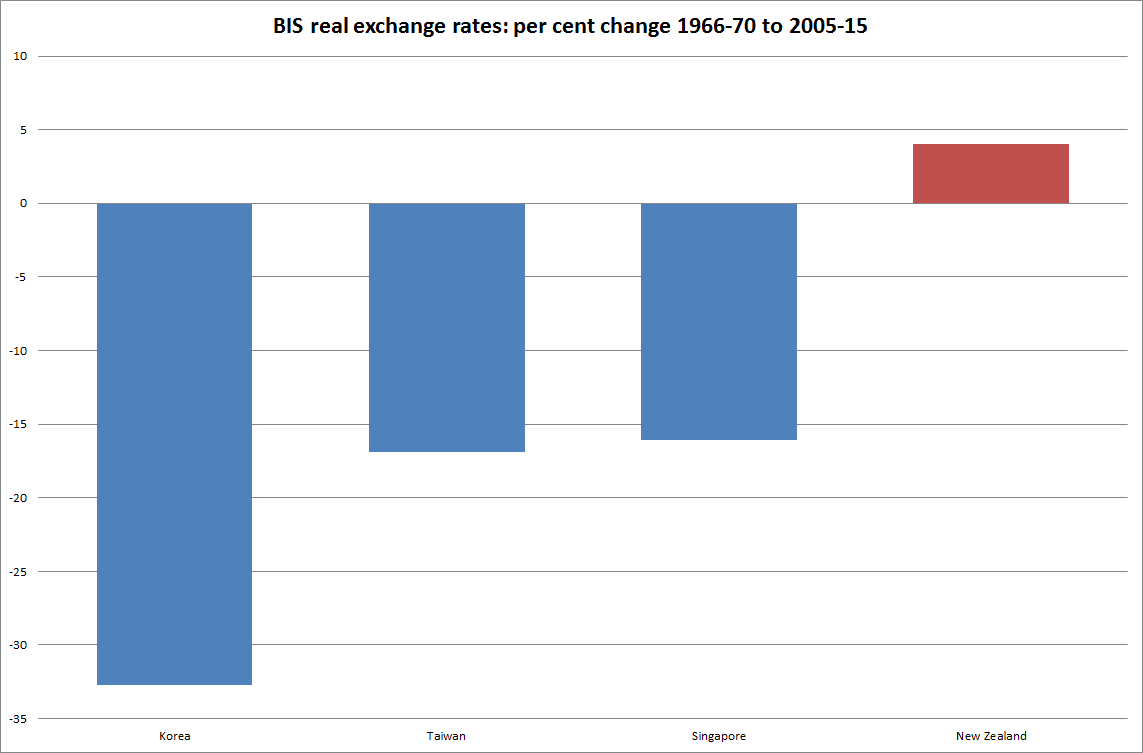
But what has happened to the countries’ real exchange rates since?  As ever, there is no unambiguous way to measure that, but the BIS have real exchange rate indexes for each of the four countries going back to the 1960s.  Of course, real exchange rates can move around a lot from year to year, so in this chart I’ve shown the percentage change in the real exchange rate from the average for 1966-70[1] to the average for the 10 years to May 2015.

bis rer asia

The countries that have had such dramatic productivity improvements have all recorded modest falls in their real exchange rates, and by contrast New Zealand has had an increase in its real exchange rate.  That is opposite of what one might initially have expected.  One might have expected a strong real appreciation in the Asian currencies (as has happened in Japan), as much higher incomes supported more and cheaper consumption in these countries.  Fewer resources now needed to be devoted to the tradables sectors in those countries.   And in New Zealand one might have expected the deteriorating productivity performance, and hence declining (relative) future consumption opportunities, to have been met by a declining real exchange rate. That would have increased the returns to productive investment in New Zealand –  helping to reverse the decline – and raised the relative price of consumption.

How does my story explain what went on?

In last 25 years, Korea and Taiwan have had materially slower population growth rates than New Zealand has, and much higher savings rates.  That meant both less pressure on resources simply to maintain the capital stock per person, and more domestic resources available to meet investment demand.  The net result: little upward pressure on real interest rates and the real exchange rate, despite the continuing productivity gains.

Singapore is at the extreme.  The national savings rate has averaged 46 per cent in Singapore over the last 25 years, roughly double the rate for advanced countries as a whole.  With so many resources available (earned but not consumed) even the investment needs of an average population growth rate of 2.5 per cent puts no pressure on domestic resources, or hence on real interest rates and the real exchange rate, despite the continuing productivity gains.

And that is my story in a nutshell: with very high saving rates your country might need lots more people to make the most of the savings.  But in a country with only a rather modest savings rate (for whatever reason) then having lots more people –  and especially bringing them in as a matter of policy – simply looks wrongheaded.  It undermines what policy is setting out to achieve.

It isn’t that migrants somehow “take away jobs”, but rather that rapid population growth (whether migrants or high birth rates) tends to divert resources (jobs) away from growing the bits of the economy that sell to the rest of world (a huge and diverse market, and probably where our future prosperity is to be found) to ensuring that the physical infrastructure (houses, roads, shops, factories, schools) keeps pace with the needs of the growing population. It makes it very hard to catch up with the richer countries.   Israel has found something much the same.

No comparison of any pairs of countries, in any particular period, is ever going to be conclusive.  I use the examples in this post simply to illustrate the story.

[1] Starting the comparison from the start of the BIS series in 1964 would result in an even larger fall for Korea

The contrary views of Croaking Cassandra

For anyone interested in a bit of background to this blog, and on me, Richard Harman, proprietor of the new New Zealand political news and analysis site, Politik ran a profile of me this morning.

It is a pretty fair reflection of our interview, and reflects my interests and aspirations –  in particular, the issues around New Zealand’s long-term economic underperformance matter a great deal more to me than critiques of aspects of the Reserve Bank.  When I left the Reserve Bank, I intended that Bank-related material would represent a distinct minority of my posts.  That is still my aim, but it may take some time to get there (and as one journalist who came to visit said to me “I wouldn’t be here if you were writing mainly about long-term economic performance issues”).

Sadly, the description of the Governor’s attitude to some criticisms I made of a draft document around the first set of LVR controls is accurate.  After that episode –  where even the extreme disapproval was only conveyed indirectly –  our next conversation was two years later when we accidentally found ourselves alone in the same lift in the midst of the restructuring that led to my job being abolished.  I was clearing my desk and carrying a box of books down to my car.  To his credit, Graeme did actually manage to make conversation –  about Piketty’s book, a copy of which was on top of my pile.

I should make one clarification/correction.  I’m reported as saying, about LVR restrictions, “Furthermore the Bank had done no research on what the likely impact of the controls might be.”.  I don’t think that was what I said, but if I did say it, it was not what I intended.  My criticism of the Bank’s analysis and argumentation around LVRs has been around

  • the failure to produce research looking carefully at the lessons of countries that did, and did not, experience financial crises in the last decade,
  • the failure to meaningfully engage with the Bank’s own stress test results, which suggest the New Zealand system is very resilient to even quite severe adverse shocks, and
  • the failure to engage with the statutory requirement to promote the efficiency of the financial system.

And  in the final sentences, I’m not sure how my friend and former boss Don Brash ends up classified by Harman as a “non-practitioner”.

SNZ’s productivity growth estimates

Statistics New Zealand released a swathe of annual productivity data yesterday.

These annual productivity data focus on the so-called “measured sector”, whereas most often (for data availability reasons) productivity comparisons are done for the whole economy.  The measured sector currently covers 77.3 per cent of the economy.  It excludes ownership of owner-occupied dwellings, public administration and safety, education and training , and health care and social assistance –  all sub-sectors where market price information is difficult or non-existent.  The measured sector data are good quality but (a) are only available with a considerable lag (data released yesterday are up to the year ended March 2014), and (b) are mostly only useful for looking at New Zealand’s own performance over time (and only limited amounts of time, since the data on this measure go back only to the mid 1990s).  Other databases, typically using whole economy measures, are more useful for timely cross-country comparisons.

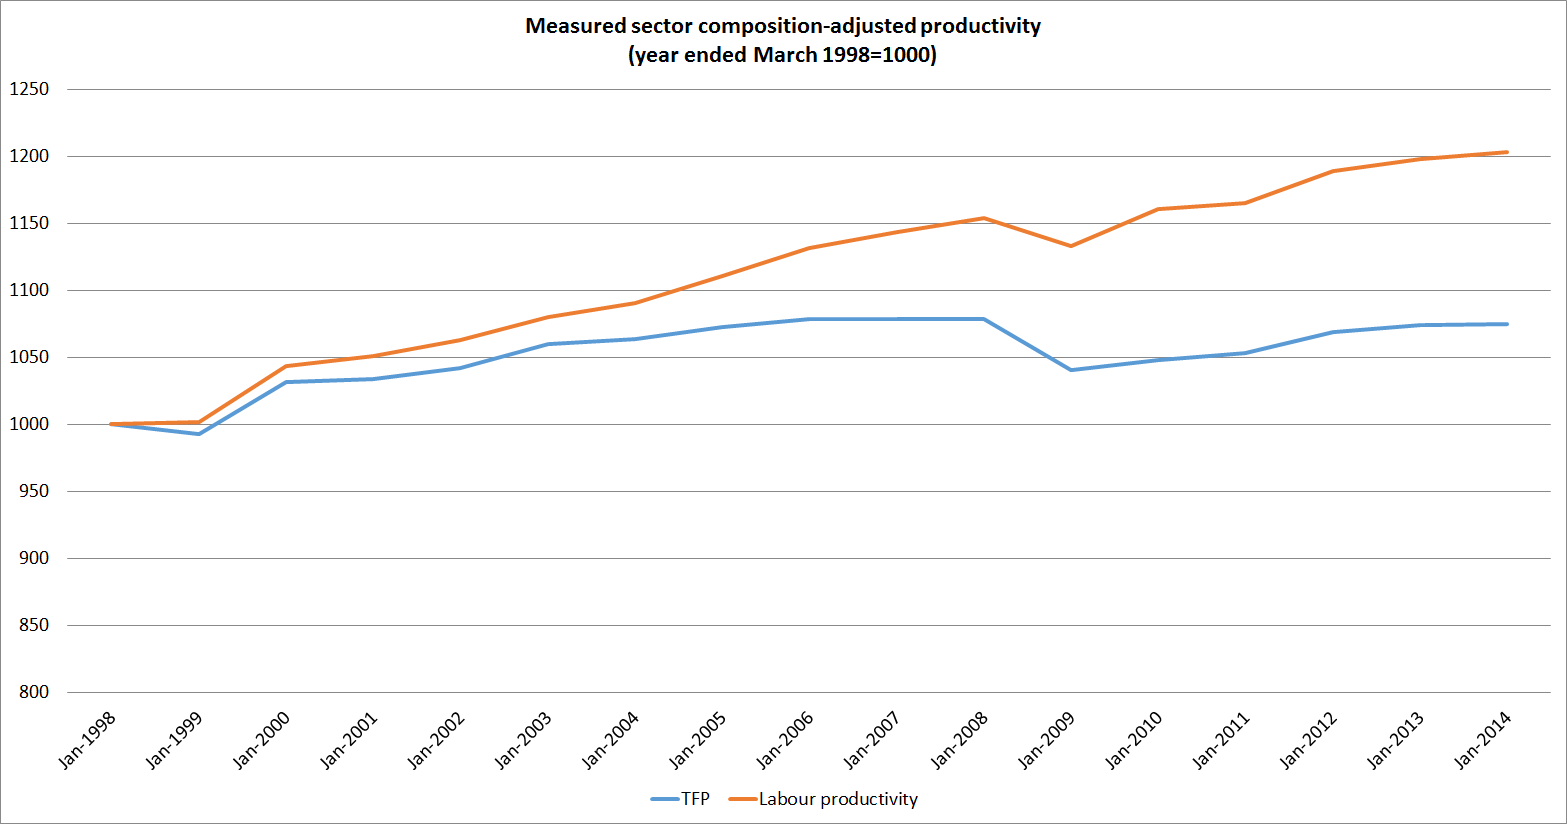
The chart below shows measured sector labour productivity and total factor productivity growth since the  year-ended March 1998.  These measures don’t just use a volume measure of labour inputs (eg hours worked) but adjust for the changing composition (improving quality of the workforce).  Simple measures based on hours worked in effect understate the role of inputs and, thus, overstate productivity growth.
measured sector
On this measure, labour productivity growth does not look too too bad.  In particular, although growth since 2007/08 has been slower than it was previously, the slowdown is less marked than many other series show for other countries.  But bear in mind that over the 16 years shown, total growth in labour productivity was only 20.3 per cent –  just under 1.2 per cent per annum.

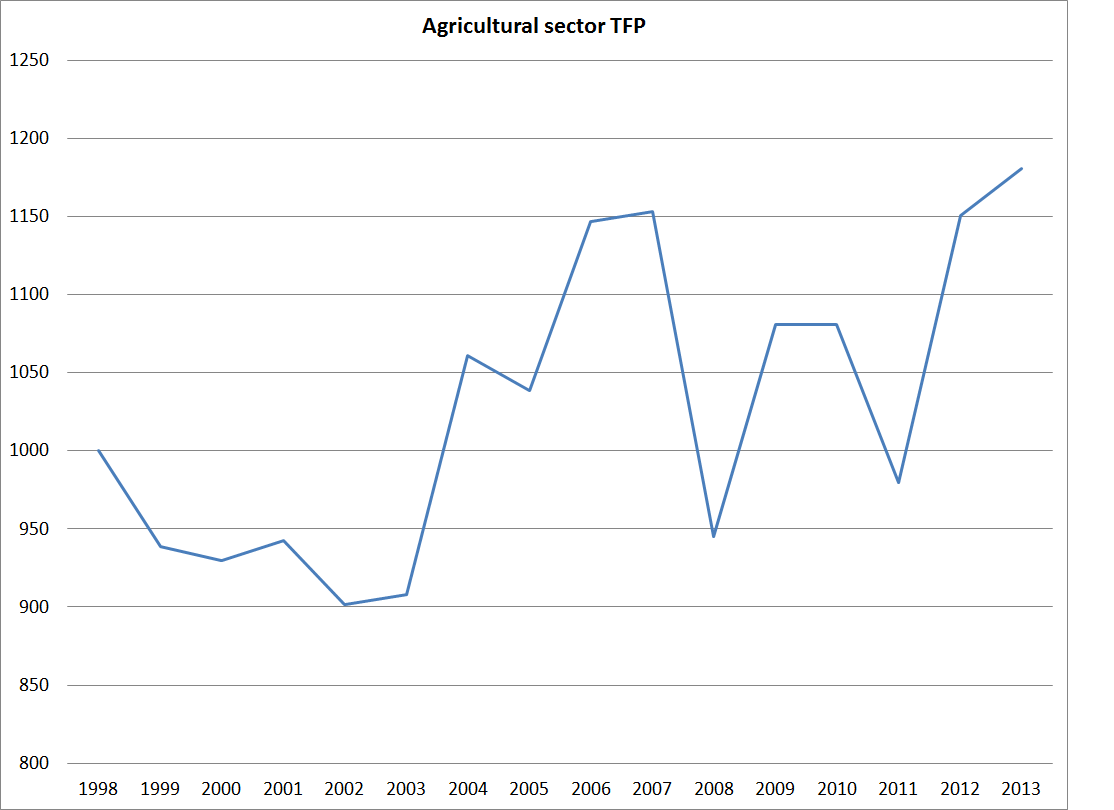
By contrast, the TFP picture is sobering.  In the 11 years since 2003, total TFP growth has been around 1.5 per cent (little more than 0.1 per cent per annum).  As I’ve suggested previously, perhaps there is something in the notion that the higher terms of trade (since 2004) have undermined TFP growth, changing production patterns to take advantage of the higher output prices but in ways that reduced measured productivity.  Perhaps, but I doubt if the effect can have been quite that large.  And the sectoral TFP data back up those doubts.  Here is the chart for agricultural sector TFP (only available to March 2013).  It is a noisy series (droughts do that), but it looks as though there has been some TFP growth in the sector since 2003, unlike the picture in the aggregate TFP series.

agriculture

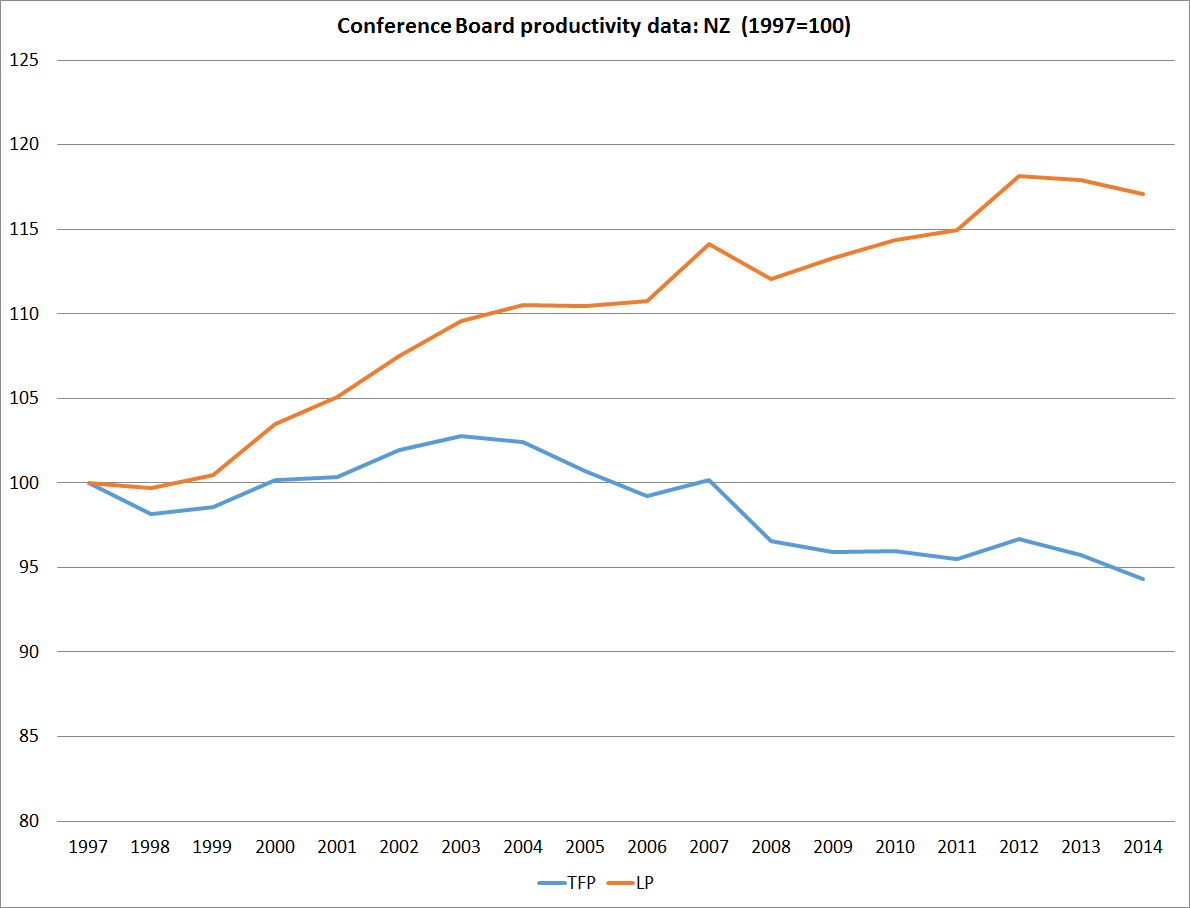
Finally, a quick comparison with the Conference Board estimates for New Zealand, which I used in my series on cross-country comparisons since 2007.    Here is the chart.

conference

The Conference Board uses a model to estimate TFP which ascribes more of New Zealand’s growth to the growth in capital services (than SNZ do).  (Like SNZ they make a correction for changing labour quality).   There is no point directly comparing the number from the SNZ measured sector TFP series with the Conference Board TFP series – different models produce different results.  But what is perhaps useful is to note that in both models New Zealand’s TFP growth has tailed-off markedly since 2003.  That should be pretty disconcerting.

And here is the international context for TFP growth, with a focus on the post-2007 period.

BOE chief economist on policy reversals

The Bank of England’s chief economist Andy Haldane had a stimulating speech out overnight.  I find almost everything Haldane writes is worth reading –  he stimulates thought, and sends me off chasing down references, even if I often end up not quite convinced by a particular argument he makes.

This speech, titled simply “Stuck”, explores some of the reasons why interest rates, around the advanced world, have been so low for so long.   Much of his story uses insights from psychology literature to try to explain behavioural responses across the advanced world in the years since the 2008/09 crisis.  I don’t find the application of the psychology literature entirely compelling, partly because Haldane does not attempt to differentiate between countries that did, and did not, directly experience a financial crisis.  For example, I would have expected different behavioural responses in places such as Ireland or the United States, on the one hand, and countries like New Zealand and Australia on the other.  For New Zealanders, I’d assert, the experience of 1987 to 1991 was much more frightening, and prone to have induced behavioural change, than anything we directly experienced in 2008/09.  And yet within 2.5 years of the trough of the 1991 recession, interest rates needed to rise here.  By contrast, in mid 2015, we are six years on from the trough of the recession, with no sign that the OCR needs to be higher than it was in 2009.

As it happens, New Zealand gets a mention in Haldane’s speech, in somewhat unflattering company. I did a post a few weeks ago on Policy interest rate reversals since 2009 looking at the 10 OECD countries/areas that had raised their raised their policy rates and then lowered them again.  Writing about the New Zealand policy reversal I commented:

it is difficult not to put this episode –  the increases last year, now needing to be reversed – in the category of a mistake.  It is harder to evaluate other countries’ policies, but I would group it with the Swedish and ECB mistakes.    Monetary policy mistakes do happen, and they can happen on either side (too tight or too loose).  But since 2009 it has been those central banks too eager to anticipate future inflation pressures that have made the mistakes and had to reverse themselves.  …..it should be a little troubling that our central bank appears to be the only one to have made the same mistake twice.  It brings to mind the line from The Importance of Being Earnest:

“To lose one parent may be regarded as a misfortune; to lose both looks like carelessness.”

Haldane includes in his speech a table with an “illustrative list of countries which have pursued the latter strategy – tightening during the post-crisis recovery and then course-correcting”.  New Zealand’s 2014/15 experience makes the list, as do the Swedish and ECB reversals noted in my quote above.  Somewhat provocatively, Haldane includes in the same list the US experience in 1937/38, where some combination of  fiscal and monetary policy tightenings (the role of active monetary policy is much debated) badly derailed the US recovery from the Great Depression, generating another severe recession.
haldane2
Haldane uses this illustrative material (and not all of the cases seem overly well chosen) to argue a case for an alternative monetary policy strategy:

The argument here is that it is better to err on the side of over-stimulating, then course-correcting if need be, than risk derailing recovery by tightening and being unable then to course-correct.  I have considerable sympathy with this risk management approach.

He goes on to say

Chart 19 shows the average path of output either side of the tightening. Most of these countries experienced several years of robust growth prior to the tightening, suggesting the economy was primed for lift-off. Yet when lift-off came, annual output growth weakened by around 2 percentage points in the following year, in the US by much more. Lift-off was quickly aborted as the economy came back to earth with a bump. In trying to spring the interest rate trap, countries found themselves being caught by it.

Why did this happen? One plausible explanation is the asymmetric behavioural response of the economy during periods of insecurity. Dread risk means that good news – such as oil windfalls – is banked. But it also means that bad news – 9/11, the Great Depression – induces a hunkering down. It risks shattering that half-empty glass. A rate tightening, however modest, however pre-meditated, is an example of bad news. Its psychological impact on still-cautious consumers and businesses may be greater, perhaps much greater, than responses in the past. Or that, at least, is what historical experience, including monetary policy experience, suggests is possible.

Another way of illustrating this point is to imagine you were concerned with the low path of the yield curve and the limited monetary policy space this implied. And let’s say you were able to lift the yield curve to a level which, for the sake of illustration, equalised the probabilities of recession striking and interest rates being at a level at which they could be cut sufficiently to cushion a recession.

With monetary policy space to play with, this might seem like a preferred interest rate trajectory. But it comes at a cost, potentially a heavy one. The act of raising the yield curve would itself increase the probability of recession. If we calibrate that using multipliers from the Bank’s model, cumulative  recession probabilities would rise from around 45% to around 65% at a 3-year horizon. These ready-reckoners are, if anything, likely to understate the behavioural impact of a tightening in a nerve-frazzled environment.

This suggests that a policy of early lift-off could be self-defeating. It would risk generating the very recession today it was seeking to insure against tomorrow. In that sense, the low current levels of interest rates are a self-sustaining equilibrium: moving them higher today would run the risk of a reversal tomorrow. These self-reinforcing tendencies explain why the glue sticking interest rates to their floor has been so powerful.

Haldane concludes that, in his view, current very low UK policy interest rates are still needed, to secure “the on-going recovery and the insure against potential downside risks to demand and inflation”.  Even at such a low policy rate, Haldane observes that he has no bias –  the next move the policy rate could be up or down, and might well be a long time away.

It is certainly refreshing to have a speech of this depth and quality from a senior policymaker, just one among many of those on the Bank of England’s Monetary Policy Committee.

But how convincing is his argument?  I’m not entirely convinced about the mechanism he proposes, but in practical terms, experience is on his side.  Almost all the advanced countries that have raised rates since 2009 have had to lower them again, in New Zealand’s case twice.  Personally, I’m inclined to think that psychology might offer more insights into the behaviour of central banks  and markets –  which, as Haldane notes, repeatedly expected early lift-offs and were repeatedly proved wrong.  In addition, as a nice piece on the Bank of England’s new blog recently illustrated, the “probability of deflation is raised further, and the likely duration of any deflation increased, if one thinks that there are limits on how far the Monetary Policy Committee (MPC) could loosen policy in the face of new shocks.” (ie as policy rates get near zero).

In the current climate, the safest approach for monetary policymakers is to hold off on the rate increases until there is hard evidence that actual measures of core inflation have risen to some considerable extent.  And if you have a central bank that made the mistake of moving too soon, hope that they recognise it quickly, own up quickly, and quickly act to reverse the mistake.  With data like the ANZBO survey results out this afternoon, those wishes seem increasingly apposite in the New Zealand case.

A few thoughts on Greece

It is a pretty difficult period for the world economy. The new BIS Annual Report (on which more later) keeps repeating that world growth has been back at around long-run averages.  But a quick glance down the headline stories on MacroDigest this morning (and it is much the same on the FT or the WSJ) reveals this collection:

Puerto Rico “can’t pay $72bn of debt”

Greece threatens top court action to block Grexit

Double bubble trouble in China

A failed euro would define Merkel’s legacy

BOE’s Haldane: Record-low rates necessary for continued recovery

My 12 year old has asked me to start teaching him economics, and we are bombarded with stories to discuss. This morning, at least, there are no good-news stories.

Of course, most focus is on Greece.  I’ve recently lost a long-running wager on Grexit.  Three years ago I bet a senior official who was much closer to the politics of the euro area that at least one country would have left the euro by mid-June 2015.   His story was, essentially, that the European authorities would do whatever it took to hold the euro together and make it viable for the long run, partly because the alternative was so awful.  My story was that the economic stresses were sufficiently severe, and choices would ultimately be made in individual nation states, that euro was most unlikely to hold together, at least with anything like the number of countries it had then.

In 2012 I certainly underestimated the political determination, and probably also the extent to which Greek public opinion would want to stay in the euro, no matter how bad the economy got.  Getting into the euro seems to have been a mark of a successful transition to a modern democratic state.  This was, recall, a country that had been ruled by the colonels as late as 1974, and had had a civil war only thirty years prior to that.  Even now, there is no certainty that a “no” vote this Sunday –  in respect of a package which is no longer even on the table –  will lead to Greece quickly leaving the euro.  With tight enough capital controls, and the rudiments of a parallel currency, perhaps they will limp on for a while yet.  The political imperative still seems to be that if Greece is going to leave, the narrative has to be one in which “other countries forced us out”.   Greece doesn’t seem to be ready to positively embrace exit –  political dimensions aside, the path through the first year or two beyond exit is pretty difficult and unclear.  For those of you who have read Pilgrim’s Progress, it is perhaps reminiscent of Christian’s fear as the river rises around him –  the river he must cross to enter the celestial city.  Grexit is no path to nirvana, but it does promise something better.

Because if exit looks frightening, going on as things have been in the last few years shouldn’t be remotely attractive either.  The simple mention of 27 per cent unemployment should really be enough.  Add in no sign of any sustained growth in the external sector of the economy, and it is a picture of any economy that has made no progress at all in reversing one of the very deepest recessions of modern times.  None of that is to deny that there have been useful reforms. But, as I’ve said before, there is no sign of any politically acceptable deal (politically acceptable to creditor countries and to the Greeks) that in consistent both with Greece staying in the euro, and with securing a strong rebound in economic activity and employment in Greece.  “Tragedy” is an over-used word, but surely this is one?

Part of the sheer awfulness of the situation is realising the part that other countries played in bringing this about.  And here I include even remote countries like New Zealand, which did not speak out –  or even speak quietly – against the IMF involvement in the deal.  Without the bailout package in 2010, this crisis would have come to a head five years ago.  It is now hardly controversial to suggest that the case for the 2010 bailout package, rather than a widespread Greek sovereign default, was mostly about the French and German banking systems, and concern with the possible ramifications for the wider world economy and financial system.    None of this absolves the Greeks of some responsibility.  Technically, no one forced them to take the deal.   But as the Irish and Italian authorities also found, it can be very difficult to resist the pressure to accede to the wishes of the ECB and core euro-area governments.

Where to from here?  As Gideon Rachman put it in his FT column today

If the Greek people vote to accept the demands of their EU creditors — demands that their government has just rejected — Greece may yet stay inside both the euro and the EU. But it will be a decision by a cowed and sullen nation. Greece would still be a member of the EU. But its European dream will have died.

And if Greece does leave, who will be next, and when?  It might take some time, but with no sign of a strong or sustained rebound in European growth, it is difficult to see the euro surviving in anything like its current form.  It probably isn’t a risk in the next few months –  the ECB and the Commission can deploy support mechanisms to manage any resurgence of external market pressures.  The threat is more from public opinion –  of realising, a year or two from now, that there is viable life outside the euro.  Places as badly managed as Argentina didn’t lapse into permanent economic depression after default and the abandonment of a fixed exchange rate.

The euro has not delivered the promises of its advocates and founders.  Further integration of national policies seems increasingly unlikely to happen.  Breaking up is hard to do, and in this case could be very disruptive to the wider world economy (with so little policy firepower left anywhere)  But the end of the euro, one of the more hubristic policy experiments in the modern West, would probably be good for the longer-run health of the member countries, and especially for their ability to respond to future shocks.  What it might mean for the future of the EU itself is a bigger question.  One could envisage very bad outcomes – a reversion to the controls of 1957, before the EEC was first negotiated.  That doesn’t seem very likely –  trade barriers are much lower now than then around the world.  Perhaps over time what might emerge is something more like a free-trade area without the overlay of other controls and bureaucratic apparatus of Brussels.  For citizens, even if not necessarily for officials, politicians, and lawyers, that might be rather a good thing. It might even make membership of a much more modest EU attractive in the UK.

Reforming NZS – a pertinent private member’s bill

Our Members of Parliament have, at present, 72 proposed members’ bills lodged with the Clerk, each hoping that his or her own bill will be drawn in the periodic ballot that is held to determine which will get the opportunity to be debated and voted on in the House.

There was a ballot the other day.  Four bills were drawn (the list is at the previous link).  On a quick glance, three of them look quite sensible, but here I wanted to highlight just one of them.

It is the New Zealand Superannuation and Retirement Income (Pro Rata Entitlement) Amendment Bill, in the name of New Zealand First MP, Denis O’Rourke. Unusually for a member’s bill, it is designed to (and would appear to) save the taxpayer considerable amounts of money.

The policy statement at the start of Mr O’Rourke’s draft bill sets out the gist of the proposal.

This Bill proposes a pro rata entitlement (PRE) to New Zealand superannuation (NZS) based on residence and presence in New Zealand between the ages of 20 and 65 years; a period of 45 years, or 540 months.

The Bill confronts the demographic realities of an increasingly ageing and mobile New Zealand population and its impact on NZS. These global trends require fair policies for the New Zealand taxpayer, the migrant, and the expatriate Kiwi who return to New Zealand to retire.

Within the OECD, NZS is unusually generous in terms of residency requirements. For example, a migrant who lives in New Zealand for 10 years may make little or no contribution to the New Zealand economy, yet is entitled to full NZS. Under the PRE system, this migrant is entitled to 120/540 of NZS, but retains any overseas government pension which is currently deducted from his or her NZS under the direct deduction policy (DDP).

Another example is an expatriate Kiwi who has worked overseas for 30 years, contributing to another economy, and has most likely earned an overseas pension. On returning to New Zealand to re-tire, he or she is also entitled currently to full NZS. Under PRE, with 15 years’ New Zealand residency, this returning Kiwi is entitled to 180/540 of NZS, but will also retain his or her overseas pension, which is currently deducted. Within the age period between 20 and 65 years, the Bill disregards up to 2 months’ overseas travel per calendar year. The Bill also exempts an aggregate period of 5 years’ absence for those whose rite of passage may cover their overseas experience, education and training (often bringing back exceptional skills), and, of course, the well-earned extended world cruise.

I touched on this issue in a post a couple of months ago.  It is a particularly serious issue because time spent living in Australia counts towards the residential eligibility requirement for NZS.  That just seems like skewing the playing field against the New Zealand taxpayer, in favour of those who have spent large chunks of their working lives in Australia.

One could, no doubt, debate details of O’Rourke’s proposal. But, in a sense, that is what should happen.  Whatever their reservations, I hope MPs will vote this bill through a first reading and allow it to examined by a Select Committee, inviting public submissions and perspectives from experts from MSD.  Perhaps there is a better way to deal with the issue, and I wonder if O’Rourke hasn’t gone a little too far (in requiring 40 years residence after age 20 to collect full NZS) to be sustainable.  But this looks like a constructive response to a feature of our system that otherwise looks likely to be increasingly expensive.  Not being at all a fan of the SuperGold card, there is much more money at stake on this issue, than on the card.

Here is what I had to say on the issue in early May:

New Zealand has a high rate of inward migration.  The target level of non-citizen immigration is around 1 per cent of the population per annum.  Many of those people come to New Zealand young and will spending most of their working lives contributing to New Zealand and its tax system.    But to collect a full rate of NZS you need only have lived in New Zealand for 10 years (at least 5 after the age of 50), so many people will be able to collect a full New Zealand pension having been in New Zealand for not much more than a quarter of a working life.  New Zealand does enforce quite strict offset rules on those who have accumulated foreign pension entitlements, but many migrants now come from countries with little or no public provision of pensions.  Surely it would make more sense to introduce a graduated scale –  perhaps paying half the full NZS after 10 years residence, and a full rate only after someone has lived here for 30 years?

I had always assumed that New Zealanders who had emigrated to Australia in their hundreds of thousands over the last 40 years or so would be unlikely to come back to New Zealand when they were old, because they would have to live here for five years after age 50 before being eligible for NZS.    I wasn’t the only one to assume that – I was corrected recently by a public servant doing some work in the area who had just discovered that residence in Australia (and several other countries with whom New Zealand has social security agreements) counts as residency in New Zealand for NZS purposes.  It looks as though people can leave New Zealand at 20, spend an working life in Australia, accumulate significant private assets under the Australian compulsory private superannuation scheme (enough that they would not be eligible for the Australian age pension), and having cashed in those assets could return to New Zealand at 65, claiming a full rate of NZS never having worked, or paid tax, in New Zealand at all.  Indeed, one might even be able to go on living in Australia.  Perhaps I have misunderstood the rules, but this structure strikes me as pretty scandalous.  What New Zealand public policy interest is served by such a generous universal approach to people who have not lived here for a very long time?

Personally, I’m happy that we should treat quite generously people who have spent most of their life in New Zealand and have reached an age that can genuinely be considered “elderly”, but I don’t feel the same sense of generosity towards those who have migrated here quite late in life, or to New Zealanders who have spent most of their working lives (and taxpaying years) abroad.

I subsequently had it confirmed that I had interpreted the rules correctly, and it was also pointed out to me that the Productivity Commission had highlighted this feature in its report, with the Australian Productivity Commission, on trans-Tasman issues.

China: the composition of the RB TWI really doesn’t matter for monetary policy

The BNZ’s Raiko Shareef has a research note out looking at the impact of including the Chinese yuan in the Reserve Bank’s trade-weighted index measure of the exchange rate. He argues that the inclusion of the CNY will increase the sensitivity of New Zealand’s monetary policy to developments in China.

I think he is incorrect about that. China has, of course, become a much more important share of the world economy in the last couple of decades. It has also become a much more important trading partner for New Zealand. Both of those developments, but particularly the former, mean that economic developments in China, including changes in the value of China’s currency, have more important implications for New Zealand, and other countries, than they would have done earlier. The Reserve Bank recognised the importance of the rise of China in setting monetary policy, and assessing developments in the exchange rate. But the Bank was quite slow to include the CNY in the official TWI measure. There was a variety of reasons for that, some more persuasive than others. But as far back as 2007 the Bank started publishing supplementary indices that included the CNY. If the Reserve Bank had used the old TWI in some mechanical way, then perhaps it would have been misled, and perhaps there would have been policy implications from the change in weighting schemes, But not even in the brief bad old days of the Monetary Conditions Index was the TWI used mechanically for more than a few weeks at a time. Every forecast round, the Bank comes back and goes through all the data, not just a reduced-form equation feeding off a particular TWI.

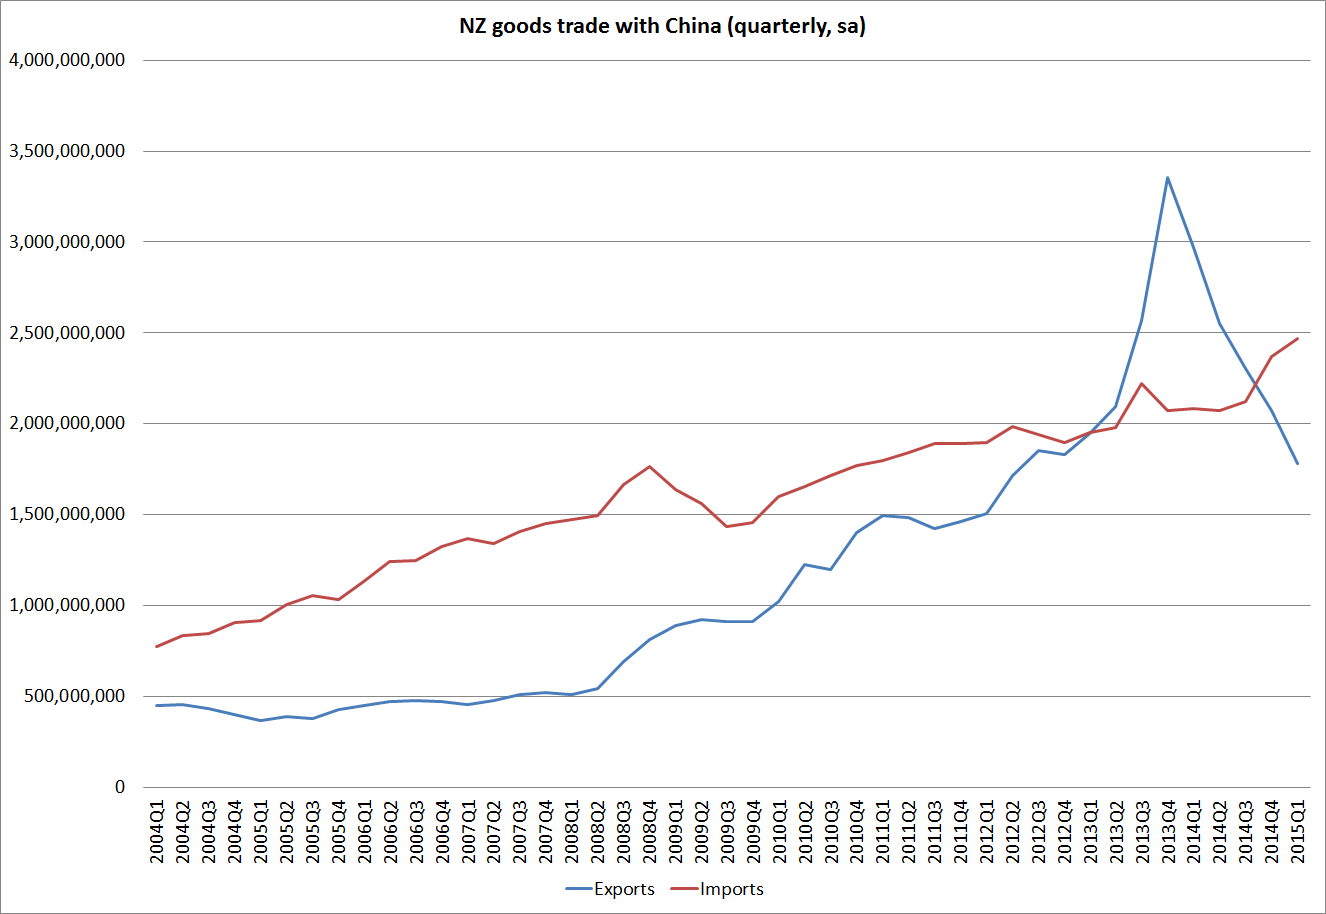
In the new TWI, the CNY has the second largest weight (20 per cent), just behind that on the Australian dollar.(22 per cent). But for the time being, that is likely to be high tide mark for the weight on China’s currency. Here is what has happened to goods trade – imports from China have kept on rising, but export values have plummeted (mostly on the fall in dairy prices).

chinatrade
A bigger question is one about what the appropriate weight on the CNY (and other currencies) is. I’ve argued that the CNY is important to New Zealand not because in a particular year we happen to sell lots of milk powder there, rather than in some other market, but because China is a large chunk of the world economy.  If we had no direct trade with China, it would still matter quite a bit.  In that sense, I reckon the new TWI understates the economic importance of the USD and the EUR, and overstates the importance of the AUD. We trade a lot with Australia, but Australia has very little impact on the overall external trading conditions our tradables sector producers face.

There are no easy answers to these issues. In a sense, that was why the Bank settled last year on a simple trade-weighted index. It wasn’t necessarily “right”, it wasn’t what everyone else did, but it was easy to compile and easy for outside users to comprehend. And without spending a huge amount of resources, on what was (probably appropriately) not a strategic priority, it wasn’t clear that any more sophisticated index would provide a better steer on the overall competitiveness of the New Zealand economy.

An issue of the Bulletin, written by Daan Steenkamp, covered some of this ground last December.

As already discussed, the new TWI has appreciated much less than the old TWI over the past decade or so. It is natural to ask whether the difference has, or should, affect how the Reserve Bank interprets or assesses the exchange rate. For example, are recent judgements about the ‘unsustainability’ of the exchange rate around recent levels affected? The exchange rate, however measured, is never considered in isolation from everything else that is going on in the economy. The Reserve Bank has, for example, recognised the rising importance of Asia in New Zealand’s trade and has taken that into account in its analysis and forecasting over the past decade or more. Exporters and importers deal with individual bilateral exchange rates, not summary indices. And New Zealand’s longstanding economic imbalances have built up with the actual bilateral exchange rates that firms and households have faced over time. How those individual bilateral exchange rates are weighted into a summary index therefore does not materially alter the Reserve Bank’s assessments around competitiveness and sustainability. Applying the macro-balance model (Steenkamp and Graham 2012) or the indicator model of the exchange rate (McDonald 2012) to the new TWI there are inevitably some changes, but the conclusions of those models, about how much of the exchange rate fluctuations are warranted or explainable over the past decade or so, are not materially altered.

There is no single ideal measure of an effective exchange rate index. Different TWI measures are useful for different purposes. In trying to understand changes in competitiveness it is likely to be prudent to keep an eye on them all. Developments in specific bilateral exchange rates will also have different relationships with economic variables and will be useful for different types of analysis. The focus of the Reserve Bank’s approach is on assessing the impact of the exchange rate on the competitiveness of New Zealand’s international trade, and the implications for future inflation pressures. Developing a full indicator of competitiveness, that reflected the specific nature of New Zealand’s international trade, and in particular the importance of commodity markets would require a very substantial research programme. It is difficult to be confident that the results would offer a materially better summary exchange rate measure than the simpler approaches the Reserve Bank has customarily adopted.

Of course, if China continues to grow in significance in the world economy, and if its currency becomes more convertible and is floated, it will become increasingly important to New Zealand. At the moment, the risks around China look somewhat the other way round – the influence of China may be more about the nasty aftermath of one of the biggest, least-disciplined credit booms in history. Growth looks to have fallen away much more than many (including the Reserve Bank) seem to have yet recognised.  But whatever the correct China story, the influence on New Zealand has little or nothing to do with how the Reserve Bank’s trade-weighted index is constructed.