Teaching New Zealand history

A couple of year ago I wrote a post here about the idea of teaching more New Zealand history in state schools. In principle I was, and am, strongly supportive of doing so, and have always been conscious that almost all the New Zealand history I learned has been acquired since leaving school. But I was uneasy about what was likely to be taught, which left me in practical terms ambivalent.

Incidentally, in that post I included a quote – from a newspaper article that day – in which the Deputy Leader of the Labour Party (and then Associate Minister of Education) denied there was any intention to make such teaching compulsory. But from next year it will be, at least for kids from 5 to Year 10.

A few months ago the government put out a consultative document with a draft curriculum for the teaching of New Zealand history to these children (bear in mind that the median age of the students will be 10). Submissions close today.

I wasn’t going to make a submission – what is the point, the government and the bureaucrats have ideological agendas they are unlikely to be deflected from – but after reading someone else’s submission the other day, which I was sympathetic to but disagreed with quite a bit of, I decided to make a short submission, if nothing else for the record.

My full submission is here.

I outlined several concerns that mean I think the proposed curriculum is highly unsatisfactory. Here is the body of my text

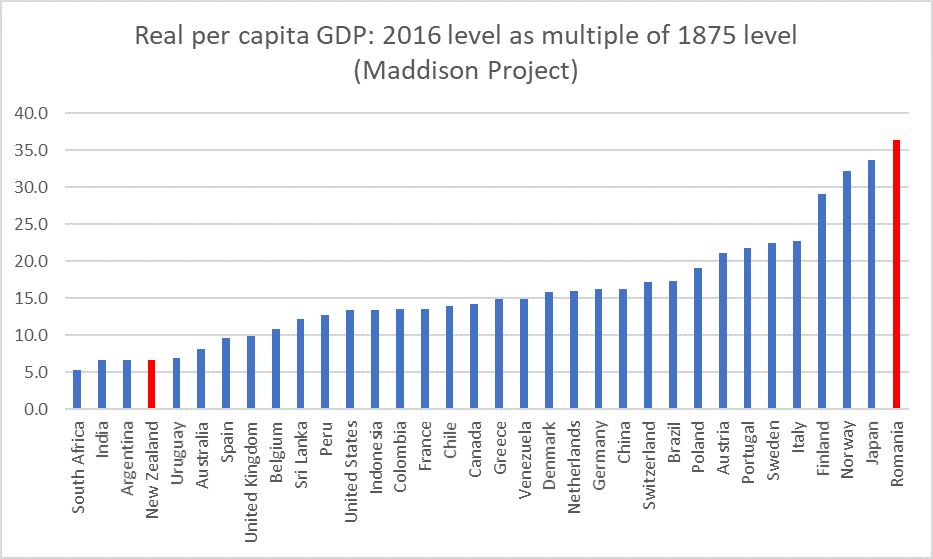
First, and although the focus is on young children (from age 5 to those at the end of year 10 just turning 15) there is no sense in the curriculum of any continuous narrative.    Providing such a basic outline of our history should be a basic in any history curriculum of this sort, which (sadly) represents almost all the formal history study most students will ever do.  No one, taught solely using this curriculum, will emerge with a rough sense of, for example, (a) the migration of Maori to these islands, (b) their settlement, their impact on the land, and their society, religion, economics, (c) the interface with more advanced technologies that connected these islands with the rest of the world, (d) the evangelisation of New Zealand and the key role of the Church Missionary Society, (e) key figures in early modern New Zealand history, (f) the economic development –  including large-scale immigration – that by the early 20th century had New Zealand as one of the highest income countries on earth, (g) the gradual process that led to New Zealand political independence. (h) the high rates of Maori-European intermarriage, and (i) key political figures (good and ill) of the 20th century.  Names and dates may be out of fashion – and they can be over-emphasised in the inevitable limited teaching time available – but they help provide a structure for beginning to organise thinking about historical events and times.  

Second, there is no sense of the wider world of which the New Zealand story (particularly since 1642/1769 or whichever date one focuses on) has been a part.    A significant element of pre-European New Zealand was its remarkable isolation – Maori having settled here some centuries earlier there was no evidence of ongoing contact with other societies in the Pacific (themselves typically small and isolated) and with no international trade at all.  It was an astonishing degree of isolation.    The European age of exploration and discovery opened these islands to the world, and the world to these islands – and had begun to do well before 1840.  Whether or not large-scale European settlement ever became a feature of New Zealand, that opening was inevitable and would always have been transformational.  And yet there is no hint of it.    Similarly, there is no sense of the similarities (and differences, for good and ill) of experiences in Australia, Canada, Newfoundland, Southern Africa, the United States and (beyond the English-speaking world) in southern Latin America or North Africa.  None of this can be taught in depth to young kids in a limited time, but it badly distorts the New Zealand story not to refer to them at all.   The people of these islands were isolated for several hundred years, but modern New Zealand is not – and for a least a century in the emergence of modern New Zealand what went on it was in parallel with, often interacting with, experiences in these other places.

Third, there is a strong sense running through the document that a primary purpose of studying history is to judge the past (and those in it) rather than to understand it.   Particularly when such young children are the focus, and when the curriculum is designed for use in schools across the country (attended by people of all manner of races, religions, political and ideological views), that focus is misplaced.    Understanding needs to precede attempts at judgement/evaluation, but there is no sign – in this document, or elsewhere in the curriculum – of children being equipped with the tools that, as they move into mature adulthood, will allow them to make thoughtful judgements or (indeed, and often) simply to take the past as it was, and understand how it may influence the country we inhabit today.    There is little or no sense, for example, that one reasonably be ambivalent about some aspects of the past or that some people might, quite reasonably, evaluate the same facts differently.

Fourth, not only does the document seem to operate in a mode more focused on evaluation and judgement than on understanding, it seems to champion a particular set of judgements, and a particular frame for looking at the history of these islands (evident, as just a small example, in its repeated use of the term “Aotearoa New Zealand”, a name with neither historical nor legal standing, even if championed at present by certain parts of the New Zealand public sector).     This includes what themes the authors choose to ignore – religion, for example, is not mentioned at all, whether in a Maori context or that of later arrivals, even though religions always (at least) encapsulate key aspects of any culture’s understanding of itself, and of its taboos).   Economic history hardly gets a mention, even though the exposure to trade, technology, and the economic institutions of leading economies helped dramatically lift average material living standards here, for all groups of inhabitants.   Instead, what is presented in one specific story heavily focused on one particular (arguably ahistorical) interpretation and significance of the Treaty of Waitangi.  These are contested political issues, on which reasonable people differ, and yet the curriculum document has about it something very much of a single truth.   In truth there a few things about which there is a high measure of agreement today – perhaps the ending of slavery and cannibalism here, under the influence of the gospel and (quite separately) colonial government – and thus a curriculum of this sort will be seen by many (including many parents) as little more than attempts to use the platform of compulsory public schooling as politicised indoctrination.   That is both inappropriate, unwise, and unnecessary.   And probably not helped by the very limited education in New Zealand education that most teachers have had, increasing the likelihood that what will be conveyed to children will be something more akin to a heavily politicised, nuance-free, (but in the case of most individuals well-meaning) “indoctrination”.

If a New Zealand history curriculum is to be anything more than an effort of indoctrination by a group who temporarily hold the commanding heights in the system, this draft should simply be scrapped and the whole process begun again with a clean sheet of paper.   Think, for example, about teaching the history of the last 1000 years, and the two primary strands (Maori, and Anglo/European) that have come together to form the modern New Zealand that we – today’s citizens – inherit, including confronting the fact (awkward for some) that modern New Zealand is primarily a Western-influenced society and people.   Teach about both Maori and European society, strengths, warts, and all, including recognising the ideas and events that made – for example – Britain and north-western Europe (and then its offshoots) not only the wealthiest but the most stable democratic societies.  Teach about the challenges, conflicts and opportunities created as those two societies have interacted over the last 250 years.  Highlights the key individuals, the events, the similarities and differences with other settler societies (including the huge exodus of New Zealanders, of all ethnicities, to Australia – more economically successful – in the last 50 years).  Teach about secularisation and social change, about the similarities and differences between New Zealand and other advanced countries.  But, for the most part, teach facts, teach narrative, teach verifiable stuff, and leave the evaluation for parents, religions, political parties, and for the young people themselves as they emerge into adulthood and – for those interested – more advanced study.

Any such course is inevitably going to emphasise some things rather than others – only by selection and systemisation can things be reduced to manageable scale – and some evaluation is probably unavoidable too. But the government’s document is a heavy-handed unrepresentative piece that has the feel of being dreamed up by some black-armband Social Studies teachers who have studied little history and have little interest in history for its own sake – for understanding our past, rather than (as appears in this document) primarily to judge it.

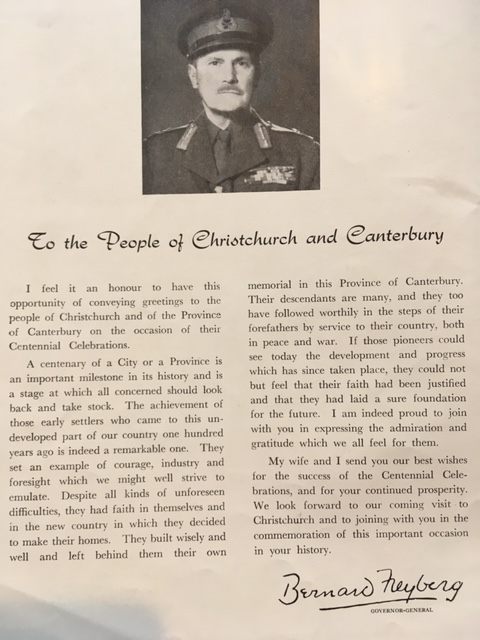
On a related theme – including how differently people see the same events (different people, different times, different whatever) – in a secondhand bookshop recently I picked up a copy of the Official Souvenir Programme of the 1950 Canterbury Centennial Celebrations. I bought it mostly because all my family were then in Christchurch, and almost all my New Zealand ancestors had lived mostly in Canterbury. But what really caught my eye were the messages at the front of the document from the Governor-General (Freyberg) and the Prime Minister (Sid Holland). Here is Freyberg’s

freyberg

And here is Holland’s

Holland

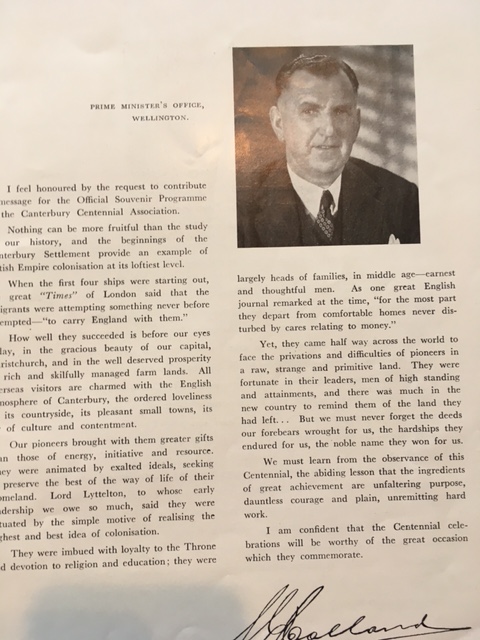
It is a very different view of (modern) New Zealand and its history than that of today’s Cabinet or the Ministry of Education’s curriculum writers, and yet I sense not a view that the curriculum writers would even recognise or regard as acceptable.

(I read the Holland contribution with particular poignancy, remembering the long journey, on a ship wracked with scarlet fever, that Holland’s father and my great-grandfather – young sons of a poor Yorkshire farm labourer – had made to Christchurch back in the early 1860s).

Monetary policy

My teaser for today’s post was this tweet

If I remember correctly, the last time was probably in mid-2011 when the then OCR Advisory Group was debating when to reverse the emergency cut we’d put in place after the February 2011 earthquake. As it happens that was all overtaken by the intensifying euro crisis.

Yesterday’s Monetary Policy Statement has been described, colloquially, as “hawkish” or at least having taken a “hawkish tilt”. I’m not really sure that is warranted, but it is hard to tell.

The MPC reintroduced a projection track for the OCR for the first time since this time last year, and in that track the OCR starts to be lifted gradually from the September quarter of next year. I have never been a fan – going back to the introduction in 1997 – of the OCR projection track, since it is little more than castles in the air make believe to suppose that anyone knows now what OCR will be appropriate a couple of years hence, in turn driven by the outlook a couple of years beyond that. What we need – and what central banks can tell us sensibly – is where they think things might head by the time of the next review. But, like it or not, we have a forward track. That track was always going to show OCR increases at some point, if only for two reasons (a) the Bank’s model will always have interest rates heading back towards neutral as inflation settles around target, and (b) the LSAP programme – which the Bank claims to believe is highly effective – runs out next June.

And when the Governor was asked at the press conference how much the forward track had changed from what it would have been (unpublished) in March he simply refused to say.

But we do know, because the Committee told us, that “our medium-term outlook for growth remains similar to the scenario” in the February MPS. And their numbers support that: GDP growth over the two years to March 2022 is exactly the same (2.9% in total) as they’d shown in February, and for the following two years projected growth is just a touch lower than in February. On the other hand, they seem to have revised down their potential output growth assumptions a bit, and as a result the output gap estimates have been revised to something less negative/more positive.

RB Output gap projections, average for full year to March
2021202220232024
Feb MPS-1.0-0.60.91.4
May MPS-0.4-0.21.31.3

And although they claim to believe that the economy is still below “maximum sustainable employment” I don’t think their hard numbers really back up that view. The unemployment rate is currently 4.7 per cent, they expect to be still 4.7 per cent next March, and then over the following couple of years when the output gap is projected to go materially positive they only expect the unemployment rate to drop to 4.4 per cent. On their numbers, unemployment must now be very close to the NAIRU (functional full employment, given the regulatory environment and labour market institutions etc).

What else do they tell us about the near-term? Well, there is core inflation. They include this chart

core inflation RB

That is much the same suite of indicators that led me to conclude last month

I think it is is probably safe to say that core inflation in New Zealand is now back at about 2 per cent. That is very welcome, even if somewhat accidental (given the forecasts that drove RB policy). 

Same goes for the (somewhat selective) range of inflation expectations measures the Bank summarises here

infl expecs may 21

That’s good too. Quite a lift in the last few months and now about as close as you are going to see to 2 per cent right across the horizon,

And then the Bank tells us their decision rule

The Committee agreed to maintain its current stimulatory monetary settings until it is confident that consumer price inflation will be sustained near the 2 percent per annum target midpoint, and that employment is at its maximum
sustainable level.

But on their own numbers, that seems to be (a) pretty much the current situation, and (b) the outlook. Now, to be sure, that statement isn’t entirely coherent because logically you have to be confident of those outcomes even after you start tightening monetary policy a bit, but set that to one side for moment.

And so I guess that is why I’m left wondering whether it is even remotely fair to characterise yesterday’s statement as having a hawkish tilt. They have rising (to record) terms of trade, significant fiscal stimulus from a big fiscal deficit, they think the output gap is all but closed, and any unemployment gap must be close to being closed, core inflation (and expectations at target) and yet they think that precisely the same monetary policy settings are warranted as was the case six months ago, more aggressive than those in place a year ago (given that the Funding for Lending Programme, which is effective, is a more recent addition). As a reminder, as recently as November they had inflation averaging 1 per cent for 2021 and 2022 (on exactly the current monetary policy).

Perhaps the operative word in that decision statement is “confident”, but realistically (a) when is macro forecasting ever confident? and (b) they must have greatly reduced uncertainty/error-margins now than was the case a few quarters ago. It isn’t as if actual core inflation is 1.5 per cent but the forecasts show it getting to 2 per cent, or actual unemployment is 6 per cent but forecasts show it getting to 4.5 per cent.

I guess the other thing I found striking about the document is that although the Bank has a couple of pages on how to think about short-term price shocks (the sort of boilerplate stuff that has appeared in MPSs every year or two for 30 years) – and I suspect they are quite right on that narrow point (eg that headline inflation of 2.6 per cent for the year to June is not, of itself, something to worry about – any more than similar spikes in, say, 2008) – there is no discussion at all of the increase in market-based measures of inflation expectations here and abroad.

In the New Zealand case those inflation breakevens from the indexed bond market are still sitting a little under (but “near”) 2 per cent, but that is a great deal higher (and thus much more reassuring) than the situation for the last few years. In the US – easiest market to get the data for if you don’t have a Bloomberg terminal – we see something like this

US inflation breakevens 5yr may 21

These breakeven numbers move around a bit but when we look, for example, at the rise in implied expectations after then 2008/09 recession it didn’t overshoot to some ridiculous, unsustained level, but settled back in a fairly orderly way (even amid some political hyper-ventiliation about inflation risks of QE) to something a bit lower than in the pre-recession period. Perhaps this time is different. Perhaps nothing will deliver average inflation anywhere near that high in the next five years. But you might expect an inflation-targeting central bank to at least discuss the point, and the possibility that the combined weight of fiscal and monetary policy will mean a drift (in some ways welcome) to higher inflation as the world emerges from Covid – especially when, at least in economic terms, the Bank’s own chart shows New Zealand to be ahead of most on that score.

And yet there is no any sign from the minutes that the Committee even robustly discussed these issues – even though, for example, just a couple of weeks earlier the Bank of England’s Monetary Policy Committee (known not just for a better class of member, but – as importantly – for more transparency) voted only by a margin of 7:2 to keep on with their bond-buying programme (a programme smaller than New Zealand’s as a share of GDP, in an economy that has been further behind New Zealand’s recovery).

So what is appropriate New Zealand policy now? I find it simply extraordinary that the Bank is continuing on with its huge bond-buying programme as if nothing has changed at all. Not only that we are told that

The Committee agreed that the OCR is the preferred tool to respond to future economic developments in either direction.

They offer no rationale for this statement. It might make some sense if things were suddenly to get a lot worse, but it makes no sense at all from here – inflation at target, expectations consistent with that, unemployment below 5 per cent – either substantively, or in view of all the criticism (often misplaced) the Bank has taken of the LSAP (“money printing”, “blowing bubbles” and so on). As I noted on Twitter yesterday, in the Budget documents there is stable suggesting that the stock of settlement cash balances is expected to rise by tens of billions of dollars over coming year (presumably as bond buying goes on and Crown issuance is pulled back). That just invites more (reputational) problems as well as complicating the eventual unwind of the huge bond portfolio. So had it been me, I’d have been cutting the LSAP now, perhaps terminating it completely within the next three months (all going according to plan). But since I do not believe that the LSAP is making any material difference to anything that matters much in New Zealand – where long-term government bond rates mostly only affect government borrowing costs – I wouldn’t have seen that as any material tightening of monetary conditions. The Bank would of course, but on their numbers there is a good case now for beginning to wind back purchases (as a policy lever).

I wouldn’t favour winding back the FLP or raising the OCR yet, but the FLP should be the next in line (after the LSAP). It is a extraordinary intervention, inconsistent with the general preference for indirect competitively neutral tools. It had a place late last year, but the current macro data suggest it should not be too long for this world (and should not be needed in future downturns now that the RB is confident they can do negative OCRs).

Lest I appear too hawkish, I should add that my decision rule would not be the one the MPC outlined. After a decade or below-target core inflation I think we probably should welcome at least some overshoot, for some period, of the 2 per cent midpoint (in core terms), if only to help cement in the public mind that 2 per cent is a target midpoint and not a ceiling.

Perhaps too the Bank is wrong about the macro situation. Perhaps there is more spare capacity than they think, in the labour market and more generally. I don’t have a strong view on that, but see no reason to think them very wrong (and I noted with interest there was no mention of the potential impact of higher minimum wages and higher benefits on either labour demand or supply, or the NAIRU – but any such effect is likely to be for the worse.)

Everyone tends to fight the last war. The decade after 2008/09 was one when too often central bankers (often egged on by markets) kept over-estimating how much inflation there was in the system, and kept getting it wrong. Perhaps that is still where central banks should err, but I would feel more confident about it in the New Zealand context if there was more evidence of careful thought/analysis, or sustained and searching debate around the MPC table, and of serious public engagement by thoughtful MPC members open to exploring differences. As it is, there is a strong sense of “trust us, we know what we are doing”, with little real evidence that they do.

Am I really more hawkish (less dovish) than the Bank. It is still hard to be sure, but there are things about their numbers on the one hand, and their policy stance on the other, that really don’t seem to add up. These include small points like the difference (a few paragraphs apart in the minutes) about how long it make take for them to be confident: first there was this

They agreed this would require considerable time and patience.

and then just a little later this

The Committee agreed it will take time before these conditions are met.

Those seem to me rather different emphases – the latter perhaps plausible, the former distinctly (probably too) dovish.

(To the Bank’s credit – and not that it greatly matters to them or their deliberations – they do not share the unreasonably over-optimistic productivity growth assumptions built into The Treasury’s Budget numbers).

Finally, I was reading last week The Great Demographic Reversal: Ageing Societies, Waning Inequality, and an Inflation Revival published last year (mostly written pre-Covid) and written by Charles Goodhart and Manoj Pradhan. There is a summary version of the story here. I’m still not quite sure what to make of the story, but I’m less unpersuaded than I had expected to be. Perhaps they are wrong, but it would be good to see some thoughtful central bankers and policymakers engaging on the possibilities and risks.)

(a) real interest rates, and (b) NZers’ migration

No, I’m not getting back into some routine of daily posts, and on this occasion the two topics don’t even have anything to do with each other, but are just a couple of a leftovers from things I was looking at over the last couple of days.

In my fiscal posts this week I’ve noted that the government is consciously and deliberately choosing to run cyclically-adjusted primary fiscal deficits in the coming year larger (probably much larger) than we’ve seen at any time since the end of World War Two. I noted in passing that although people are conscious of stories of large fiscal deficits under Robert Muldoon’s stewardship, in fact a large chunk of those deficits was interest payments, and this in an era when inflation was high, sometimes very high. When nominal interest rates are high just to reflect high inflation, the resulting “interest payment” is really more akin to a principal repayment. Back in the day, various people – especially at the Reserve Bank – did some nice work inflation-adjusting various macro statistics.

But just to check my point I put together this graph

real NZ bond yield since 70

What have I done here?

  • got the OECD’s series for long-term nominal bond rates that goes back to 1970 (this will mostly be 10 year bonds or thereabouts, although for a time in the late 80s we were not issuing bonds that long),
  • for the period since 1993, subtracted the Reserve Bank’s sectoral factor model measure of core inflation,
  • for the period up to 1993, subtracted a three-year centred moving average of the CPI inflation rate.

So for almost entire period prior to 1984 real New Zealand government bond yields were negative.

This is, of course, not testimony to different patterns of desired savings and investment, but (mostly) to financial repression. Until 1983 government bond yields were administratively set and – much more importantly – most financial institutions were simply compelled by law to buy and hold government securities (often 25 per cent of more of total deposits). The costs were borne by depositors.

It is also worth noting that pre-1984 the government was also borrowing, at times heavily, directly from the retail market, at times offering real interest rates well above those shown here. And the government was also borrowing, again at times quite heavily, from abroad. In some of those markets, inflation was a big chunk of the headline interest rate, but in none of the major borrowing markets were government borrowing rates by then as repressed as they were still in New Zealand.

Finally, note that in the chart I have compared a 10 year bond yield to a one year inflation rate. But at least since 1995 we have had a direct read on real government bond yields through trading in government inflation indexed bonds. As this chart shows, the pattern over that period is very similar,

IIB yields since 95

Developments in the last few months are interesting, but that is something for another day.

My second brief topic this morning was sparked by a strange quite-long article in the New York Times yesterday headed “New Zealanders are Flooding Home: Will the Old Problems Push Them Back Out”. A lot of work seemed to have gone into it, and some of the individual anecdotes were not uninteresting (and in the small world that is New Zealand, one of the recent returnees was even someone I’d once worked with) but…….no one (do they have factcheckers at the NYT?) seemed to have stopped and checked the numbers. It took about two minutes to produce this graph that I put on Twitter yesterday.

NZ citizen migration

Using the official SNZ estimates, the problem with the story was that arrivals of New Zealanders had not really changed much at all – a bit higher than usual in the March 2020 year, and then lower than usual in the most recent year. There has, of course, been a big change in the net flow of New Zealand citizens but……..that is mostly the very steep fall in the number of New Zealanders leaving. That reduction – over the March 2021 year – is, of course, not surprising in the slightest given (a) travel restrictions to Australia for much of the year, and (b) travel restrictions and/or bad Covid in much of the rest of the world.

But, on official estimates, there simply is no flood of New Zealanders returning home. None.

This morning I looked a little more closely, and dug out the quarterly (seasonally adjusted) version of the data.

nz citizen migration quarterly

It is, of course, much the same picture, but what surprised me a little was the upsurge in (estimated) arrivals back in late 2019, pre-Covid. Here it is worth remembering that until a couple of years ago our PLT migration data was based on reported intentions at the time of arrival, but the 12/16 approach now used looks at what actually happened. It looks as though some New Zealanders who had come to New Zealand in late 2019, probably not intending to stay, ended up doing so, voluntarily or otherwise, once Covid hit. So they are now recorded as migrant arrivals in late 2019 even though at the time they would not have thought of themselves as such.

But it does not change the picture: there is no flood, or even a little surge now, in returning New Zealanders. A problem with the 12/16 approach is that the most recent data is prone to quite significant revisions (and that is particularly a risk when the normal patterns the models use aren’t likely to be holding, but there is nothing to suggest there is a significant influx of returning New Zealanders happening.

There will be always be natives who’ve spent time abroad returning home. It happens even in rather poor and downtrodden countries, and it happens here – always has, probably always will. That adjustment isn’t always that easy, plenty of people often aren’t sure for a long time that they’ve made the right choice. Covid means a few different factors have influenced some of those choices for some people. But there is no “flood”, just a similar to usual (or perhaps now smaller than usual) number of returnees, coming back to a New Zealand of extraordinarily high house prices and productivity levels and incomes that increasingly lag behind a growing number of advanced economies. Those persistent failures – and the indifference of our main political parties – should be worth a story. But not the non-existent flood.

A bit more on fiscal policy

In yesterday’s post I outlined some of my concerns about the government’s Budget, from a macroeconomic perspective. Not only did it seem to be built on rather optimistic medium-term economic assumptions, but several years out – on current policy advised to it by the government – The Treasury still expects a fairly significant cyclically-adjusted primary deficit (which means, once finance costs are added in, a larger-still overall cyclically-adjusted deficit).

CAB primary

There was a good case for such deficits last year, and perhaps even in the year that ends next month. But there is no obvious macroeconomic reason for running larger deficits in this coming year, and still having cyclically-adjusted deficits four years hence (by which time The Treasury numbers project a non-trivial positive output gap). It is now simply a splurge – a government that, unnecessarily, is simply choosing to take on more debt to fund its new spending, rather than fund core operating spending with taxes. In a climate when risks abound.

And all this is an environment where fiscal policy now appears to be unanchored by any specific fiscal goals a government is committing itself too.

I’ve never been one of those who put huge weight on the Fiscal Responsibility Act 1994, now (as amended) incorporated as Part 2 of the Public Finance Act. There are some good aspects to the legislation but I was never really convinced that asking governments to set out their specific short and long-term fiscal objectives, or articulating in statute “principles of responsible fiscal management” would make much difference to anything that mattered about the conduct of fiscal policy. (Here is a post on the 30th anniversary of the Public Finance Act critiquing some rather over the top claims then made for the framework.) In my take, there was a shared commitment across the main parties to balanced budgets (in normal times) and low debt, and the legislation reflected that rather than driving it.

And I guess I take this year’s Budget as vindication of that stance. There was a shared commitment to such things, and now it appears there is not. And the legislation still sits on the books, lonely and overlooked. Check out the requirements of Part 2 of the Public Finance Act, and then compare it with this year’s Budget documents. In particular, have a look at the statutory principles for responsible fiscal management, and the requirements that a Fiscal Strategy Report brought down on Budget day has to contain outlining both short-term and long-term fiscal objectives.

And then go and check out the vestigial thing the Fiscal Strategy Report appears to have become. Here is the statement of the government’s fiscal intentions.

fiscal intentions 21

Take the long-term intentions first (if you can find them). For debt, the government offers no numbers at all – either as to the level they aim to first stabilise the debt at or the longer-term level they would aim to then reduce it to (not even whether that level is higher or lower than the current level). Not even anything conditional on, say, us avoiding future Covid outbreaks and new lockdowns.

And then what about the operating balance? Well, they assure us they will run an operating balance consistent with the long-term debt objective, but (a) isn’t that obvious?, and (b) it tells us nothing at all, since they give us no medium to long term debt objective. And all the rest of it is equally or more vacuous. Now, sure, the Act does not formally require the government to put numbers on their objectives in these areas, but I’m pretty sure the drafters of the Act – the Parliament that passed it – did not think that simply stating “we’ll do whatever we like to pursue our political objectives” (all that “productive, sustainable and inclusive economy” mantra) would meet the bill. The whole section of the Act is rendered empty and futile.

It is even worse when we get to the short-term intentions. The Act is somewhat more prescriptive there

short term fiscal

And there is simply none of that content at all.   No objectives, no serious discussion reconciling with the (non-existent) long-term objectives, and just this explanation for why the government is (for now anyway) abandoning the statutory principles for responsible fiscal management

Doing so in this case for the short-term operating balance intention is the right thing to do, given the unprecedented size of the global economic shock caused by COVID-19 and the need for the Government to provide a strong ongoing fiscal response to protect lives and livelihoods in New Zealand as we secure the economic recovery. 

But as I suggested yesterday, that argument probably made sense (at least the first half) at the time of last year’s Budget and FSR. It doesn’t today when New Zealand’s unemployment rate is under 5 per cent.

There is no rationale – grounded in the Act – no analysis, and no short or medium goals. Simply structural deficits for years to come (see first chart above) – discretionary deficits actively chosen by today’s government larger than any such cyclically-adjusted deficits run in New Zealand at any time since at least the end of World War Two. It hasn’t been the New Zealand way. But it appears to be so now.

As I noted yesterday, maybe it will all come right. Maybe Robertson and Ardern really are at heart a bit more responsible than this Budget suggests and future new spending splurges (which are, I guess, what one expects from a party whose MPs and leader have now taken to openly calling themselves “socialists”) will be funded by persuading the electorate to stump up with increased taxes.

But bad fiscal outcomes – high debt, and little obvious prospect of reversals – don’t arise overnight. And the sort of thing that concerns me is what has happened in some other advanced countries. Here are the cyclically-adjusted primary balances for the US, the UK, and Japan. Remember, a positive number should be a bare minimum for prudent fiscal management (higher the higher are your accumulated debts and the prevailing real interest rate).

uk and us balances

30 years each had relatively low levels of government debt (OECD data for net general government liabilities as per cent of GDP), the UK and Japan in particular. And now they are all among the OECD countries with the highest levels of (net) public debt.

It can happen here too. And if those on the left are celebrating this week their own government “breaking free” of the shackles, they need to remember that political fortunes come and go. The other parties will form governments again, and the precedent this government is setting may guide them in how constrained they feel about increasing spending or cutting taxes or whatever (see the US as an example). In a floating exchange rate economy the disciplines on fiscal policy are more political than market in nature. If your party believes in bigger government, that’s a choice but then insist that bigger government means higher taxes. If your party believes in much lower taxes, that too is a choice, but then insist that smaller revenue have to mean much lower spending. But don’t toss out the window a hard-won consensus around balanced budgets and low public debt – one of the few real achievements of the last 30 years – and substitute for it feel-good politics (whether from the left or right) that avoids confronting choices about who will pay.

I’m still reluctant to believe that Robertson is quite as reckless as this Budget suggests, but for now at least the evidence is tilting against my optimistic prior. And, disconcertingly, there isn’t much sign of the Opposition calling him out.

This, incidentally, is the sort of analysis and discussion that a Fiscal Council provides in many countries.

A questionable Budget

As far as I can see reaction to last week’s Budget seems to be split between those on the government side who thought it was great – in some cases just a start – and on the other side of politics those noting that there was no sign of any sort of plan or set of policies that might lift the economy’s productivity performance, and in turn lift the capacity – whether or individuals or governments – to spend on personal or collective priorities. Those critics are, of course, right.

But what I really wanted to focus on in this post is the size of the deficit the government is choosing to run.

Little more than four years ago the Labour and Green parties published the Budget Responsibility Rules that, they told us, would guide them should they take office (I wrote about them here). They were seeking to persuade us that in office they would prove to be responsible macroeconomic and fiscal managers.

The first of the rules they offered up was this one.

BRR1

Note especially that second sentence: they expected to be in surplus every year “unless there is a significant natural event or a major economic shock of crisis”. Pursuing other policy priorities wasn’t going to be an excuse either: if they thought they needed to spend more on this or that, they’d fund it by taxes.

It sounded pretty good.

Even before Covid, if they were sticking to their own “rules” it is was a pretty close run thing. In the HYEFU for December 2019, for example, the total Crown OBEGAL measure in (very) slightly in deficit was for 2019/20 and exactly in balance in 2020/21. The same set of forecasts showed the economy running just a bit above potential in those two years. It wasn’t exactly the spirit of the Budget Responsibility Rules.

And then, of course, Covid came along. I don’t think anyone is going to dispute the idea that deficits (even large deficits) made sense for much of last calendar year, particularly to support the incomes of those unable to work because of lockdowns etc, Not many people are disputing the case for the wage subsidy, and of course when people couldn’t work and businesses couldn’t trade tax revenue was also going to be down. You’ll recall that the worst of all that was in the March and June quarters of last year (part of the fiscal year 2019/20). Consistent with that core Crown expenses in 2019/20 was 34.4 per cent GDP, compared with 28 per cent the year previously. Whichever deficit measure you prefer, the 2019/20 deficit was large. And few will quibble about much of that.

Right now we are coming to the end of the fiscal year 2020/21. Wage subsidies and similar measures have been used at very stages, especially early in year.

But as everyone also knows, the economy has bounced back more strongly that most (including me) had expected – notably, much faster than the official agencies had forecast. It is, of course, entirely right to note that the borders are still largely closed, global supply chains are disrupted, and prospects in parts of the wider world still look pretty shaky. On the other hand, the terms of trade are doing really well. In total, Treasury does the forecasts, and they reckon that when we finally get the nominal GDP data for the year to June 2021 it won’t be much different in total than they had thought back in late 2019 pre-Covid. The comparison is a little unfair, since there were some historical SNZ base revisions, but they also reckoned (when they did the forecasts in late March and early April) that the June quarter unemployment rate this year would be less than 1 percentage point higher than they’d been forecasting for that date back in late 2019.

That’s great, something to celebrate. But it doesn’t have the look or feel of a “major economic shock or crisis” – Labour’s 2017 words. There was one, especially in the first half of last year, but from a whole economy perspective it has an increasingly been a stretch to make such a case as 2020/21 drew on. And yet core Crown expenses in 2020/21 are expected to have been 33.1 per cent of GDP, not much lower than in the previous year, and more big deficits have been racked up.

But 2020/21 is really water under the bridge now. There is only five weeks of that year to go, and the Budget is about policy for 2021/22 (in particular) and beyond.

And in 2021/22 not only is the government planning to run large deficits but ones that even larger than those for 2020/21. The Budget documents this year were rather light on the analytical material that Treasury usually publishes, but they put in this year a chart of the cyclically-adjusted primary balance.

CAB primary

Cyclical-adjustment here involves Treasury adjusting for the state of the economic cycle (recessions dampen tax revenue quite a bit and raise spending a bit, as the automatic stabilisers play out). In this chart, the Treasury also exclude the EQC/Southern Response Canterbury earthquake costs. And the primary balance excludes finance costs – it is a standard measure used in fiscal analysis, with a common rule of thumb being that if your primary balance is positive, at least you aren’t borrowing simply to pay the interest on the accumulated debt. Labour’s 2017 commitment re surpluses would have implied running positive primary balances almost every year.

There were significant cyclically-adjusted primary deficits in the years following the 2008/09 recession – the twin consequence of the fiscal splurge at the end of the previous Labour government’s term and the unexpected (by Treasury, whose forecasts governments use) shortfall in potential output. But those cyclically-adjusted deficits over 2010-2012 look small by comparison with the deficit the current government plans to run in 2021/22 (and still smaller than what they are planning for next year).

Perhaps you might think the state of the economy in some sense warrants this, but (a) recall that these are cyclically-adjusted numbers, and (b) check out the state of the economy in the two periods. Over the coming year Treasury expects an average output gap of 1.7 per cent of GDP, coming back to zero in 2022/23. They expect the unemployment rate to be about 5 per cent next June, dropping to around (their view of the NAIRU) 4.4 per cent the following June. By contrast, Treasury now estimates that the output gaps in the 2012/13 and 2013/14 years were each around 1.5 per cent, and the unemployment rate in both years was also higher than they expect in the next two years.

What about some longer-term perspectives? I can’t see a Treasury version of this series going further back but (a) the OECD publishes estimates of the cyclically-adjusted primary balance at a general government level, and (b) the Treasury has primary balance (not cyclically adjusted) back to 1972. Neither series is fully comparable – the OECD numbers aren’t done on an accrual basis, and include local government (but it is small in New Zealand), and the older Treasury numbers aren’t cyclically adjusted. But together they can still create a useful picture.

Here is the OECD chart, back to 1989

CAB OECD

Cyclically-adjusted primary surpluses have been the New Zealand norm in modern times – even (a propaganda line Grant Robertson could have chosen to use, but preferred not to for obvious reasons) in 1990.

And here is the not cyclically-adjusted primary balance numbers back to the year to March 1972, using the data from the Treasury’s long-term fiscal time series.

Tsy primary balance

Note that although these numbers are not cyclically-adjusted, even in quite severe recessions the cyclical-adjustment procedure Treasury uses makes a difference of less than 2 percentage points of GDP.

So, one might reasonably note that over the next couple of years when, on Treasury’s numbers, the economy will be running increasingly close to full employment, the government is choosing – wholly as a matter of discretionary policy – to run a primary deficit bigger than any that have been run in the past 50 years, with the exception only of the accrual effect of the government’s EQC obligations post-Christchurch, obligations that were not discretionary or voluntary at that point. To be pointed, one might reasonably note that the primary deficits are (far) larger than any run under Robert Muldoon’s stewardship (the first two years on the chart, as well as 1976-84), and are in contrast to the primary surpluses run in every single year of the Lange/Palmer/Douglas and Clark/Cullen eras.

(What about those big Muldoon era deficits you keep reading about? Actually, a huge chunk of that was interest costs, and much of that was just inflation – real interest rates themselves were often quite low. Another way of looking at the issue is an inflation-adjustment to the deficits.)

It seems like pretty irresponsible opportunistic fiscal policy to me. It is certainly inconsistent with those mostly-admirable Budget Responsibility Rules Labour campaigned on – since not only are they running large deficits with no macroeconomic crisis, but debt is above their own targets.

Of course, from supporters of the government I expect there will be two responses.

The first might be to celebrate – Robertson and Ardern have thrown off the shackles, scrapping (as they formally have) any references to surpluses or balances budgets now or in the future. What is not to like, surpluses or balanced budgets being things for people like Clark, Cullen, Kirk, and Rowling, but not for our brave new leaders. After all, don’t we know that interest rates are low – even if long-term rates now are no lower than they were pre-Covid. If so, it is a dangerous path they are treading: their cyclically-adjusted primary balance outlook now looks a lot more like the sort of ill-disciplined approach to fiscal management we’ve seen in places like the UK, the US, and Japan over recent years. That was already underway with the various permanent fiscal measures the government put in place as early as last March (under the guise of a Covid package) and has continued since.

The second, more moderate, stance might be to acknowledge my point but to argue that (a) the economy is only doing as well as it is because of macroeconomic stimulus, and (b) better fiscal policy than monetary policy. I’m not going to dispute that policy stimulus is likely to have helped achieve the welcome economic rebound, and (more specifically) if the government had taken steps in this Budget to (say) cut the cyclically-adjusted primary deficit to 2 per cent of GDP in 2021/22, closing to zero the following year (while reserving the need for possible fresh intervention if Covid got loose here), the economic outlook would – all else equal – be worse than is portrayed in The Treasury’s forecasts.

But all is not equal. The primary tool for macroeconomic stabilisation is monetary policy. A tighter fiscal policy – getting back to balance quickly now that last year’s shock has passed – would naturally and normally be offset by monetary policy, doing its job. The Bank stuffed up going into Covid and wasn’t then able to take the OCR negative (or so it claimed), but even they tell us that is an issue no longer. For those who believe in the potency of the LSAP – and I think all the evidence is against it – there is that tool too. And the beauty of monetary policy is threefold:

  • it costs the taxpayer precisely nothing (relative price shift instead and those best placed to respond do),
  • it can be adjusted very quickly as the outlook and circumstances change, and
  • using monetary policy tends to lower the exchange rate while reliance on fiscal policy feeds an overvalued exchange rate, skewing the economy further inwards.

Monetary policy is, of course, no good at income relief. That is what fiscal policy did so well last year. But that was last year’s need not – as Treasury’s forecasts – the need now or for the next couple of years.

My unease about the Budget is not helped when I dug into some of the macroeconomic numbers.

For example, The Treasury’s forecasts for growth in the population of working age show expected growth in the five years to June 2024 exactly the same now as in the projections for the 2019 HYEFU. Perhaps, but it seems a bit of a stretch, when we know – from Customs data – that there has been a significant net outflow of people (migrants, tourists, New Zealanders, foreigners) over the last 17 months.

And then there are the Treasury’s productivity growth assumptions that seem heroic at best.

productivity growth budget 21

And this even though their text explicitly refers to some degree of permanent “scarring” as a result of Covid. Perhaps they could enlighten us as to what about the economic environment or economic policy framework is likely to generate such strong productivity growth (by New Zealand standards) in the next few years? Covid isn’t something the government can do much about, but nothing else in their policy programme now or in recent years seems likely to begin to reverse the lamentable New Zealand productivity performance. Without that productivity growth, future revenue growth would also be weaker than this Budget is built on.

It isn’t as if The Treasury expect business investment to soar. At best The Treasury seems to think we limp back to the rates of business investment seen in the previous half decade (when the Governor of the Reserve Bank was exhorting firms to invest more, as if he knew better than them where the profit opportunities lay).

bus investment 21

And then there is one of my favourite, but sad, charts

export import shares

Exports and import shares of GDP both rebound, of course, but only to settle at even lower levels than we’ve seen in New Zealand for decades. Successful economies tend to be ones that are exporting successfully lots of stuff to the rest of world and importing lots of stuff from the rest of the world. That isn’t New Zealand. But then we haven’t been a successful economy for a long time now.

Perhaps fiscal policy will come out okay in the end. But when the government isn’t expecting to be back in cyclically-adjusted primary surplus even by 2025, and when the medium-term economic projections seem to rest on some rather rosy assumptions (these and others), it is difficult to be optimistic. Thirty years of sound fiscal management – one of the few real successes New Zealand economic managers could claim – looks to be at risk. And yet the grim fiscal outlook seems to have had astonishingly little coverage, as if last year’s (appropriate) mega-deficit numbers have disoriented people so far that they’ve lost interest in the hard slog of delivering balanced (cyclically-adjusted) budgets. The appropriate size of government – perhaps even the appropriate degree of dependence on government – is rightly the stuff of political debate, but what is spent should be paid for, not simply grabbed from the population – reducing their future spending options – without the normal political conversations around what tax rates are tolerable and acceptable.

Much better analysis needed

That heading probably describes a great deal of what goes on in the numerous public policy agencies in the central Wellington (well, no doubt local authorities as well) but this post is about the Reserve Bank’s latest.

Last week they released a paper headed “An overview of the distributional effects of monetary policy”. It was under the name of one their young analysts, and carries a standard disclaimer that “views expressed are those of the authors, and do not necessarily represent the views of the Reserve Bank”, but we can safely discount that. No paper on a topic this potentially contentious is going to have got out the door without the explicit imprimatur of (a) the author’s manager, (b) the Reserve Bank’s Chief Economist (that voiceless government-appointed member of the MPC, from whom we’ve had not a single speech in his entire time in office), and most probably the clearance and comfort of the Governor and the Assistant Governor responsible for monetary policy. If the (apparently largely toothless) external members of the MPC didn’t get to sign it off, equally it isn’t likely that it would have been published if they’d had any major concerns. All in all, it is only reasonable to take this document as the official view of the Bank’s hierarchy, reflecting that same hierarchy’s view of acceptable standards of analysis and argument.

It is a strange and inadequate document in a variety of ways. First, and perhaps least important, is the spin. In the previous paragraph I gave you the official, and rather neutrally expressed, title of the Analytical Not. But if you were signed up to the Bank’s email notification service you got this at the head of the email from one of their myriad comms staff.

AN211

Immediately followed by this sentence, which doesn’t appear in the Analytical Note itself, and is clearly the responsibility of the more politicised part of the Bank.

There are winners and losers when interest rates are cut, but the international evidence is not clear that this always means the rich get richer and the poor are worse off.

Note that “always”. Whoever wrote this seemed to have in their mind – or to want to feed into readers’ minds – a sense that “when interest rates are cut” it is mostly – just not “always” – a bad thing in which, typically, “the rich” get richer and “the poor” get poorer. It is about the standard one expects from a Year 10 Social Studies teacher, not from those actually charged with the conduct of the country’s monetary policy.

I didn’t want to skip over the spin, because it tells you about the standards of those at the top of the organisation. But in the end it is spin, and on this narrow point the Analytical Note itself is less bad. It is doesn’t contain those block-quoted words at all, and in fact the very first sentences of the paper, highlighted as Key Findings are

Monetary policy easing and tightening can potentially affect the distribution of wealth and income through
several channels. The overall effect of monetary policy on inequality is indeterminate and depends on the
strength of each channel, which may reinforce or offset each other.

Much less inflammatory. It is followed by the second Key Finding

International empirical evidence on the distributional effects of monetary policy is inconclusive. It is not clear
that monetary policy easing, be it through reductions in policy interest rates or by central bank asset
purchases, necessarily reduces or worsens wealth inequality and income inequality.

In other words, not the slightest suggestion that mostly – if not “always” – interest rate cuts make the rich richer and poor poorer.

I haven’t read all, or probably even most, of the international empirical studies they summarise here

AN212

and there is not even a hint of any Reserve Bank of New Zealand empirical research in the Analytical Note, so my comments in the rest of the post are really about how the Bank discusses the issues, and the evidence that reveals for how carefully and comprehensively they think through things. It isn’t a long paper – about five pages of text – but that is their choice: unlike say the Monetary Policy Statement (where we might expect this to be touched on next week) there was no practical limit to them taking just as much space as they thought was needed to give a careful treatment of the issue.

There are plenty of individually reasonable sentences in the paper, and a variety of charts (several designed to show that distributions of income/wealth in New Zealand are similar to some of the other countries that formal studies have been done for). The problem is the lack of a disciplined framework.

For example, it isn’t even clear whether what they are focused on is monetary policy actions – which they (and their models) usually conceptualise as discretionary actions taking as given developments in the (changing and not directly observable) neutral or natural rate of interest – or all changes in interest rates. There is a huge difference in the two.

Twenty five years ago, very long-term real interest rates in New Zealand (eg), proxied by indexed bond yields, were touching 6 per cent, and now they are just under 1 per cent (about the same as they were just prior to Covid). Understanding why real interest rates have fallen that far – and similar trends are evident in other countries – or even why our real interest rates are still quite a bit higher than in most advanced countries – is a challenging and contested issue. Understanding the full implications isn’t that easy either. But few seriously suppose that the cause is monetary policy – and the Reserve Bank (in all its past published material) has never been among those few. One can debate the relative contributions of demographics, productivity growth slowdowns, or whatever – again, both causes and implications – but they aren’t things that have anything more than the most peripheral connection to monetary policy as typically conceived (as conceived by Parliament in setting out the Bank’s powers and mandate).

Now, there can be some confusion in the general public mind because if the longer-term neutral real interest rate falls from 6 per cent to 1 per cent then – given that the Reserve Bank chooses to peg the OCR (it needn’t, but it generally a sensible and practical way to conduct policy – over time the Bank will need to cut the OCR by more or less the same amount. Those adjustments are announced as part of Monetary Policy Statements and OCR reviews undertaken by the Monetary Policy Committee. But if you are wanting to think and talk about the impact of monetary policy choices – and much of this discussion, at least in a New Zealand context, has been sparked by events of the last year – you want to talk about discretionary monetary policy actions: things the Bank thinks it is doing to push actual interest rates below (or above for that matter) what it thinks of at the time as the neutral rate. Anything else just conflates two quite different things. And since long-term interest rates will move about whether or not we have an active central bank, while discretionary monetary policy is a choice, if we are thinking about what value discretionary monetary policy adds we – and the Bank – should focus on the implications (all of them) of those discretionary choices.

So one of the other things that is almost entirely missing from the Analytical Note is any sense that discretionary monetary policy actions are temporary in nature. Monetary policy is about keeping unemployment as low as possible consistent with inflation staying in check (that isn’t quite the way the law is written but it is what it amounts to, and is a better framing). Most of the shocks that monetary policy responds to – although this distinction isn’t made in the paper either – are what are thought of as “demand shocks”: some events, perhaps a slump in overseas economic activity, weakens demand, activity and employment here, tending to push unemployment up and inflation down. Monetary policy is about leaning against those pressures with the aim of getting back to a full employment/inflation at target outcome faster than otherwise. But these are temporary events. As the unemployment rate gets back to sustainable/full levels, you want interest rates to be back around neutral. The temporary nature of monetary policy actions is consistent (a) with a standard view of the long-run neutrality of money (in the long run, monetary policy can affect inflation, but not materially anything else), and (b) the experience in past decades, when short-term rates went and down, through quite large cycles. The Bank’s note acknowledges this point in passing in discussing the overseas papers but not in discussing New Zealand.

There is also no discussion in the Analytical Note of the difference other regulatory regimes may make. Thus, if you are bothered by house prices developments – as you probably should be – you might want to recognise that house prices behave differently when governments intervene to restrict land use and make new building harder and slower than in markets where new land and housing supply is more responsive. But even here there is an important distinction that the Bank’s paper just does not make: even if you believe that monetary policy developments in the last year have contributed materially to the recent further rise in house prices, unless you think that Covid has driven the neutral interest rate materially lower, those effects should be short-term in nature. If you are one of those who, for example, think that within the next 12-18 months the OCR will be back to where it was at the start of last year. you should presumably think that any monetary policy effects on house prices will also be short-lived. The Bank however – not noted in this paper, but quietly in MPSs and FSRs – thinks the biggest long-term issue is land use law. If so – and assuming such regimes influence expectations and how markets react to demand shocks – they shouldn’t be taking responsibility themselves for higher house prices. Lets have some analysis on the distributional effects of land use restrictions, but you wouldn’t really expect that to be coming from the Reserve Bank – or for the Bank somehow to be taking the blame for medium-term changes in a key relative price (as it seems to by implication in, for example, the brief discussion of Figure 6).

Perhaps worse, there is almost no mention in the Analytical Note as to how the characteristics of the initial adverse shock might influence conclusions, and very little mention (I think only one) of counterfactuals – what might have happened if, given the neutral rate, monetary policy had done nothing in response to these shocks. For example, even just to take house prices again, in the last New Zealand recession house prices fell quite a bit, and if discretionary monetary policy actions limited those falls – as seems plausible and likely, directly and indirectly – I guess one think of monetary policy making home owners “richer”, but really it is simply limiting losses in those specific circumstances. And strangely there is no mention of any of the past actual monetary policy cycles in New Zealand – lots of high level handwaving but not much engagements with the specific experiences. Same goes for share prices – in this episode they are higher than they were at the start but in, say, 2008/09 it took five years for the nominal NZSE50 index to get back to the pre-recession peak. Monetary policy limited losses – in much the same way it did in the labour market – but that generally isn’t regarded as troubling, so much as the point of having the tool in the first place.

In a New Zealand context in particular, it was very odd to see no discussion of the exchange rate. In most discretionary monetary policy cycles in New Zealand, the exchange rate has done a lot of the adjustment (down and up). Over the last year or so that hasn’t been so – then again, monetary policy hasn’t done much – but surely any serious discussion of distributional effects of monetary policy in New Zealand would want to think about the exchange rate channel?

One could go on. For example, they suggest that older people are wealthier than younger cohorts, and while perhaps that is conventional it takes no account of human capital (by far the largest source of lifetime wealth for most people). And although they do talk about the labour market and unemployment it is all curiously bloodless – involuntary unemployment is a great social evil and can scar the prospects of some people for life, and so if – as it claims – monetary policy can assist in getting unemployment back down more quickly to the structural rate (while keeping inflation in check), that is a huge gain that a central bank should be shouting from the rafters, not burying in a discussion that seems overwhelmed by what has happened to house prices – monetary policy or not – in one recession in five.

Perhaps in fairness to the Bank one should repeat a couple of their concluding remarks.

In the absence of formal empirical evidence, we emphasise that we do not take a stance on how monetary policy actions by the Reserve Bank of New Zealand influence these distributions.

While noting that they could have done much more in these document to help frame discussion of the issues. And

The study of the distributional effects of monetary policy in New Zealand remains an avenue for future research. This Note is the first in a series of analytical papers that the Reserve Bank will publish in this domain.

I guess I will look forward to any future papers, but this scene-setting Analytical Note doesn’t leave one very optimistic about the overall quality of what they are likely to come up with. We deserve better: the Bank has the largest collection of macroeconomists in the country, its claim to operational autonomy really rests on perceptions of technical expertise, and yet – for what are not remotely new issues – so far this seems to be the best the Orr Bank can come up with. It simply isn’t good enough.

At least 60 per cent

Dating back to before they took office in 2017, Labour’s stance on New Zealand immigration policy hasn’t been particularly clear. There was the 2017 policy, announced under then-leader Andrew Little, that was sold as being likely to make a big difference, but once one looked into the details (see link earlier in the sentence) it was clear it was designed not to do so. But then the leader changed, and little was heard of the policy on the campaign trail (people close to Labour told me that Ardern had made clear that she wasn’t that keen on the policy). Labour and New Zealand First then became government, explicitly agreeing to operate on Labour’s immigration policy, but apparently – so a NZ First minister told me – with an agreement to revisit the policy mid-term. If so, not that much of substance ever seemed to flow from that, although in early 2019 there was (ill-advertised) agreement in principle to changes down the track in how the residence programme was designed and run.

Then, of course, Covid intervened. There hasn’t been much non-citizen immigration at all since then, but no one envisaged that as a permanent model. And, of course, Labour secured an absolute majority at the last election, and selected a new Minister of Immigration.

Last month, the government finally got round to asking the Productivity Commission to do an inquiry into immigration policy. (I say “finally” because whether or not one approves of something like the current approach to immigration policy, that policy has clearly been one of the largest government economic policy interventions over several decades now, and the evidence-base around the economic effects of this large intervention, in the specific circumstances of the New Zealand economy, is disconcertingly light.) But then we are given to understand that the government has made up its mind anyway (which is, of course, their right as the elected government, but seems an odd ordering, when you’ve been in government for getting on for four years).

Here was the Prime Minister in her speech last week (emphasis added)

In terms of immigration going forward, last week we announced that the Productivity Commission will hold an inquiry into New Zealand’s immigration settings.

The inquiry will focus on immigration policy as a means of improving productivity in a way that better supports the overall well-being of New Zealanders.

The inquiry will enable us to optimise our immigration settings by taking a system-wide view, including the impact of immigration on the labour market, housing and associated infrastructure, and the natural environment.

This will sit aside existing work being led by the Immigration Minister around reforms to temporary work visas and a review of the Skilled Migrant Category visa.

In fact this Monday Minister Faafoi will be outlining the case for change in New Zealand’s immigration policy in a speech in Wellington.

But let me be clear. The Government is looking to shift the balance away from low-skilled work, towards attracting high-skilled migrants and addressing genuine skills shortages in order to improve productivity.

So I looked forward to reading the Faafoi speech, with interest tinged with scepticism. Specially invited guests, some from out of town, must have looked forward to it too – even if for some their interest might have been tinged with apprehension. There are a lot of champions of large-scale non-citizen immigration out there – from the Green Party (who seem keen on importing supermarket workers) to much of the “big end” of town.

As it happens, Mr Faafoi was apparently sick yesterday, and so the Minister for Economic Development Stuart Nash got the job of reading Faafoi’s speech, and was reportedly then unable to answer most questions.

The speech itself seemed to have been downgraded – the PM had trailed it as making the “case for change”, but the minister’s heading was simply “Setting the Scene”. But it was barely even that. I guess we came away with the message that “we are determined not to return to the pre-Covid status quo”, but there was almost nothing of the how – no specifics at all – and very little, in any sustained sense, about the why. There was no evidence in the speech of any rigorous thinking, analysis or research from officials – the sort of work one might normally hope for (especially for a government four years in) in advance of policy decisions and announcements. Particularly unkind observers suggested that the speech was more in the nature of “an announcement about an announcement”, of the sort that has become all too familiar. In fact, we were told that “we’ll be engaging with you [who?] over the coming months to test our thinking”, suggesting there just isn’t much there yet.

And I say all this as someone who might, possibly, be somewhat sympathetic to some elements of the broad direction the government might be heading in around immigration (even while being highly sceptical of Stuart Nash’s statist centralised approach to business and the economy, and prone to scoff every time I read another reference to the vaunted Industry Transformation Plans, in which bureaucrats take the lead in (purporting to) shaping the future of one industry after another (a tourism one got a mention last night)).

There isn’t much point trying to unpick Faafoi/Nash’s speech bullet point by bullet point (for some unaccountable reason it appears on the Beehive website with every sentence a bullet point). But in this post I just wanted to address a claim made in the speech.

High levels of migration have contributed to 30 per cent of New Zealand’s total population growth since the early 1990s.

The “early 90s” is not only when the current broad approach to immigration was being introduced, but it is also when the current official population series begins.

Now I’m sure that one of the first things MBIE officials tell each Minister of Immigration is that to talk of “migration” isn’t very helpful in a policy context. There are inflows and outflows of New Zealanders and non-New Zealanders and the only bit policy controls is about the movement of non-citizens (arrivals, and departures for those on limited term visas). So in a speech on immigration policy, one might expect that the Minister of Immigration would focus his analysis on the movement of non-citizens. And that offers a quite different picture than the one Faafoi/Nash painted in the speech.

Here is a chart showing net non-citizen migration as a percentage of New Zealand’s population growth for each calendar year from 1991 to 2019 (I left off 2020 because the net migration numbers for that year are still estimates and the SNZ model for estimating these things for very recent periods isn’t great in normal times, yet alone Covid times)

non-citizen contrib

Not even in 1991 was the contribution of non-citizen net migration quite as low as 30 per cent, and 1993 was the last time the contribution (to a first approximation, the contribution of immigration policy) was below 60 per cent. Of the year to year variation, some represents variation in the number of non-New Zealand migrants, but much represents variability in the (net) out-migration choices of New Zealanders (mostly to Australia).

There are plenty of people who will think the numbers in the chart are a good thing. I don’t, given what we know about the continuing long-run bleak underperformance of the New Zealand economy. But whether or not you welcome these trends, they are the (relatively) hard data. For decades now – well, prior to Covid – New Zealand’s pace of population growth, which is among the highest of the OECD countries, has been largely an immigration-policy-driven phenomenon. No OECD country envisages a larger share of population growth coming from non-citizen immigration, and most envisage a far smaller share. And if anything, these data are likely to understate the true population consequences of immigration, since the median migrant tends to be relatively younger, and the children of those migrants – themselves New Zealand citizens – will have further contributed to the growth of the population.

Rapid (policy-led) population growth in such a remote location appears to have impeded the prospects for any reversal of the decades of productivity underperformance. It has skewed the economy inwards, persistently overvaluing the real exchange rate and thus crowding out potential export industries. Wage growth in New Zealand has been weak, but that isn’t directly some immigration phenomenon – such discussions, including the Minister’s, consistently ignore the demand effects of high immigration – and the data show that, for the economy as a whole, wage growth has tended to run quite a bit ahead of growth in the economy’s earnings capacity (nominal GDP per hour worked).

When the government finally gets round to specifics one can only hope their policy decisions are based on better analysis, including the some robust economic analysis of the specific New Zealand experience, than was evident in the speech last night.

And when the champions of mass-migration splutter at the general thrust of the government’s aspirations, perhaps they might offer some thoughts on what it is about New Zealand that means that – in their view – we need to be uniquely heavily dependent on large scale non-citizen immigration.

Productivity growth: failures and successes

As a parent I find it particularly disheartening to observe the near-complete indifference of governments and major political parties that might hope to form governments to the atrocious productivity performance of the New Zealand economy. If the last National government was bad, the Labour or Labour-led governments since 2017 have been worse. It is hard to think of a single thing they’ve done to improve the climate for market-driven business investment and productivity growth, and easy to identify a growing list of things that worsen the outlook – most individually probably quite small effects, but the cumulative direction is pretty clear. Before I had kids I used to idly talk about not encouraging any I had to stay in New Zealand, so relatively poor were the prospects becoming. It is harder to take that stance when it is real young people one enjoys being around, but…..at least from an economic perspective New Zealand looks like an ever-worse option, increasingly an inward-looking backwater.

One of the ways of seeing the utter failure – the indifference, the betrayal of New Zealanders – is to look at the growing list of countries that are either moving past us, or fast approaching us. Recall that for 50 years or more New Zealand was among the handful of very highest income countries on earth.

For doing those comparisons I prefer to focus on measures of real GDP per hour worked, compared using purchasing power parity (PPP) exchange rates. It is, broadly speaking, a measure of how much value is being added by firms – mostly in the private sector – for each unit of labour those firms are deploying. Real GDP per capita can be useful for some purposes – actual material living standards comparisons – but can be greatly, directly, affected, by demographics, in ways that don’t reveal much about the performance of the economy and the environment for business investment.

When I run charts here about productivity comparisons across countries I mostly use OECD data. Most – but not quite all – of what we think of as advanced economies are in the OECD (as well as a few new entrants that aren’t very advanced at all, and seem like “diversity hires”, incidentally making New Zealand look a bit less bad in “whole of OECD” comparisons). But once in a while I check out the Conference Board’s Total Economy Database, which has a smaller range of series for a rather wider range of countries, advanced and emerging. The latest update was out a few weeks ago.

As regular readers know I have highlighted from time to time the eastern and central European OECD countries – all Communist-run until about 1989 – that were catching or moving past us. I first noticed this when I helped write the 2025 Taskforce’s report – remember, the idea that we might close the gaps to Australia by 2025, when in fact policy indifference has meant they’ve kept widening – in 2009, so that must have been data for 2007 or 2008. Back then only Slovenia had matched us, and they were (a) small and (b) just over the border from Italy and Austria. The OECD and Conference Board numbers are slightly different, but by now probably four of the eight have matched or exceeded us (and all eight managed faster productivity growth than us over the last cycle). Turkey – also in the OECD – has also now passed us.

But what about the central and eastern European countries that aren’t in the OECD? As I glanced down the tables I remembered a post I’d written four years ago about Romania and comparisons with New Zealand’s economic performance. Romania had been achieving quite strong productivity growth prompting me to note

….one of the once-richest countries of the world is on course for having Romania, almost a byword in instability, repression etc for so many decades, catch us up.  It would take a while if current trends continue.  But not that long. Simply extrapolating the relative performance of just the last decade (and they had a very nasty recession in 2008/09 during that time) about another 20 years.

So how have things been going?

romania 21

Even if we focus just on the last hard pre-Covid estimate (for 2019) they were up to about 84 per cent of average New Zealand labour productivity. If these trends continue, they’d catch us by about the end of the decade.

To be clear, it is generally a good thing when other countries succeed. It is great that these central and eastern European countries moved out from the shadow of the USSR and non-market economies and are now achieving substantial lifts in living standards. The point of the comparisons is not to begrudge their successes – which have a long way still to run to match most of western Europe – but to highlight the failure New Zealand governments have presided over. We were richer than all these countries for almost all of modern New Zealand history, and soon our economy will be less productive than all or most of them. We were also richer and better off than most or all of today’s most productive advanced economies, and now we just trail in the their wake. Even as the most productive advanced economies have experienced a marked slowing in their productivity growth in the last 15 years or so

prod growth advanced

we’ve really only managed little more than to track their slowdown – and recall that the median of these countries has average labour productivity two-thirds higher than New Zealand’s so – as in the central and eastern European countries – there were big gaps that might have been closed somewhat. Most of those countries did so, but not New Zealand.

To revert to Romania for a moment, it is not as if it is without its challenges. It ranks about 55th on the World Bank’s ease of doing business index, and has been slipping down that ranking (although still doing very well on a couple of components). Corruption seems to be a major problem. The neighbours aren’t the best either – including Ukraine and Moldova. Reading the latest IMF report (pre-Covid) there were signs of some looming macro imbalances but the latest IMF forecasts suggests a pretty optimistic outlook still, including investment as a share of GDP climbing back to about 25 per cent of GDP. Perhaps something is going to derail that productivity convergence (with New Zealand) story but it isn’t there in the forecasts at present. And if corruption has to be a drag of some sort (but how large can that effect be?) government spending and revenue are both smaller as a share of GDP than in New Zealand.

In GDP per capita terms the picture (Romania vs New Zealand) is not quite as grim. That mostly reflects differences in hours worked

Romania hrs

Some of that is demographics, some not. Either way, hours worked are an input – a cost – not (mostly) a good thing in their own right. New Zealand struggles to maintain upper middle income living standards for the population as a whole by working a lot more hours (per capita) than many other advanced countries.

And then of course there is the difference that must be quite uncomfortable for the political and bureaucratic champions of “big New Zealand” – those politicians (both sides) just champing at the bit to get our population growing rapidly again.

romania popn

Romania is a pretty big country. When this chart started it had almost six times our population. 25 years on Romania’s population is a bit under four times ours. I mentioned earlier the investment share of GDP: Romania’s is averaging a little higher than ours, even with these massive population growth (shrinkage) differences, so just imagine how much more of those investment resources are going to deepen capital per worker (even public infrastructure per citizen). (For those interested the total fertility rates of the two countries are now very similar: the differences in trend population growth are largely down to immigration/emigration.)

Now, of course, I haven’t mentioned being in the EU or being located not too far from many of the most productive economies on earth (although Bucharest to Zurich isn’t much less than the distance Wellington to Sydney). Those are advantages. Of course they are. But then why do New Zealand officials and policymakers continue to champion a (now) purely policy-driven “big New Zealand” when (a) almost nothing has gone right for that story in (at least) the last 25 years, and (b) when so much else of policy choices only reduces the likelihood of the future under such a strategy being any better?

Romania really is a success story, and I’d like to understand a bit better why (for example) it has been doing so much better than Bulgaria and Serbia. But it isn’t an isolated success story: in addition to the OECD eastern and central European economies, Croatia isn’t doing too badly either.

But – and taking a much longer span – this chart still surprised me. It draws on different database – the Maddison Project collection of historical real GDP per capita data. Since it is per capita data it includes all those differences in hours worked per capita (data which simply isn’t available for most countries in the distant past). I’ve started in 1875 simply because that is when the Romania data start. I’ve shown only the countries for which there is 1875 data (the last observations are 2016 simply because that is when this particular database stops), with the exception of China and India which I’ve added in for illustrative purposes because there are a couple of estimates for years between 1870 and 1887 which I’ve simply interpolated. The chart shows the ratio of real per capita incomes in 2016 as a ratio of those in 1875.

romania maddison

Best of them all. New Zealand not so much (and yes we were about the top of the class in 1875, but the New Zealand story is submergence not convergence, given how many of these countries are now richer than us).

To be clear, over the last 140+ years New Zealand has been a far better – safer, more prosperous, fairer, more open – country in which to live than Romania. Whether it will still be so for most the next century is increasingly a very open question. Our politicians seem unconcerned, and if any of them have private concerns they do nothing about them – no serious policies in government, so no serious policy reform options in Opposition. Nothing. They seem to just prefer nothing more than the occasional ritual mention.

Still on matters productivity, I finished reading last night an excellent new book on productivity: Fully Grown: Why a Stagnant Economy is a Sign of Success by Dietrich Vollrath, a professor of economics at the University of Houston. It is incredibly clearly written, and is a superb introduction to economic growth and productivity for anyone interested (I”ll be commending it to my son who has just started university economics). I’m not really persuaded by his story about the US, but it is well worth reading if you want to think about these issues as they apply to one of the highest productivity economies on earth. It suffers (as so many US books) do from being exclusively US-focused, even though there is a range of northern European economies with productivity levels very similar to (a bit above, a bit below) those in the US and one might think that their data, their experiences, might be a cross-check on some of his stories. To be clear, his focus is on a frontier economy, not ones – whether New Zealand or the central and east European ones, or even the UK and Australia – which start so far inside the frontier. But it is a very good introduction to how to think about sum of the issues, and a summary of many of the papers that the research-rich US economy generates.

Banks, housing lending, and fixing housing

In my post yesterday about the Reserve Bank’s FSR and the subsequent press conference conducted by the Deputy Governor I included this

The sprawling burble continued with questions about whether banks should lend more to things other than housing – one veteran journalist apparently being exercised that a large private bank had freely made choices that meant 69 per cent of its loan were for houses. Instead of simply pushing back and noting that how banks ran their businesses and which borrowers they lend to, for what purposes, was really a matter for them and their shareholders – subject, of course, to overall Reserve Bank capital requirements – we got handwringing about New Zealand savings choices etc etc, none of which – even if there were any analytical foundation to it – has anything to do with the Bank. 

Someone got in touch about the 69 per cent line and suggested that it must be a sign of something being wrong, going on to suggest that the Reserve Bank’s capital framework and associated risk weights was skewing lending away from agricultural and (in particular) business lending.

My summary response was as follows:

I guess where I would come close to your stance is to say that if we had a properly functioning land market producing price/income ratios across the country in the 3-4 range (as seen in much of the US, incl big fast-growing cities) then the share of ANZ’s loan book accounted for by housing lending would be much less than 69%, and in fact the total size of their balance sheet would be much smaller.  But my take on that is that the high share of housing loans is largely a reflection of central and local govt choices that drive land prices artificially high, and then we need financial intermediaries for (in effect) the old to lend to the young to enable houses to be bought.  The fault isn’t the ANZ’s and given the capital requirements in NZ there is little sign that the overall balance sheet is especially risky, and therefore should not be of particular interest to the RB (except perhaps in a diagnostic sense, understanding why balance sheets are as they are).  I’m (much) less persuaded that there is a problem with the (relative) risk weights, given that every comparative exercise suggests that our housing weights are among the very highest anywhere (and, in effect, rising further in October).

But to elaborate a bit (and shift the focus from one particular bank) across the depository corporations as a whole (banks and non-banks) loans for housing are about 62 per cent of total Private Sector Credit (and total loans to households are about 64 per cent). A large chunk of the balance sheets of our financial intermediaries are accounted made up of loans for housing.

The gist of my response was that that shouldn’t surprise us at all, given the insanity of the land use restrictions that central and local government impose on us, rendering artificially scarce – and expensive – something of which there is an abundance in New Zealand: land. If, from the perspective of the economy as a whole, relatively young people are buying houses from relatively old people (or from developers) the higher house/land prices are the more housing credit there needs to be on one side of banks’ collective balance sheets and – simultaneously – the more deposits on the other. If median house prices averaged (say) $300000 – as they do in much of the (richer) US – there would be a great deal less housing credit in total.

One other way to look at the stock of housing credit is to compare it to GDP – in effect, all the economic value-added in the entire country. Since the GDP series is quarterly and the credit data are monthly, I haven’t shown a full time series chart here. The data start from December 1990, and then only for an aggregate of housing+personal loans (but personal loans are small in New Zealand). So I’ve shown lending to households in Dec 1990, in mid-97 (roughly the peak of the business cycle), Dec 2007 and Dec 2019 (two more business cycle peaks), and March 21 (for which we have credit data, but only an estimate for GDP).

lending to households

There was a huge increase in the stock of lending, as a share of (annualised) GDP over the first 17 years of the series. What I’ve long found interesting is how little change there was over the following full business cycle (there were ups and downs in between the dates shown), and then we’ve had a bit of a step up in the last year or so (and even if house prices stay at this level, future turnover will tend to further increase housing debt expressed as a share of GDP).

Since real house prices have more than tripled since 1990 it is hardly surprising the stock of housing debt (share of GDP) has increased hugely. Were real house prices to, for example, halve then we might over time expect to see the stock of housing debt drift gradually back – it could take decades – towards say the 1997 sort of number.

Implicit in the journalist’s comment was a suggestion that lending to housing somehow limits how much lending banks do for other things. That generally will not be so. Banks (as a whole) are generally not funding-constrained – not only do loans create deposits (at a system level) but international funding markets are available (and used to be very heavily used, when NZ had large current account deficits). Of course, there is only so much capital devoted to New Zealand banking at any one time, but in normal circumstances capital flows towards opportunities.

But what has the empirical record been? The Reserve Bank publishes data for business lending from banks/NBDTs (which isn’t all business borrowing by any means – between funding from parents and the corporate bond market) and for agricultural lending.

Here is how the full picture looks

sec lending

For what it is worth, intermediated lending to business in March was exactly the same as a share of GDP as it was in December 1990. For younger readers, December 1990 was just a couple of years into banks working through the massive corporate debt overhang that had built up in the few years immediately following liberalisation. Farm credit, of course, has increased very substantially – again particularly over the years leading up to 2007/08 with the wave of dairy conversions and higher land prices.

On the business side of things, it is worth bearing in mind that business lending (share of GDP) was consistently weak throughout the last business cycle. Some will argue that banks had some sort of structural bias against business but even if so (a) over that decade or so there was no growth in the stock of housing lending as a share of GDP, and (b) there is little compelling evidence that systematic and large unexploited profit opportunities were going begging over that decade. It seems more likely that the markets – including banks – financed the profitable opportunities that were around, but there just weren’t many of them.

So my story remains one that if central and local government were to free up land markets and house price to income ratios dropped back to, say, 3-4 then over time the stock of housing debt (share of GDP) would shrink, a lot. There are some stories on which much cheaper house prices generate fresh waves of business entrepreneurship etc with workers able to flock to those opportunities, but I don’t find those stories convincing in New Zealand (in the aggregate). But simply repressing the financial system some more – the agenda the Reserve Bank and the government have been pursuing for several years now – will not change those business opportunities one iota.

(This post hasn’t tried to deal with the riskiness of the housing loans. My take on that is really the same as the Reserve Bank’s – at least when it isn’t champing at the bit to intervene. Capital requirements (and actual ratios) are high – materially higher than they were – and they are calculated in a fairly conservative way, with risk weights on housing that are fairly high, including by international standards. For what it is worth, the ratings issued by the agencies seemed aligned with that interpretation. )

That we have such a large share of total credit for housing isn’t, prima facie, a banking system problem – banks will follow the opportunities that (in this case) bureaucratic distortions create, and our central bank has demanding capital standards and in APRA one of the better banking regulators around – but rather just another indicator of how warped our housing market has been allowed – by governments – to become. But we knew that already. In fact, governments knew it to, but they prefer to try to paper over cracks, hide behind ever more pervasive RB controls, rather than tackle the core issue.

On which note, a couple of months ago the Wellington magazine Capital asked if I would contribute an article on what might be done to fix the housing market, with a Wellington focus. I wasn’t really familiar with the magazine – having previously seen it only in hairdressers, takeaway outlets and the like, for readers to glance through while they wait – but I said yes, and looking through the edition I picked up this week it looks like a mix of fairly geeky material (eg a whole article on lead-rubber bearings) and the lifestyle stuff.

Since I didn’t give them my copyright, many readers are out of Wellington. and the issue with my article seems to have been on sale for a while now here is the piece I contributed.

Free up the land: unravelling the unnatural housing disaster

Michael Reddell[1]

April 2020

New Zealand house prices, even adjusted for inflation, have more than tripled over the last 30 years.  The persistent trend was unmistakeable even before the latest surges.   Million-dollar houses were once the rare exception in Wellington, but now are almost the norm in too many suburbs.  The Wellington region median house price is now perhaps 10 times median income, putting home ownership increasingly beyond the reach of an ever-larger share of those in their 20s and 30s.

Most of the talk is loosely about “house” prices but what has really skyrocketed is the price of land in and around our urban areas; whether land under existing dwellings, or potentially developable land.  And this in a country with so much land that all our urban areas cover only about 1 per cent of New Zealand.

It is scandalous, perhaps especially because it is an entirely human-made disaster.   Land isn’t scarce, and hasn’t become naturally much more scarce, even as the population has grown.  Instead, central and local governments together have put tight restrictions on land use.  They release land for housing only slowly and make it artificially scarce, not just in and around our bigger cities but often around quite small towns.   And if there is sometimes a tendency to suggest it is “just what happens”, citing absurdly expensive (but much bigger) cities such as Melbourne, San Francisco or Vancouver, nothing about what has gone on is inevitable or “natural”.   

The best way to see this is to look at the experience in the United States, where there are huge regions of the country – often including big and growing cities – where price to income ratios are consistently under 4.    Little Rock, for example, is the state capital of Arkansas. It has a growing metropolitan population of just under 900,000, and a median house price of about NZ$300,000 –  little changed, after allowing for inflation, over 40 years.    The US also helps illustrate why it is wrong to (as many do) blame low interest rates:  not only are interest rates the same in both San Francisco and Little Rock, but US longer-term real interest rates are typically a bit lower than those in New Zealand.  The same goes for tax arguments: they have much the same tax code in both the high-priced growing US cities as in (much) more affordable ones.  High real house prices are a policy choice;  not necessarily the desired outcome of central and local government politicians, but the inevitable outcome of the land use restrictions they choose to maintain.

Both central and local government politicians sometimes talk a good game about making housing more affordable, but neither group seems to have grasped that in almost any market aggressive competition among suppliers is what keeps prices low.   People sometimes suggest there isn’t enough competition among, for example, supermarkets or building products suppliers, but if we really want widely-affordable housing again in New Zealand what we need is landowners aggressively competing with each other to get their land brought into development.  And that has to mean an end to local councils deciding where they think development should happen, whether within the existing footprint of a city or on its periphery.    We need a presumptive right for owners to build, perhaps to two or three storeys, on any land (and, of course, councils need to continue to be able to charge for connecting to, for example, water and sewerage networks).   It could be done now.  That it isn’t tells us that councils are the problem not the solution.  Too many –  including in Wellington –  seems to think it is their role to use policy so that in future lots of people are living in townhouses and apartments, even as experience suggests that what most (but not all) New Zealanders want, for most of their lives, is a place with a backyard and garden.  And they seem to fail to understand that simply allowing a bit more urban density, perhaps in response to a build-up of population pressure, hasn’t been a path anywhere else to lowering house prices. Instead, such selective rezoning simply tends to underpin the price of those particular pieces of land. 

Sometimes people suggest that even if this sort of approach would be viable in Hamilton or Palmerston North, it isn’t in rugged Wellington.    But as anyone who has ever flown into or out of Wellington knows there is a huge amount of undeveloped land in greater Wellington.    And if the next best alternative use should be what determines the value of land that could be used for housing, much of the land around greater Wellington simply does not have a very high value in alternative uses (not much of it is prime dairying or horticulture land).  Unimproved land around greater Wellington should really be quite cheap, although the rugged terrain would still add cost to  developing it to the point of being ready to build.

Some worry about, for example, the possibility of increased emissions.  But once we have a well-functioning ETS the physical footprint of cities doesn’t change total emissions, just the carbon price consistent with the emissions cap.  And for those who worry about traffic congestion, congestion charging is a proven tool abroad, which should be adopted in Wellington (and Auckland).

I’m not championing any one style of living.  The mix between densely-packed townhouses and apartments on the one hand, and more traditional suburban homes on the other, shouldn’t be determined by the biases and preferences of politicians and officials but by the preferences of individuals and families, exposed to the true economic costs of those preferences.  Similarly, policymakers should respect the (changing) preferences of groups of existing landowners what development can, or cannot, occur on their land.

The behaviour of councils over many years reveals them as, in practice, the enemies of the sort of widely-affordable housing which the market would readily provide (as it does in much of the US).  If councils won’t free up the land, to facilitate the aggressive competition among land providers that would keep prices low, central government needs to act to take away the blocking power of local councillors.

And this need not be the work of decades.  Of course, it takes time to build more houses, but the biggest single element of the housing policy failure is land prices. Once the land use rules look as though will be freed up a lot, expectations about future land prices will adjust pretty quickly, and prices will start falling.   We could be the boutique capital city with widely-affordable housing.  The only real obstacles are those who hold office in central and (especially) local government.


[1] Michael Reddell was formerly a senior official at the Reserve Bank, and also worked at The Treasury and as New Zealand’s representative on the board of the International Monetary Fund. These days, in additional to being a semi-retired homemaker, he writes about economic policy and related issues at http://www.croakingcassandra.com

Lacking in serious analysis, not well-grounded in law

Yesterday was the Reserve Bank’s six-monthly Financial Stability Report. It might these days almost be almost better labelled the “Make the financial system ever less efficient report”, and with little real challenge or scrutiny from the assembled media.

With the Governor off sick it was left to the Deputy Governor Geoff Bascand to front the press conference. He seemed ill-at-ease and a bit uncomfortable in the spotlight – surprising in one who has held senior positions for so long – and often offered answers that were longwinded without actually saying much.

One of the questions he was asked on several occasions was about the reforms announced last week, and whether they reduced or increased the powers of the Minister of Finance and/or the Bank when it came to imposing direct controls on lending. Bascand never once answered the questions directly, delivering lines about how the new law would provide “greater clarity” but in what he said, and in what he didn’t say, he more or less confirmed the interpretation I ran in a post last week that the de facto powers of the Minister will be reduced – since the Minister will have no say on which tools the Bank can use, whereas under the ad hoc convention of the last decade the macroprudential Memorandum of Understanding between the Bank and the Minister governed that. Under the planned new legislation the Minister will be able to stop the Bank putting in place controls on broad classes of lending (eg residential mortgages) but at least under this government that will be an empty power, since the government is already content with the Bank having LVR restrictions, and the Bank will be free to apply any other controls it likes, whenever it likes. You might think that is a good thing. The Bank probably does. But it hands over much too much power to an unelected unaccountable Board.

But what I really wanted to focus on in this post was the area the Bank itself (and much of the media coverage) focused on: housing. 

You would barely get the idea from any of the material that the Bank has no responsibility for housing at all.  Its financial regulatory powers over banks have to be exercised to promote the maintenance of a sound and efficient the financial system.   And that is pretty much it.     The government is in the process of reforming the law to downplay the efficiency dimension, but (a) the law today is as it is, and (b) even under their new law the focus is supposed to be on the soundness of the financial system.   A couple of months ago, as is his right, the Minister of Finance issued a direction to the Bank requiring them to “have regard to” this government policy:

But this direction alters neither the statutory purposes the Bank must exercise its powers for, nor alters the Bank’s statutory powers.   The Governor promised that the Bank would explain quite what import this section 68b direction actually had, but it appears that that would have been embarrassing or awkward, because no such explanation is offered or attempted in the FSR.  In fact, they both misrepresent the substance of the direction, and then do more than suggest that it “aligns well with the Reserve Bank’s objective to promote the maintenance of a sound and efficient financial system”.   But bear in mind that not even the Cabinet paper that discussed this direction (and the equally empty change to the monetary policy Remit) envisaged much effect on anything much.

So we are simply left with those twin goals of maintaining a sound and efficient financial system.    But amid all their talk of housing financing restrictions, old, new, and foreshadowed, there is barely a mention of the efficiency of the financial system.   Which is probably just as well (for them) as there is no conceivable way that there most recent restrictions, described here, do anything but seriously impede the efficiency of the financial system.

The Bank hasn’t even attempted to make an efficiency case for almost completely banning any loans to residential rental property providers in excess of 60 per cent of the value of the property (all the while allowing much easier access to credit for owner-occupiers). If there are any real differences in the riskiness of such loans, not already factored into pricing and capital requirements, they are small relative to these differences in rules. So what we have isn’t a set of rules that is about either soundness (which capital requirements already manage) or efficiency – in a banking system that has proved itself robust over many years – but purely political interventions, resting on no sound statutory foundations, to attempt to skew the playing field in the housing market, consistent with Labour Party wishes and political preferences. Thanks to the Reserve Bank the market in houses will function less well, and the market in housing finance will be much less efficient and effective (and that without even addressing the “new homes” carve-outs, which again are all about politics and not at all about risk – new developments tend to be riskier – or efficiency).

Now, on a good day there are still some shreds of economic rationality and logic buried somewhere in the Bank. Deep in the FSR we find this good paragraph

I especially liked that slightly desperate footnote “see it isn’t only us”.

Now the Reserve Bank can’t fix any of that stuff – it is all about central and and local government failure – but they are nonetheless quite happy to operate beyond their legitimate sphere and powers to feed a government narrative and paper over symptoms. providing aid and comfort to the government doing little to get to the heart of the issue (the government that disavows any suggestion that perhaps house/land prices should fall). But that’s Orr for you.

Now perhaps you are thinking “but isn’t the financial system imperilled by these higher house/land prices?” Well, the Bank itself doesn’t think so and in the rest of the report they are at pains to stress how resilient the system is, how sound the banks are – even while being just about to resume their never-well-justified drive to push further up capital ratios that are, in effect, already among the very highest in the world. At the press conference, the Bank was at pains to note that the system could cope quite well with even a large fall in house prices. The Deputy Governor rightly highlighted that if prices fell recent borrowers might be in a difficult position, especially if for some reason the unemployment rate was to rise a lot at the same time but…….that simply isn’t a financial system soundness issue.

Much of the discussion in the document and in the press conference etc was about what fresh horrors – housing finance interventions – the Reserve Bank might be cooking up, in league with the government. Unsurprisingly perhaps – since they’ve wanted this tool for years – their preference seems to a debt to income limit (or a series of them, perhaps further impairing the efficiency of the system by picking favourites). Even the Bank seems to recognise that LVR limits are already so tight, especially on residential rental providers, that it might be embarrassingly inconsistent with their mandate to go further, and (sensibly) they don’t seem at all keen on banning interest-only mortgages. It is all a bit hypothetical at present – since as they note the latest LVR controls only came into effect last week – but there is no stopping a bureaucrat with an agenda (Bascand used to be regarded as a fairly pro-market economist), so we heard lots of talk about what they’d be prepared to do “if needed”. There were no criteria outlined for what might warrant further interventions, let alone criteria grounded in the Bank’s act. It really was handwaving stuff, of the sort we might once have been familiar with under people like Walter Nash or the later Muldoon.

You will note that the Minister’s direction referred to the government’s desire to support “more sustainable house prices”. The Bank has picked up that line and has clearly been toying with how to give it substance – but appeared to have made little or not progress, one of their staff even suggesting it was a new phrase and there wasn’t much research around about it. All the FSR itself says is this

FSR 21 2

And that’s it. And it didn’t seem to have taken them far. Bascand claimed to be optimistic that in time the Bank would be in a position to opine regularly on whether house/land prices were above, below, or close to sustainable levels, but he offered no real hint of what he thought sustainability might mean in this context, let alone attempting to tie it back to the Bank’s actual role, around the soundness of the system. For now – clearly keen not to get out of step with his political masters – he couldn’t even bring himself to suggest that lower house prices would be a good thing, although for some reason he did claim (on RNZ this morning) that a gradual fall would be better than a sharp one (offering no clue on why the death from a thousand cuts might be preferable, and for whom).

And, from the few hints he offered, his concept of sustainability seemed idiosyncratic to say the least. Apparently if the population was trending up it was okay for house prices to rise and stay up – quite why was never stated (and he ran this population line several times). We heard a lot about interest rates, but no real suggestion as to why low long-term global neutral interest rates supposedly mean higher house prices (they don’t seem to in much of the US, places where it is easy to bring land into development). It was just a muddle. I guess he couldn’t bring himself to say that no sustained fall in house/land prices was likely unless/until the government sorted out the regulatory dysfunction around land use, nor could he easily own up to the fact that if such laws seemed set to remain problematic then, with well-capitalised banks, what was any of this to do with the Reserve Bank.

It really was all over the place, not well-grounded in any of the Bank’s statutory roles, and yet…….these are the people the government wants to hand more discretionary power to, to further mess up access to finance. It was all too characteristic of the pervasive decline in the quality of policymakers (political and official) and policy advisory institutions in this country.

The sprawling burble continued with questions about whether banks should lend more to things other than housing – one veteran journalist apparently being exercised that a large private bank had freely made choices that meant 69 per cent of its loan were for houses. Instead of simply pushing back and noting that how banks ran their businesses and which borrowers they lend to, for what purposes, was really a matter for them and their shareholders – subject, of course, to overall Reserve Bank capital requirements – we got handwringing about New Zealand savings choices etc etc, none of which – even if there were any analytical foundation to it – has anything to do with the Bank. (He did, in fairness, note that there wasn’t much sign of strong business credit demand.) But I guess once you start down the path of the highly regulatory and intrusive state, it is hard to get free of the tar baby – in fact, bureaucratic life then selects for the sort of people who relish this stuff.

On a quite different topic, there was a box in the FSR on what was described as “Maori access to capital”. The Bank has apparently decided that, with no evidence whatever that there are distinctive Maori issues around either monetary policy or financial stability, to spend scarce public resources promoting this sort of stuff. Again, it is all highly non-analytical – no sense, for example, of why these ill-identified so-called Maori issues (in the ambit of the Bank’s functions) might be different than those of (say) ethnic Indians or Chinese, Catholics or atheists, left-handers, ethnic Samoans, women, men or whoever. It is all just a political whim, pursuing the personal ideological agendas of the Governor and at least some of his senior management (one of his offsiders has an extraordinarily political speech out this morning).

Anyway, we are told that

This work aims to use the Te Ao Māori strategy to incorporate a long-term, intergenerational view of wellbeing into the Reserve Bank’s core functions. It will also inform the Reserve Bank’s financial inclusion work and the allocative efficiency elements of its monetary policy and financial stability mandates. The Reserve Bank is treating this work as a high priority within its strategic work programme.

So with no serious problem identification, no serious grounding in the Bank’s statutory functions (which incidentally have no “intergenerational” character at all) all this is – in the Governor’s view – a high priority use of scarce public resources.

One can’t help feel that the Bank’s core functions might be in need of any spare resources they happen to have.