Taxes, housing, and economic underperformance

Two local articles on possible tax system/housing connections caught my eye this morning.  One I had quite a lot of sympathy with (and I’ll come back to it), but the other not so much.

On Newsroom, Bernard Hickey has a piece lamenting what he describes in his headline as “Our economically cancerous addiction”.    The phrase isn’t used in the body of the article, but there is this reference: “our national obsession with property investment”.   Bernard argues that the tax treatment of housing “explains much of our [economic]underperformance as a country over the past quarter century”, linking the tax treatment of housing to such indicators (favourites of mine) as low rates of business investment and lagging productivity growth.

Centrepiece of his argument is this chart from the Tax Working Group’s (TWG) discussion document released last week.

TWG chart

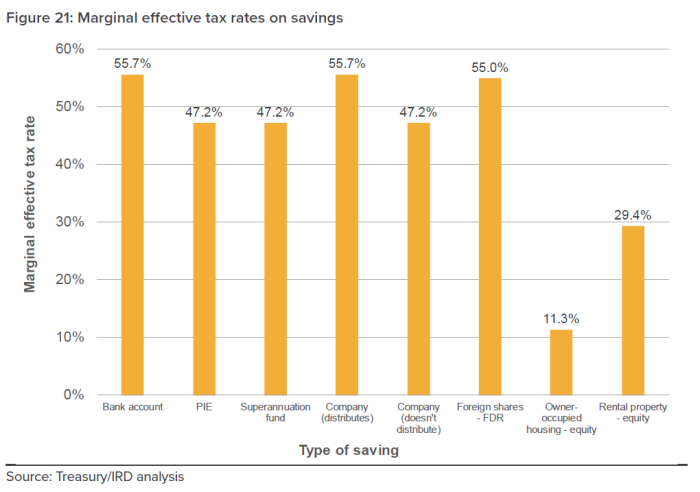
Note that, although the label does not say so, this is an attempt to represent the tax rate on real (inflation-adjusted) returns.

It is a variant of one of Treasury’s favourite charts, that they’ve been reproducing in various places for at least a decade.   The TWG themselves don’t seem to make a great deal of it –  partly because, as they note, their terms of reference preclude them from looking at the tax-treatment of owner-occupied housing.  They correctly note –  although don’t use the words –  the gross injustice of taxing the full value of interest income when a large chunk of interest earnings these days is just compensation for inflation, not a gain in purchasing power at all.   And, importantly, the owner-occupied numbers relate only to the equity in houses, but most people get into the housing market by taking on a very large amount of debt.  Since interest on debt to purchase an owner-occupied house isn’t tax-deductible –  matching the fact that the implicit rental income from living in the house isn’t taxed –  any ‘distortion’ at point of entering the market is much less than implied here.

Bear in mind too that very few countries tax owner-occupied housing as many economists would prefer. In some (notably the US) there is even provision to deduct interest on the mortgage for your owner-occupied house.   You –  or Bernard, or the TOP Party –  might dislike that treatment, but it is pretty widespread (and thus likely to reflect some embedded wisdom).  And, as a reminder, owner-occupation rates have been dropping quite substantially over the last few decades –  quite likely a bit further when the latest census results come out.  Perhaps a different tax system would lead more old people –  with lots of equity in a larger house – to downsize and relocate, but it isn’t really clear why that would be a socially desirable outcome, when maintaining ties to, and involvement in, a local community is often something people value,  and which is good for their physical and mental health.

So, let’s set the owner-occupied bit of the chart aside.  It is simply implausible that the tax treatment of owner-occupied houses –  being broadly similar to that elsewhere –  explains anything much about our economic underperformance.  And, as Bernard notes, it isn’t even as if, in any identifiable sense, we’ve devoted too many real resources to housebuilding (given the population growth).

So what about the tax treatment of rental properties?   Across the whole country, and across time, any distortion arises largely from the failure to inflation-index the tax system.  Even in a well-functioning land market, the median property is likely to maintain its real value over time (ie rising at around CPI inflation).  In principle, that gain shouldn’t be taxed –  but it is certainly unjust, and inefficient, to tax the equivalent component of the interest return on a term deposit.     Interest is deductible on rental property mortgages, but (because of inflation) too much is deductible –  ideally only the real interest rate component should be.  On the other hand, in one of the previous government’s ad hoc policy changes, depreciation is not deductible any longer, even though buildings (though not the land) do depreciate.

But, here’s the thing.  In a tolerably well-functioning market, tax changes that benefit one sort of asset over others get capitalised into the price of assets pretty quickly.  We saw that last year, for example, in the US stock market as corporate tax cuts loomed.

And the broad outline of the current tax treatment of rental properties isn’t exactly new.  We’ve never had a full capital gains tax.  We’ve never inflation-adjusted the amount of interest expense that can be deducted.  And if anything the policy changes in the last couple of decades have probaby reduced the extent to which rental properties might have been tax-favoured:

  • we’ve markedly reduced New Zealand’s average inflation rate,
  • we tightened depreciation rules and then eliminated depreciation deductions altogether,
  • the PIE regime – introduced a decade or so ago –  had the effect of favouring institutional investments over individual investor held assets (as many rental properties are),
  • the two year “brightline test” was introduced, a version of a capital gains tax (with no ability to offset losses),
  • and that test is now being extend to five years.

If anything, tax policy changes have reduced the relative attractiveness of investment properties (and one could add the new discriminatory LVR controls as well, for debt-financed holders).  All else equal, the price potential investors will have been willing to pay will have been reduced, relative to other bidders.

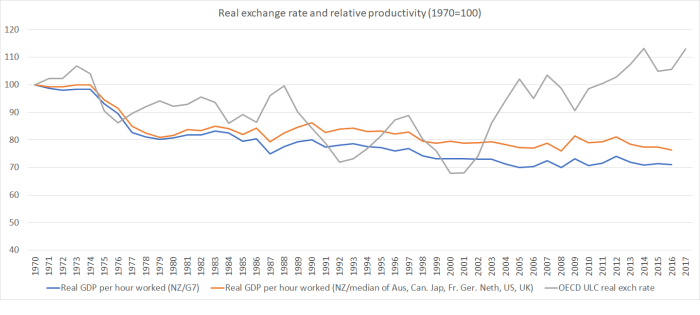
And yet, according to Bernard Hickey

It largely explains why we are such poor savers and have run current account deficits that built up our net foreign debt to over 55 percent of GDP. That constant drive to suck in funds from overseas to pump them into property values has helped make our currency structurally higher than it needed to be.

I don’t buy it (even if there are bits of the argument that might sound a bit similar to reasoning I use).

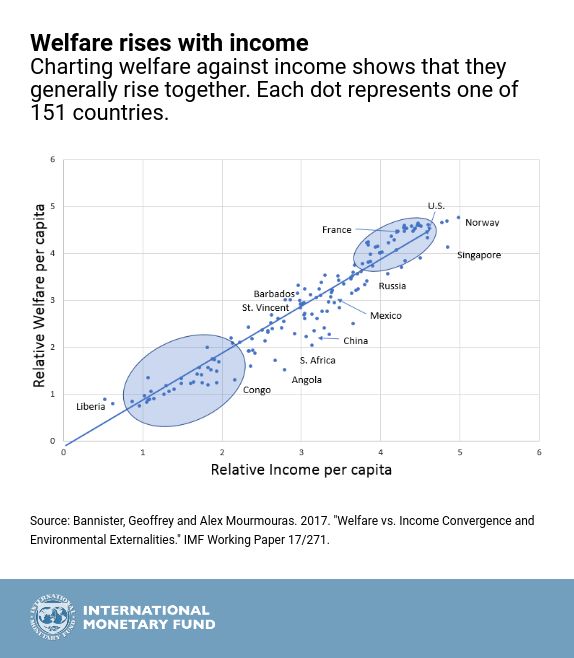
A capital gains tax is the thing aspired to in many circles, including the Labour Party.   Bernard appears to support that push, noting in his article that we have (economically) fallen behind

other countries such as Australia, Britain and the United States (which all have capital gains taxes).

There might be a “fairness” argument for a capital gains tax, but there isn’t much of an efficiency one (changes in real asset prices will mostly reflect “news” –  stuff that isn’t readily (if at all) forecastable).   And there isn’t any obvious sign that the housing markets of Australia and Britain –  or the coasts of the US –  are working any better than New Zealand’s, despite the presence of a capital gains tax in each of those countries.   If the housing market outcomes are very similar, despite differences in tax policies, and yet the housing channel is how this huge adverse effect on productivity etc is supposed to have arisen, it is almost logically impossible for our tax treatment of houses to explain to any material extent the differences in longer-term economic performance.

And, as a reminder, borrowing to buy a house –  even at ridiculous levels of prices –  does not add to the net indebtedness of the country (the NIIP figures).  Each buyer (and borrower) is matched by a seller.  The buyer might take on a new large mortgage, but the seller has to do something with the proceeds.  They might pay down a mortgage, or they might have the proceeds put in a term deposit.    House price inflation –  and the things that give rise to it –  only result in a larger negative NIIP position if there is an associated increase in domestic spending.  The classic argument –  which the Reserve Bank used to make much of –  was about “wealth effects”: people feel wealthier as a result of higher house prices and spend more.

But here is a chart I’ve shown previously

net savings to nni jan 18

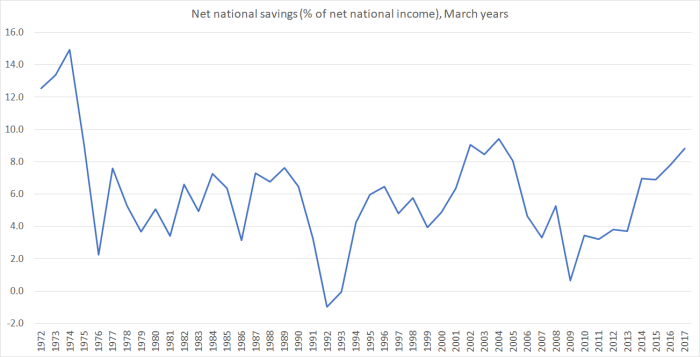
National savings rates have been flat (and quite low by international standards) for decades.  They’ve shown no consistent sign of decreasing as house/land prices rose and –  for what its worth –  have been a bit higher in the last few years, as house prices were moving towards record levels.

What I found really surprising about the Hickey article was the absence of any mention of land use regulation.  If policymakers didn’t make land artificially scarce, it would be considerably cheaper (even if there are still some tax effects at the margin).   And while there was a great deal of focus on tax policy, there was also nothing about immigration policy, which collides directly with the artificially scarce supply of land.

I’ve also shown this chart before

res I % of GDP

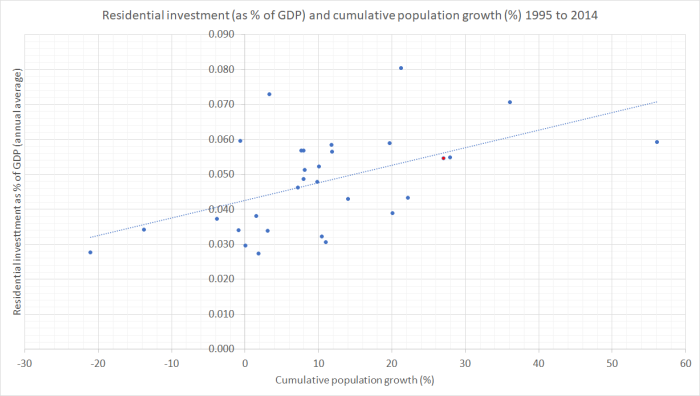
These are averages for each OECD country (one country per dot).  New Zealand is the red-dot –  very close to the line.  In other words, over that 20 year period we built (or renovated/extended) about as much housing as a typical OECD country given our population growth.    But, as I noted in the earlier post on this chart

The slope has the direction you’d expect – faster population growth has meant a larger share of current GDP devoted to housebuilding – and New Zealand’s experience, given our population growth, is about average. But note how relatively flat the slope is. On average, a country with zero population growth devoted about 4.2 per cent of GDP to housebuilding over this period, and one averaging 1.5 per cent population growth per annum would have devoted about 6 per cent GDP to housebuilding. But building a typical house costs a lot more than a year’s average GDP (for the 2.7 people in an average dwelling). In well-functioning house and urban land markets you’d expect a more steeply upward-sloping line – and less upward pressure on house/land prices.

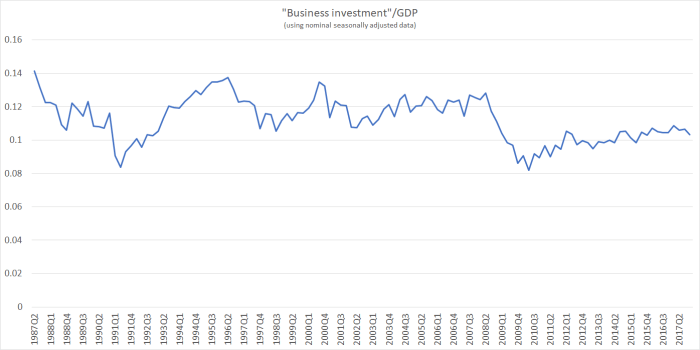
And, since Hickey is –  rightly – focused on weak average rates of business investment here is another chart from the same earlier post.

Bus I % of GDP

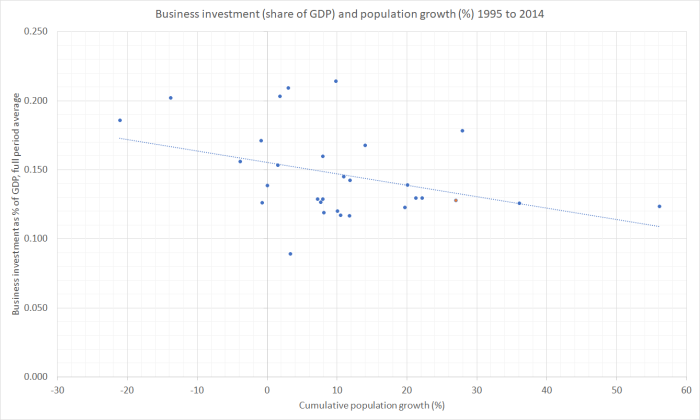
Again, New Zealand is the red dot, close to the line.   Over the last 20 years, rapid population growth –  such as New Zealand has had –  has been associated with lower business investment as a share of GDP.  You’d hope, at bare minimum, for the opposite relationship, just to keep business capital per worker up with the increase in the number of workers.

This issue, on my telling, isn’t the price of houses –  dreadful as that is –  but the pressure the rapid policy-fuelled growth of the population has put on available real resources (not including bank credit).  Resources used building or renovating houses can’t be used for other stuff.

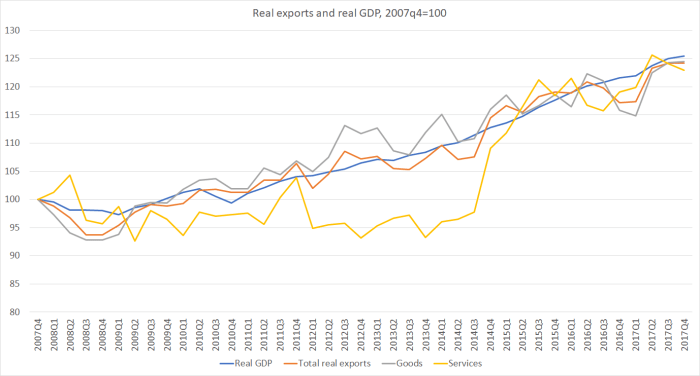
And one last chart on this theme.

productive cap stock

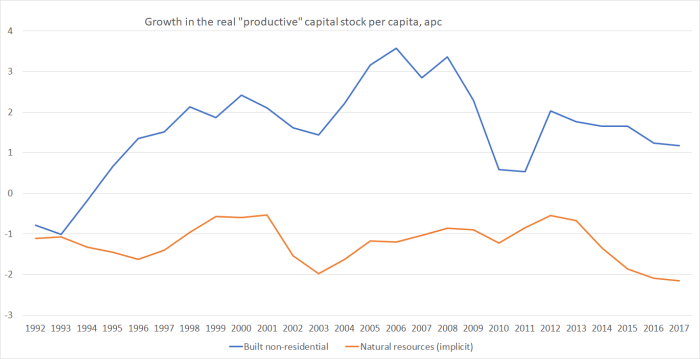
The blue line shows the annual per capita growth rate in the real capital stock, excluding residential dwellings (it is annual data, so the last observation is for the year to March 2017), but as my post the other day illustrated even in the most recent national accounts data, business investment has been quite weak.   I’ve added the orange line to account for land and other natural resources that aren’t included in the official SNZ capital stock numbers.  We aren’t getting any more natural resources –  land, sea, oil and gas or whatever –  (although of course sometimes things are discovered that we didn’t know had been there).  The orange line is just a proxy for real natural resources per capita –  as the population grows there is less per capita every year, even if everything is renewable, as many of New Zealand’s natural resources are (and thus the line is simply the inverted population growth rate).

In New Zealand’s case at least, rapid population growth (largely policy driven over time) seems to have been –  and still to be – undermining business investment and growth in (per capita) productive capacity.   Land use regulation largely explains house and urban land price trends.  And it seems unlikely that any differential features of New Zealand’s tax system explain much about either outcome.

The other new article that caught my eye this morning was one by Otago University (and Productivity Commission) economist, Andrew Coleman.    He highlights, as he has in previous working papers, how unusual New Zealand’s tax treatment of retirement savings is, by OECD country standards.  Contributions to pension funds are paid from after-tax income, earnings of the funds are taxed, and then withdrawals are tax-free.   In many other countries, such assets are more often accumulated from pre-tax income, fund earnings are largely exempt from tax, and tax is levied at the point of withdrawal.   The difference is huge, and bears very heavily on holding savings in a pension fund.

As Coleman notes, our system was once much more mainstream, until the reforms in the late 80s (the change at the time was motivated partly by a flawed broad-base low rate argument, and partly –  as some involved will now acknowledge –  by the attractions of an upfront revenue grab.

The case for our current practice is weak.  There is a good economics argument for taxing primarily at the point of spending, and not for –  in effect –  double-taxing saved income (at point of earning, and again the interest earned by deferring spending).  And I would favour a change to our tax treatment of savings (I’m less convinced of the case for singling out pension fund vehicles). I hope the TWG will pick up the issue.

That said, I’m not really persuaded that the change in the tax treatment of savings 30 years ago is a significant part of the overall house price story.  The effect works in the right direction –  and thus sensible first-best tax policy changes might have not-undesirable effects on house prices.  But the bulk of the growth in real house (and land) prices –  here and in other similar countries –  still looks to be due to increasingly binding land use restrictions (exacerbated in many places by rapid population growth) rather than by the idiosyncracies of the tax system.

Eaqub on NZ policymaking

Shamubeel Eaqub’s column in yesterday’s Sunday Star-Times got me thinking.

The column is headed Policy flip-flopping on the road to progress although Eaqub seems to lament two quite different things.  The first is what he suggests is a tendency for policy to reverse course depending on which party is in office.

On tax, we have seen little leadership. The Helen Clark-led Labour government raised income taxes for high income earners, because they wanted a progressive tax system.  The John Key-led government then lowered those taxes, as it took its turn at the policy-making helm.

This kind of turn-based policy making which favours ideology is bad. It creates instability and loses sight of the long-term issues governments should be dealing with.  Instead we need a long-term and deliberate approach which can overcome this kind of policy yo-yo.

And the second is something about failures of New Zealand policymaking more generally

Bad policies often hang around like weeds, because we don’t have a good system to review past policies and undo them if necessary.

The demands for action and leadership are justified. But we should not be so hasty to deride collaborative and transparent approaches to policy development.

They are a good counter to the current way that has allowed big social and economic issues to accumulate over decades.

I’m not convinced on the first score.  For decades now, the similarities between our two main parties have been much more apparent than the differences.  Even in the brief periods of radicalism, Labour briefly wrong-footed the National Party in the mid 1980s, then National had its own brief spurt of reforms in much the same general spirit, and then before long both parties had settled back to doing not very much at all.  In many ways, the similarities aren’t so surprising –  there is plenty of political science and economics literature to predict that sort of clustering to the centre.

There are exceptions of course –  such as the maximum marginal tax rate example Eaqub describes.   Another example might have been the 90 day trial periods promised (and implemented) by National in 2008, and being partially unwound now.   And the exceptions aren’t necessarily a bad thing.  We do, after all, live in a democracy, where parties compete for your vote.  One likes to think that at least some of that competition might be based around different visions, and differences of the best practical ways to achieve even agreeed outcomes, not just on (say) who has the cutest kids or makes the best pizza.  Reasonable people will, at times, take a quite different view on (a) priorities, and (b) mechanisms (not just what “works” but what is “socially acceptable”).   The hankering for “a long-term and deliberate approach which can overcome this kind of policy yo-yo” has disconcerting similarities to the talk of the alleged superiority of the approach adopted in the People’s Republic of China: one party, and now one leader, indefinitely supposedly facilitates good long-term reform.  None of that pesky competition of ideas, interests, and individuals.  Shame about the outcomes there.

So which party is in office is supposed to make a difference –  and not just to the faces on the covers of the women’s magazines.

But I’m much more sympathetic to Eaqub in his concern about longer-term policymaking and associated advisory capability.   And that probably does spillover into Eaqub’s concerns about some of those short-term initiatives parties promise to win elections

Too many policies are populist, turn-based or just ill-thought out

Eaqub laments the state of the public service.

The civil service has a role here, as the generators and repositories of policy ideas, rather than just the delivery mechanism of ministers’ ideas that it has become.

Beaten into submission over decades, our civil service is more likely to say “more research required” on a problem, like an academic, rather than offer a well-formed recommendation.

In some respects it is hard to disagree.   Observing the quality of the analysis and advice coming out of The Treasury and MBIE instills no confidence whatever.  But while ministers have not often not welcomed, and at times actively discouraged, free and frank advice, the problem isn’t only with politicians.  The Treasury’s continued failure to have a compelling narrative of why our economic performance continues to lag behind isn’t really Bill English’s fault –  it is the failure of the institution itself (more interested, apparently, in well-being studies) and perhaps of those –  the State Services Commission –  that appoints heads of government departments.  Sir Robert Muldoon –  no great fan of The Treasury –  didn’t prevent The Treasury being well-positioned in 1984 with ideas, analysis and energy that helped facilitate the reforms of the following decade.  But that was probably an historical exception, and perhaps it is unrealistic –  even in a small country –  to really expect the public service to lead in ideas-generation around desirable reforms.  Apart from anything else, the incentives are all wrong, and the inevitable constraints militate against it.

Perhaps we have bigger weaknesses than our public service?    Think-tanks are few –  and our most consistently fertile one (the New Zealand Initiative, and is predecessor the Business Roundtable) tends to be located towards a libertarian end of the spectrum where very few likely voters are.  And in many areas, the contribution to policy-related analysis and debate from university academics is pretty thin, or often almost non-existent.  There are understandable reasons –  the PBRF ranking/funding model prioritises refereed journal articles and academic books, and recruitment policy (no doubt for good short-term economic reasons) often prioritises cycling through young foreign academics with little knowledge of, or interest in, the specifics of New Zealand.   Whatever the reasons –  and some of them may just be the limits of a small country – the policy-related inputs are often pretty thin.

But I wonder if the bigger issue still isn’t the lack of demand for anything different.  After the ructions of the 80s and early 90s there seemed to be both a shared elite consensus that reforms had been done pretty well, and it was only a matter of time until we saw the fruit.  And when the fruit (mostly) didn’t show up to the extent hoped for, there was a shared reluctance at a political level to risk more change –  perhaps particularly on the left (where the Labour Party had split).   For many people, life in New Zealand isn’t too bad at all, so why risk rocking the boat –  memories (and folk memories now) of the 80s and 90s.

And the “policy elite” (whether or a broadly-left or broadly-right persuasion) still mostly tend to hold some views that probably haven’t served New Zealand that well.  For example:

  • the broad-based low rate (BBLR) tax system, which keeps getting praised (including abroad) but typically isn’t imitated.   We tax returns to savings materially more heavily than most countries do, and that is increasingly true of business investment too,
  • the deep-seated belief that high levels of immigration are a “good thing” –  generally, and for New Zealand (even as the proponents are unable to produce evidence of those benefits for New Zealand).  The belief might be rooted in history (settler societies and all that), general economics literature, and the dread fear of being accused –  eg by the NZ Initiative –  of “racism” or “xenophobia, but whatever the reason, it no longer serves us well,
  • the endless deference to the People’s Republic of China, and the narrative that has somehow been allowed to grow up that somehow our fragile prosperity depends on keeping on side with the PRC,
  • the indifference to the fact that New Zealand has had consistently the highest real interest rates in the advanced world (and amomg the slower rates of productivity growth) –  the rhetoric for a long time (again a legacy of past decades) was that such differences can’t persist, unless they are risk-based,
  • a shared belief in the importance of technology and the tech sector, and more of a desire to belief than a willingness to ask hard questions about the likelihood of such industries developing, and remaining, here,
  • the implicit belief that our physical location doesn’t matter much (occasional talk about “costs of distance” notwithstanding) and thus an implicit view that analysis fit for small northern European countries is just fine for a really remote South Pacific one,
  • a largely shared indifference to the persistence of a very high real exchange rate.  Some of this indifference no doubt relates to the memories of controlled exchange rates past, or to journal articles characterising exchange rates as random walks, but again whatever the reason, it holds people back from seriously engaging with this symptom of our problems.

Of course, there are other issues on which the “policy-elites” are on the side of the angels –  there is probably a pretty strong consensus on raising the NZS age and even age-indexing it in future –  but there are high political barriers.

And other issues like house prices – perhaps even family breakdown –  where New Zealand’s policy failures aren’t much different from those in many other parts of the Anglo world.

Probably it is much easier to do reform, and even craft some sort of elite support for it, when the issues look like ones that involve converging towards what everyone else is doing.   That was, more or less, the story we told in the 80s and early 90s.  Even when the details of things done here were sometimes world-leading, the overall narrative was one in which we had failed to open up and reform in a way that other countries had, or were doing.  We just need to catch-up, and in the process could do some innovative stuff.

But what of now?  No country anywhere is doing much to do structurally with house prices –  and for most people in most of the rest of the world, those successful parts of the US without the problem seem to be treated as little more than a curiousity, of which most are barely aware.  No one is fixing the “family breakdown” issues either, and so we drift like the rest.

And addressing our economic underperformance looks as though it might require stepping away from some of the OECD rhetoric.   That can be hard to do (perhaps especially for officials), absent some compelling figure with an alternative narrative and the political skills to take people with him/her.

To get back to Eaqub’s article, he began by noting that

When a new government forms, there is usually a flurry of studies, task forces, working groups and advisory panels.

That has been right, at least with recent governments.  But perhaps what is most notable about many of those groups is the typically limited resources and limited time they are given.  He cited the Jobs Summit –  done over a couple of months, culminating in a one-day jamboree –  or the 2025 Taskforce (so under-resourced the one foreign appointee couldn’t really believe it). But he could have mentioned the current Tax Working Group too, which is operating on pretty tight deadlines, with limited specialist expertise.   Some of these groups, even with limited time/resources, have produced some useful material.  But they are often more about political management than about actually getting to the bottom of some serious and knotty problem.

This post has been pretty discursive, probably more useful for clarifying my thinking than for anyone else.  I think my bottom line is something along these lines:

Political flip-flopping is the least of our problems.   And the public service –  while quite degraded in its policy capabilities –  is perhaps not a body one could ever hope for much from on a sustained basis.  Our university and think-tank sectors are weak, when it comes to policy analysis and associated innovation.  But perhaps the biggest obstacle to change –  whether around the issue this blog most often focuses on, productivity underperformance, or most others –  is the absence of any political (or, presumably, public) demand for different outcomes, buttressed by “policy-elites” who seem to share assumptions and presuppositions that might have looked fine 25 years ago, but which –  on my argument – don’t do so now.  Without alternatives –  that might go over well at the OECD, the IMF or the like – it is just easier to hold on to those presuppositions, and the comfortable life most enjoy.       It is a recipe for continued drift, which is of course what we saw under the last two governments and what we seem set for under the current one.   It isn’t obvious what, or who, might credibly lead us to something different.

House prices: Cleveland and Wellington

A few months I signed up to get the e-mail newsletters of US analyst Aaron Renn.

Aaron M. Renn is a senior fellow at the Manhattan Institute, a contributing editor of City Journal, and an economic development columnist for Governing magazine. He focuses on ways to help America’s cities thrive in an ever more complex, competitive, globalized, and diverse twenty-first century.

There is an interesting mix of material on urban issues.   But this morning, one newsletter in particular caught my eye.  The title was a warning: “Sprawl in its Purest Form, Cleveland edition”.    The article began this way.

…..the image below contrast[s] the amount of urbanized land in Cleveland’s Cuyahoga County in 1948 vs. 2002. The county population was identical in both years: 1.39 million.


And the piece goes on to lament how costly the spread of suburbia is, concluding that

As a rough heuristic, development of new suburban footprint should largely be limited to the growth rate in households to avoid saddling a region with excess fixed cost.

It might be music to the ears of some of our own planners, and the politicians who continue to enforce their policies.

Renn laments the fact that, at least in this case, when cities can spread and new houses can easily be built, while the population doesn’t change much, existing houses lose value

If you keep building new homes but you aren’t adding households, then older homes at the bottom of the scale will be abandoned. And all up the stack homes are devalued.

In the same way, when we had restrictions on importing cars in New Zealand for decades, secondhand cars didn’t depreciate much.  Most of us prefer access to newer cars.

I had a look at some Cleveland data.  And sure enough not only has that county’s population been largely unchanged, but greater Cleveland (MSA) with just over 2 million people also hasn’t had much change in population for 50 or 60 years (if anything falling slightly more recently).

I also had a look at house prices.   Demographia reports that Cleveland median house prices are 2.7 times median incomes in Cleveland, averaging US$146000 last year.  Average per capita GDP in the Cleveland metro area was around US$56000 in 2016.

On the other hand, a friend had mentioned the other day a house, perhaps 150 metres from where I’m typing, that had sold the other day for  $831000.    It is a small house (100 square metres) on a pretty tiny section (324 square metres) –  with a major construction project almost on the doorstep for the next 18 months or so – and as far as I can see nothing out of the ordinary.  That is the point –  it isn’t egregiously expensive for Wellington (let alone Auckland) in this day and age.    It is about what one might expect, given our laws and regulatory practices.     Average GDP per capita in Wellington in the year to March 2016 was around $NZ67900 –  a fair bit less than in Cleveland.

Homes.co.nz records that the same Island Bay house sold in 1985 for $76500.   Apply the Reserve Bank’s inflation calculator and in today’s dollars that would be the equivalent of $207000.  The actual recent sale price –  the real increase in price –  was four times that.

How have Cleveland house prices done over time?  Here is a chart, back to 1985, from the FRED database.

cleveland prices

Nominal prices have increased quite a lot.  But in real terms, applying a US inflation calculator, Cleveland house prices have barely moved –  up a bit in the boom years, down in the recession, but over 33 years virtually no change at all.  Houses were highly affordable then, houses are highly affordable now.    And lest you assume Cleveland is some economic wasteland, the FRED database also suggests that the unemployment rate there has been averaging about 5 per cent in the last year or two, very similar to that in New Zealand.

I usually focus on cities with fast-growing populations in discussing US examples of low and affordable house prices – eg Atlanta or Nashville.   And I’ve never been to Cleveland, and have no particular idea how attractive or otherwise parts or all of it are (in Wellington, Porirua and Wainuiomata  –  for example –  also have their downsides).   But the ability of the citizenry to readily expand the physical footprint of the city seems like a success story, producing housing market outcomes that seem much more appealing –  particularly to younger people trying to enter the market –  and affordable than what we now seem to manage in our larger New Zealand cities.

We should steer well clear of “rough heuristics” or tighter rules that try to limit the expansion of the physical footprint of cities, or allow officials and politicians to determine which land can and can’t be built on, in what order.   A competitive market for urban land –  peripheral and central –  remains the best prospect for once again delivering what should be a basic expectation: affordable housing.

Sadly, I noted in ACT’s newsletter earlier in the week, a link to a parliamentary question from a few weeks ago in which the Minister for the Environment indicated that “Cabinet is yet to make any decision about whether to review the Resource Management Act”.  I’ve long been sceptical as to whether, even if some Labour parts of a left-wing government was willing to think about serious reform, such reform would be possible given the reliance on the Greens to pass government legislation.  Sadly, for now it increasingly looks as if those fears are being realised.

House –  and land prices –  need to fall.  This government, like its predecessor, seems at  scared of such an outcome, and unwilling to take steps that offer the prospect of sustained much lower prices.


What do we want with the Belt and Road?

Readers will recall that the New Zealand China Council was set up by the government a few years ago, and is largely funded by the government, to promote

deeper, stronger and more resilient links between New Zealand and China

The Council includes the heads of government departments/agencies (MFAT and NZTE), and includes plenty of people –  including retired politicians – with strong business links to the People’s Republic of China.    A significant part of what they do –  see their Annual Report – is a “communications and advocacy programme”, designed –  it seems – to help ensure that as far as possible New Zealanders see things their way, and don’t create trouble around either the character of the regime (and the party that controls it), or that regime’s activities at home, abroad, and in New Zealand itself.   There are, after all, deals to be done, political donations to be solicited, friends to be protected, and so on.

Stephen Jacobi is the executive director of the Council, and its public face.  In the last few weeks I’ve written about a speech Jacobi gave recently in which he attempted –  without much depth or rigour –  to bat away concerns about PRC activities and risks, and also about a rather economics-lite press release he had put out attempting (Trump-like) to make much of the current trade surplus with the People’s Republic of China.

This week Jacobi was out with another speech, this one on Investing in Belt and Road – A New Zealand Perspective.  “Belt and Road Initiative” (or BRI) is the most recent label (previously “One Belt, One Road”) on a somewhat ill-defined but expanding PRC programme, partly about improved infrastructure (initially in and around central Asia) and partly –  some argue mainly – about extending PRC geopolitical interests in ways that display scant regard for recipient countries’ debt burdens, social or environmental standards, transparency and so on. A few weeks ago, a Bloomberg story reported that Xi Jinping had just added the Arctic and Latin America to the areas (now almost the entire world) supposedly cover by the Belt and Road initiative

BRI graphic

Or as a recent New Yorker story put it

“Across Asia, there is wariness of China’s intentions. Under the Belt and Road Initiative it has loaned so much money to its neighbours that critics liken the debt to a form of imperialism.  When Sri Lanka couldn’t repay loans on a deepwater port, China took majority ownership of the project”

I’ve also linked previously to a recent report on the potential debt risks associated with the BRI programme.

Last week’s speech isn’t, of course, the first time Jacobi has been talking about the BRI.  In a Newsroom article last year he was quoted this way

Jacobi says “the real play” in our corner of the world is less about infrastructure and more about connecting up with China through including the flow of goods, services and people.

“I’ve even heard reference to the Digital Silk Road, the vision is expanding … there’s a bit of talk in China about Belt and Road being a new way to manage globalisation instead of the old ways, which have been done off the back of trade liberalisation in particular.”

But it wasn’t very clear, at all, what it meant for New Zealand

Jacobi says New Zealand shouldn’t let too much time go by before it develops more concrete ideas for what Belt and Road could achieve in New Zealand.

“We’ve really got to move from a very conceptual phase to talking about more definite projects: I can see scope for some projects that exist at the national level between New Zealand and China on bigger picture economic cooperation-type matters, and I can see scope for more discrete projects with individual provinces.”

But what did Mr Jacobi have to say this week?

He mightn’t be sure quite what the substance of the Initiative is, but Jacobi seems pretty sure it is a good thing.

Meanwhile China under its newly-empowered President is proceeding to implement the Belt and Road Initiative (BRI) as a new model for globalisation, precisely at the time when people all around the world are calling for new ways to make globalisation work better.

What China –  with far-reaching restrictions still in place on foreign access to its market, especially around services –  means by “globalisation” isn’t what most people think of.

And so he tells us that

It is the assessment of the NZ China Council that New Zealand cannot afford to stand aside from developing a contribution to Belt and Road.

If we choose not to engage, others most certainly will and we will find our preferential position in the Chinese market further eroded.

There is the odd caveat

At the same time, we need to proceed carefully and in a way which matches our interests, our values and, especially, our comparative advantage.

although I don’t think I noticed any substantive discussion of our values or what they might mean in this context.

The context for any New Zealand involvement is a Memorandum of Arrangement signed by the two governments a year ago.

As Jacobi puts it

The MoA is non-binding and largely aspirational –  it set a timetable of 18 months for the development of this co-operation – we understand the official wheels are now in motion to put some greater flesh on the bones of how we might co-operate in the future.

And the China Council is working up its own ideas.

We suspect the greater benefit for NZ is likely to be in the “soft infrastructure” rather than the “hard infrastructure” – the way goods, services, capital and people move along the belt and road rather than building the road itself.

New Zealand has wide policy expertise and commercial services to offer in this area which matches a number of the policy areas China has highlighted for Belt and Road including policy co-ordination, investment and trade facilitation, and cultural and social exchange.

And they’ve had a consultant’s report done –  to be released in May –  with proposals.

Count me a little sceptical.  When Statistics New Zealand released the country breakdown of goods and services exports a few weeks ago, I had a look at the services exports of New Zealand firms to the PRC.  Under services exports –  themselves only 20 per cent of the total –  were tourism, export education, and travel/transportation.  Fifth on the list of “major services exports” was “other business services”.  Last year, that totalled $32 million – a fraction of 1 per cent of total exports to China.  It isn’t surprising, given that tight restrictions China has on most services sector trade, but it does leave you wondering what Mr Jacobi has in mind from his champion of globalisation.

I hadn’t previously got round to reading the Memorandum of Arrangement.  On doing so, it was hard to disagree with Mr Jacobi’s “aspirational” characterisation.  But equally, one had to wonder whether these were aspirations we should share (with Simon Bridges, who signed the agreement for the previous government).

It was, for example, a little hard to take at face value this bit of the preamble

BRI 1

and a bit further on the preamble started to get positively troubling, the Participants

BRI 2

I’m quite sure I – and most New Zealanders –  have  little interest in pushing forward “coordinated economic…and cultural development” with a state that can’t deliver anything like first world living standards for its own people (while Taiwan, Singapore, South Korea etc do) and whose idea of cultural development appears to involve the deliberate suppression of culture in Xinjiang, the persecution of religion (Christian, Muslim, Falun Gong or whatever), the denial of freedom of expression (let alone the vote) and which has only recently backed away from compelling abortions.  And that is just their activities inside China.    “Fusion among civilisations” doesn’t sound overly attractive either –  most of us cherish our own, and value and respect the good in others, without wanting any sort of fusion,and loss of distinctiveness.  But perhaps Simon Bridges saw things differently?

The next section is “Cooperation Objectives”.  There is lots of blather, including this

BRI 3

Hard not to think that “regional peace and development” might be better secured if the PRC forebore from creating new articial islands, seizing reefs etc in the South China Sea, or patrolling menacingly around the Senkaku Islands, engaging in military standoffs with India, or even making threatening noises about Taiwan.  There seem to be two main threats to regional peace, and the other is North Korea.  But you’d never hear anything of that sort from a New Zealand government.

The next section is “Cooperation Principles” under which the governments agree to

BRI 4

In other words, if New Zealand keeps quiet and never ever upsets Beijing, whether about their domestic policies (economic, human rights, democracy), their foreign policies (expansionist and aggressive) or their influence activities in other countries, including our own, everything will be just fine, and the PRC will keep dealing with us.  And on the other hand…….?

There are then  five “Cooperation Areas”.   Apparently, we are going to actively conduct “mutually beneficial cooperation in….public financial management” (hint: that “wall of debt” is a sign things haven’t been done well so far).  But the one that really caught my eye was under the heading “policy cooperation”, where Simon Bridges committed us to

BRI 5

It isn’t obvious New Zealand now has any “major development strategies” (see sustained lack of productivity growth) or that the PRC ones offer much to anyone –  well, individual business deals aside –  when compared with, say, those of Taiwan, Singapore, or Korea.     And what is this bit about strengthening “communication and cooperation on each other’s major macro policies”?     Why?  To what end?     And who thinks it is desirable for New Zealand to “connect and integrate” our (largely non-existent) “major development strategies”, and our “plans and policies” with those of the PRC?  A country that, as even Mr Jacobi recognised in his earlier speech, has fundamentally different values.

And the agreement concludes

bri 6

One has to wonder how it is in the interests of the people of New Zealand (as a whole –  as distinct perhaps from some individual businesses looking for a good deal), or consonant with their values, to support such an initiative, or a regime such as that of the PRC. Apart from anything else, it all seems curiously one-sided: the agreement isn’t to support New Zealanders, but rather to advance a geopolitical projection strategy of a major power, with very different values than our own.   Can anyone imagine us having signed such an agreement with the Soviet Union in the 1970s?

We can only wait and see the details of what the China Council will propose in their paper in May.   And, even more interestingly, what the government comes up with –  being bound to formulate a detailed work plan by September.  Winston Peters may regret the previous government signing up, but he is now stuck with the agreeement for four more years.  One hopes the government will find a way to some minimalist, not very costly, arrangements, but given how keen governments of both major parties have been to cosy up to Beijing –  party presidents praising Xi Jinping –  it is difficult to be optimistic.  On the other hand, it is difficult to see quite what any New Zealand involvement might amount to, and perhaps Beijing has already had the real win –  getting a Western country, a Five Eyes member, to sign up to such a questionable deal with such an obnoxious regime.

But to get back to Mr Jacobi’s speech, nearing the end he observes

There is currently a debate in New Zealand about the extent of Chinese influence in our economy.

I am on record as being concerned about some of the “anti-China” narrative in that debate, especially in the unfortunate targeting of prominent individuals in the Chinese community, but there is nothing wrong with a debate focused on how to build a resilient relationship with China given the difference political values between our two countries.

While I welcome his final half-sentence, it is a little hard to take seriously when he never – at least in public –  engages seriously with the concerns that people like Anne-Marie Brady have been raising.  As I noted about his earlier speech, among other things he will simply never

  • address why it is appropriate to have as member of Parliament in New Zealand a former Chinese intelligence official, former (at least on paper) member of the Communist Party, someone who now openly acknowledges misrepresenting his past on forms to gain entry to New Zealand (apparently because that is what the PRC regime told people to do),
  • address the PRC control of the local Chinese language media, and associated (and apparently heightened) restriction on content,

Instead he falls back on plaintive laments about the “unfortunate targeting of prominent individuals in the Chinese community”.   These same people –  since presumably he has in mind Jian Yang and Raymond Huo –  sit on his own advisory board.  And both are not members of the public, but elected members of Parliament: not in either case elected by a local constituency (and certainly not by “the Chinese community”), but by all New Zealand voters for their respective parties.     And yet both of them –  but particularly Jian Yang –  simply refuse to answer questions or appear in the English language media to explain and defend (in Yang’s case) the background, and their ongoing ties to the PRC and apparent reluctance to ever say a critical word about that heinous regime.

It must now be six months –  since the Newsroom stories first broke –  since Jian Yang has appeared.   At the moment, it looks much less like “unfortunate targeting”, than quite specific and detailed targeting, with unfortunate defence and distraction being played by key figures in the New Zealand establishment, including Mr Jacobi.  Perhaps people might be more persuaded by Jacobi’s case –  that working closely with, and constantly deferring to, the PRC was in the best long-term interests of New Zealanders, if he called for his board members to front up, rather than giving them cover to simply shut up.

In concluding the post a few weeks ago about Mr Jacobi’s earlier speech, I had a speculative paragraph on some uncomfortable parallels between the PRC now, and Germany in the 1930s.  If the parallel isn’t exact –  and we must hope not, given how the earlier episode ended –  it still seems closer than any other historical case I can think of, including the same desperate desire to appease, to understand, to get alongside (key figures in the British Cabinet were still hoping to do economic deals with Berlin well into 1939), and the same reluctance to confront evil or take a stand (even at some cost to some businesses).  In a week when the PRC “Parliament” passed the amendment to remove the term limit on the office of President with 2958 votes in favour and two against, I decided to check out the results of the referendum Hitler staged in August 1934 after President Hindenburg died, to finally concentrate all power in his own hands.  This was 18 months into the Nazi era.  Despite widespread intimidation, almost 10 per cent of voters (on a high turnout) felt free to dissent

For 38,394,848 88.1
Against 4,300,370 9.9
Invalid/blank votes 873,668 2.0
Total 43,568,886 100

There is something to be said for our governments openly and honestly confronting the nature of the Beijing regime.   We can’t change them, and it isn’t our place to, but we can choose with whom we associate, we can choose how often we just keep quiet, and how much of our own values (and the interests of many of our own Chinese citizens) we compromise in the quest for a few deals for a few businesses (and universities) – and a steady flow of political party donations.   And we can, and do, as I’ve pointed out before, make our own prosperity.  If individuals firms want to deal with the PRC, on its terms, then good luck to them I suppose, but we then need to wary of those same firms and institutions, and to ask whose interests they are now, implicitly or explicitly, championing.

There is a weird line in Matthew Hooton’s column in today’s Herald in which he asserts that no one should be critical of China because “China is just doing what emerging Great Powers always do”.  That may be a semi-accurate description.  It didn’t stop us calling out, and resisting, the expansionist tendencies of Germany, Japan, or the Soviet Union.  It shouldn’t hold us back in recognising the threat the latest party-State, the People’s Republic of China, poses both abroad and here.


Our rather moribund economy

The quarterly national accounts data were out yesterday.  They made pretty underwhelming reading.

There was the (rather modest) growth in per capita GDP

pc GDP mar 18

This expansion –  dating from around 2010 –  has been quite a lot weaker than the previous two growth phases.  In the chart you can see that almost every peak for the last 25 years has been lower than the one before.   And for the last year – full year 2017 over full year 2016 – we managed only 0.8 per cent growth in real GDP per capita.   Growth has been slower than that only in the midst of the last two recessions.

At least real per capita GDP grew, you might say.  But hours worked per capita (whether measured by the HLFS or the QES) grew by a touch over 0.8 per cent over that same period.  In fact, there was no growth in labour productivity at all.

Here is my standard labour productivity chart, averaging the different possible combinations of QES and HLFS hours data and production and expenditure GDP data.

productivity mar 18

There has been no productivity growth at all in the last year, and in the last five years ( the grey line relative to the orange line) average annual labour productivity growth has been only around 0.3 per cent per annum.   And this in an economy that the previous government liked to boast –  and the new government seemed happy to concede –  was doing pretty well.  Productivity growth is the only sustained basis for long-term improvement in material living standards.   We have very little of it –  even as we start so far behind most other advanced countries.

Perhaps our firms have been managing more success in taking in world markets?

There was bounce in the terms of trade –  dairy prices were improving –  so nominal exports as a share of nominal GDP did improve.

x share of gdp

Unfortunately, it looks like another of those series in which each peak is a bit lower than the one before it.    And services exports –  the wave that was much talked of a year or two back –  look to be dropping away again.  Exports of services –  often talked of as the way of the future –  first got to the current level (share of GDP) in 1998.

I don’t often show charts of export volumes.  As a share of GDP such charts aren’t very meaningful.  But one can compare growth rates, in this case for the last decade, since just prior to the 2008/09 recession.

x and gdp real

Over the decade as a whole, export volume growth has barely kept pace with the unimpressive growth in real GDP, and even the services surge in 2014/15 only ‘made up’ for the severe underperformance of that sector in the previous few years.   Recall that, for a country with a small population, New Zealand’s export share of GDP is very low to start with, and over this decade there has been no progress in closing that gap (something probably an integral mark of any sucessful policy programme to close the overall productivity gaps).  The result isn’t very surprising given how out of line with relative productivity our real exchange rate has become, but it can be (soberingly) useful to see the hypothesis confirmed in the data.

And one last chart.  Here is the proxy for business investment spending as a share of GDP (total investment less government and residential investment).

business investment to dec 17

Yet another chart in which each peak seems lower than the one before it –  and this in a country where, with very rapid population growth at present, one might have hoped to see a temporarily larger than usual share of current GDP going to business investment, to maintain the capital stock per worker.   But no.    If anything –  and there is noise in the series so I wouldn’t make anything much of it – things may have been falling off again in the last few quarters.

These weren’t outcomes the previous government showed any sign of caring about.   In Opposition, Grant Robertson would regularly release statements when the national accounts came out lamenting the relatively poor performance.  In office, there was no statement yesterday.  And despite the occasional ritual obeisance to the idea of lifting productivity performance, there is no sign that government –  or their Treasury advisers –  has any serious idea how such outcomes might be brought about, or any very serious commitment to trying.


Estimating NAIRU

The Reserve Bank of New Zealand has long been averse to references to a “natural rate of unemployment” or its cognate a “non-accelerating inflation rate of unemployment” (NAIRU).  It started decades ago, when the unemployment rate was still very high, emerging from the structural reforms and disinflation efforts of the late 80s.  We didn’t want to lay ourselves open to charges, eg from Jim Anderton, that we regarded unemployment as natural or inevitable, or were indifferent to it, let alone that we were in some sense targeting a high rate of unemployment.   Such a criticism would have had little or no analytical foundation –  we and most mainstream economists held that a NAIRU or “natural” rate of unemployment was influenced largely by labour market regulation, welfare provisions, demographics, and other structural aspects (eg rate of turnover in the labour market) that were quite independent of monetary policy.  But the risk was about politics not economics, and every election there were parties looking to change the Reserve Bank Act.  And so we never referrred to NAIRUs if we could avoid it –  which we almost always could –  preferring to focus discussions of excess capacity etc on (equally unobservable) concepts such as the output gap.  In our formal models of the economy, a NAIRU or a long-run natural rate could be found lurking, but it made little difference to anything (inflation forecasts ran off output gap estimates and forecasts, not unemployment gaps).

Other central banks do things a bit differently, perhaps partly because in some cases (notably Australia and the US) there is explicit reference to employment/unemployment in monetary policy mandates those central banks are working to.   In a recent article, the Reserve Bank of Australia observed that

“When updating the economic forecasts each quarter, Bank staff use the latest estimate of the NAIRU as an input into the forecasts for inflation and wage growth”

It may not make their monetary policy decisions consistently any better than those here, but it is a difference in forecasting approach, and in how the RBA is prepared to talk about the contribution of unemployment gaps (as one indicator of excess capacity) to changes in the inflation rate.

I’ve been arguing for some years –  first inside the Bank, and more recently outside –  that our Reserve Bank put too little emphasis (basically none) on unemployment gaps (between the actual unemployment rates and the best estimate of a NAIRU).  It has been the only central bank in the advanced world to start two tightening cycles since 2009, only to have to reverse both, and I had noted that this outcome (the reversals) wasn’t that surprising when for years the unemployment rate had been above any plausible estimate of the NAIRU.   The Bank sought to fob off criticisms like this with a new higher-tech indicator of labour market capacity (LUCI) –  touted by the Deputy Governor in a speech, used in MPSs etc – only for that indicator to end badly and quietly disappear.

But since the change of government  –  a government promising to add an explicit employment dimension to the Bank’s monetary policy objective (now only 12 days to go til the new Governor and we still haven’t seen the new PTA version) –  there has been some pressure for the Bank to be a bit more explicit about how it sees, and thinks about, excess capacity in the labour market, including through a NAIRU lens.  In last month’s Monetary Policy Statement, they told us their point estimate of the NAIRU (4.7 per cent) and in the subsequent press conference, the Governors told us about the confidence bands around those estimates.  All this was referenced to an as-yet-unpublished staff research paper (which still seems an odd inversion – senior management touting the results before the research has had any external scrutiny).

Last week, the research paper was published.  Like all RB research paper it carries a disclaimer that the views are not necessarily those of the Reserve Bank, but given the sensitivity of the issue, and the reliance on the paper at the MPS press conference, it seems safe to assume that the paper contains nothing that current management is unhappy with.  What the new Governor will make of it only time will tell.

There was interesting material on the very first page, where the authors talk about the role of monetary policy.

The focus of monetary policy is to minimise fluctuations in cyclical unemployment, as indicated by the gap between the unemployment rate and the NAIRU, while also maintaining its objective of price stability.

I would very much agree.  In fact, that way of stating the goal of monetary policy isn’t far from the sort of wording I suggested be used in the amended Reserve Bank Act. Active discretionary monetary policy exists for economic stabilisation purposes, subject to a price stability constraint.  But the words are very different from what one has typically seen from the Reserve Bank over the years (including, for example, in their Briefing to the Incoming Minister late last year).

But the focus of the research paper isn’t on policy, but on estimation.  The authors use a couple of different techniques to estimate time-varying NAIRUs.   Since the NAIRU isn’t directly observable, it needs to be backed-out of the other observable data (on, eg, inflation, wages, unemployment, inflation expectations) and there are various ways to do that.   The authors draw a distinction between a “natural rate of unemployment” and the NAIRU: the former, conceptually is slower moving (in response to changes in structural fundamentals –  regulation, demographics etc), while the NAIRU can be more cyclical but tends back over time to the longer-term natural rate.  I’m not myself convinced the distinction is that important –  and may actually be harmful rhetorically –  but here I’m mostly just reporting what the Bank has done.

The first set of estimates of the NAIRU are done using a Phillips curve, in which wage or price inflation is a function of inflation expectations, the gap between the NAIRU and the unemployment rate, and some near-term supply shocks (eg oil price shocks).  Here is their chart showing the three variants the estimate, and the average of those variants.

nairu estimates.png

Perhaps it might trouble you (as it does me) but the authors never mention that their current estimates of the New Zealand NAIRU, using this (pretty common) approach, are that it has been increasing for the last few years.    Frankly, it doesn’t seem very likely that the “true” NAIRU has been increasing –  there hadn’t been an increase in labour market regulation, the welfare system hadn’t been becoming more generous, and demographic factors (a rising share of older workers) have been tending to lower the NAIRU.

As it happens, the authors have some other estimates, this time derived from a small structural model of the economy.

NAIRU NK

Even on this, rather more variable, measure, the current central estimate of the NAIRU is a bit higher than the authors estimate it was in 2014.    But the rather bigger concern is probably the extent to which over 2008 to 2015, the estimated NAIRU on this model seems to jump around so much with the actual unemployment rate.   Again, the authors offer no thoughts on why this is, or why the pattern looks different than what we observed in the first half of their sample.  Is there a suggestion that the model has trouble explaining inflation with the variables it uses, and thus all the work is being done by implicitly assuming that what can’t otherwise be explained must be down to the (unobserved) NAIRU changing?   Without more supporting analysis I just don’t find it persuasive that the NAIRU suddenly shot up so much in 2008/09.   For what it is worth, however, do note that the actual unemployment rate was well above the NAIRU (beyond those grey confidence bands) for years.

Here is what the picture looks like when both sets of estimates are shown on the same chart.

nairu x2

On one measure, the NAIRU fell during the 08/09 recession, and on the other it rose sharply.  On one measure the NAIRU has been steadily rising for several years, while on the other it has been jerkily falling.  No doubt the Bank would like you to focus on the end-point, when the two sets of estimates are very close, but the chart does have a bit of a “a stopped clock is right twice a day” look to it.   When the historical estimates coincide it seems to be more by chance than anything else, with no sign of any consistent convergence.

I noted the end-point, where the two estimates are roughly the same.  But end-points are a significant problem for estimating these sorts of time-varying variables.  The authors note that in passing but, somewhat surprisingly, they give us no sense of how material those revisions can be, and have been in the past.  I went back to the authors and asked

I presume you’ve done real-time estimates for earlier periods, and then checked how  –  if at all –  the addition of the more recent data alters the estimates of the NAIRU for those earlier periods, but if so do you have any comments on how significant an issue it is?

To which their response was

An assessment of the real-time properties of the NAIRU and the implied unemployment gap was beyond the scope of our paper.

Which seems like quite a glaring omission, if these sorts of model-based estimates of a time-varying NAIRU are expected to play any role in forecasting, or in articulating the policy story (as the Governors did in February).

As it happens, the Reserve Bank of Australia published a piece on estimating NAIRUs etc last year.  As a Bulletin article it is a very accessible treatment of the issue.   The author used the (reduced form) Phillips curve models (of the sort our Reserve Bank used in the first chart above).

nairu rba

The solid black line is the current estimate of Australia’s NAIRU over the whole of history.  But the coloured lines show the “real-time” estimates at various points in the past. In 1997 for example (pink line) they thought the NAIRU was increasing much more –  and thus there was less excess labour market capacity –  than they now think (or, their model now estimates) was the case.  In 2009 there was a stark difference in the other direction.  Using this model, the RBA would have materially underestimated how tight the labour market actually was.

It would be surprising if a comparable New Zealand picture looked much different, but it would be nice if the Reserve Bank authors would show us the results.   These end-point problems don’t mean that the model estimates are useless, but rather that they are much more useful for identifying historical NAIRUs (valuable for all sorts of research) than for getting a good fix on what is going on right now (the immediate policy problem).    That is true of many estimates of output gaps, core inflation (eg the RB sectoral core measure) and so on.

Having said that, at least the Australian estimates suggest that Australia’s NAIRU has been pretty steadily falling for the last 20 years or so, with only small cyclical dislocations.  Quite why the Reserve Bank of New Zealand’s Phillips curve models suggest our NAIRU has been rising –  when demographics and welfare changes typically point the other way –  would be worth some further examination, reflection, and commentary (especially if Governors are going to cite these estimates as more or less official).

Comparing the two articles, I noticed that the RBA had used a measure of core inflation –  their favoured measure, the trimmed mean –  for their Phillips curve estimates, while the RBNZ authors had used headline CPI inflation (ex GST).  Given all the noise in the latter series – eg changes in taxes and government charges –  I wondered why the authors didn’t use, say, the sectoral factor model estimate of core inflation (the Reserve Bank’s favoured measure).  It would be interesting to know whether the NAIRU results for the last half decade (when core inflation has been very stable) would be materially different.  It might also be worth thinking about using a different wages variable. The authors use the headline LCI measure, as a proxy for unit labour costs. But we have actual measures of unit labour costs (at least for the measured sector), and the authors could also think about using, say, the LCI analytical adjusted series and then adjusting that for growth in real GDP per hour worked (a series that has itself been revised quite a bit in the last year).  No model estimate is going to be perfect, but there does seem to be some way to go in refining/reporting analysis research in this area.

I have argued previously that the Reserve Bank should be required to report its estimates of the NAIRU, and offer commentary in the MPS on the contribution monetary policy is making to closing any unemployment gaps.   I’d have no problem with the Bank publishing these sorts of model estimates, but I’d have in mind primarily something a bit more like the Federal Reserve projections, in which the members of the (new, forthcoming) statutory Monetary Policy Committee would be required to publish their own estimates of the long-run sustainable rate of unemployment that they expect the actual unemployment rate would converge to (absent new shocks or structural changes).  The individual estimates are combined and reported as a range.  No doubt those individual estimates will have been informed by various different models, but in the end they represent best policymaker judgement, not the unadorned result of a single model (end-point) problems and all.

And finally, the Reserve Bank (aided and abetted by the Board) has always refused to concede it made a mistake with its (eventually reversed) tightening cycle of 2014 –  sold, when they started out, as the beginning of 200 basis points of increases.  The absence of any emphasis on the unemployment rate, or unemployment gaps, was part of what got them into trouble.  In the latest research paper there is a chart comparing the Bank’s current estimates of the NAIRU (see above) with their current estimates of the output gap.

nairu and output gap

The tightening cycle was being foreshadowed in 2013, it was implemented in 2014, it was maintained well into 2015.  And through that entire period, their unemployment gap estimates were outside the range of the output gap estimates.

We don’t have their real-time estimates of the unemployment gap, but we do have their real-time output gap estimates.  They might now reckon that the output gap in mid 2014 (blue line) was still about -1 per cent but in the June 2014 MPS they thought it was more like +1.5 per cent.

output gap from june 2014 mps

The failure to give anything like adequate weight to the direct indicators of excess capacity from the labour market (ie the unemployment rate and estimates of the NAIRU) looks –  as it felt internally at the time – to have contributed materially to the 2014 policy mistake.

(In this post, I’m not weighing into the specific question of what exactly the level of the NAIRU is right now, and the Bank does emphasise that there are confidence bands around its specific estimates, but I’m aware that is also possible to produce estimates in which the current NAIRU would be 4 per cent or even below.)

“Productivity” missing in action

There was going to be a post yesterday, on the Reserve Bank’s newly-published estimates of the natural rate of unemployment, the NAIRU etc.   But then, walking down the stairs at home, I went over on my right foot and, so it turns out, broke a bone.   And so now I sit encased in plaster for a couple of weeks, not able to do much of what stay-at-home parents do.  But I can still type and the NAIRU post might appear later in the day.

In the meantime, this morning the Tax Working Group released its Submissions Background Paper.  I’m sure there is plenty of interesting material in it, and in due course I’ll read it, and probably write about it (especially the capital gains tax sections).  But, out of curiousity, I electronically searched the document.   First, I searched for “productivity”    There were two footnotes referring to Productivity Commission documents, and one quote from the terms of reference for the Tax Working Group; one of the government’s objectives for the tax system is

·             A system that promotes the long-term sustainability and productivity of the economy

And that was it.

So I tried “productive”.  That produced four results, but

  • one was in the appendix reproducing the Terms of Reference,
  • one was in an appendix of questions for submittters”,
  • one was a question posed at the start of a chapter, and
  • the final one simply described the question the government had asked them to think about.

In other words, no analysis, no description at all.   The (short) Terms of Reference were weak on this score –  the clear focus was “fairness” –  but the TWG’s own much-longer document was even worse.    And just in case some serious analysis or discussion was lurking under terms like “the tradables sector” or a concern about growing “exports” I searched under various forms of those words, and there were no references at all.  Not one.

The yawning productivity gap isn’t the only problem or issue New Zealand faces, and it shouldn’t be the only consideration in the design of the tax system.   But when it is totally absent from the discussion document framing the Tax Working Group’s work, it simply further reinforces that perception (which I’ve writtten about here and here) that there is little reason to think the government is serious about grappling with the decades of relative decline.  I doubt that anything in the tax system is overly important in explaining that relative decline –  although a heavy tax burden on returns to business investment (especially FDI) won’t be helping –  but it seems extraordinary that the issue isn’t even touched on in the working group’s background document.


From the weekend current affairs shows

Two of the government’s top four ministers appeared on the weekend TV current affairs shows. It wasn’t encouraging.

The Minister of Finance appeared on TVNZ’s Q&A.   There was a great deal of talk about boosting wages –  after several years in which real wage growth has outstripped (almost non-existent) productivity growth.  But nothing about credible steps that might lift productivity growth itself.  It is easy to spend money, but much harder to generate the foundations for higher incomes in the first place.   And there seemed to be no recognition whatever that the real exchange rate has been increasingly out of line with the dismal productivity performance

rer and rel GDP phw

or, not unrelatedly, that the export share of New Zealand GDP has been shrinking, not rising.  And, of course, no plans, no suggestions even, as to what might be done to reverse this decline.

There was talk of the tax system having, it was claimed, underpinned a “speculative economy”, but no sense of how the Minister of Finance saw possible tax system changes producing materially different outcomes –  notably around house prices –  than they have in Australia, the UK, Canada, or much of the coastal US.    Nothing, of course, about fixing the fundamental problem: land-use restrictions, the effects of which appear to have become increasingly binding (some nice new evidence on just that point from Australia was published last week).

There was blather about the forthcoming ‘wellbeing budgets”, built on The Treasury’s living standards framework, but no sense of how decisionmaking was going to be improved or economic (or other) outcomes improved.

There was a lot of talk about the “future of work” –  one of the Minister’s favourite themes –  and the potential to support workers facing displacement by the advance of technology etc, at a time when the employment rate and the participation rate are both higher than they’ve been at any time in the 30+ years history of the HLFS data.

There was enthusiastic talk about the economic benefits of immigration, but no evidence or argumentation.  And for all the talk about “skills gaps” no recognition of the OECD data suggesting New Zealand workers are among the most skilled of any in the advanced world.  And for all the allusions to the role of immigrants in building houses, no apparent recognition of just how few construction workers are among the immigrants, or of the new research published by the Reserve Bank of which the authors note (and which in many ways just repeats what New Zealand economists knew decades ago)

The estimates further suggest population change may be ‘hyperexpansionary’ as the residential construction demand associated with an additional person is higher than the output they produce. In these circumstances, population increases raise the demand for labour and create pressure for additional inward migration, potentially explaining why migration-fueled boom-bust cycles may occur.

And that was just the Minister of Finance.

On Saturday, the Deputy Prime Minister and Minister of Foreign Affairs had been interviewed on The Nation.   When I read the news story about the interview I couldn’t quite believe what I was reading, and went back to watch the interview to see if Winston Peters was being fairly reported. He was.

It was bad enough to find New Zealand’s Minister of Foreign Affairs appearing to defend Donald Trump’s tariff policy.   I can understand that it might not have been diplomatic to have openly attacked them as rushed, ill-considered, dangerous and not grounded in any decent economic analysis.   In other words, stepping around the issue delicately would have been one thing.  But the defence of Trump was pretty shameful –  the more so in a week when the government of which he is Deputy Prime Minister was signing up to what it would have us believe was a new “free trade agreement”.

But rather than oppose the move as detrimental to free trade, Mr Peters said Mr Trump was reacting to unfair deals.

“What’s Donald Trump’s biggest complaint? It’s that countries shouting out ‘free trade for America’ don’t practise free trade themselves. In fact it’s New Zealand First’s and my complaint that the countries we deal with apply tariffs against us whilst we’re giving them total and unfettered access to our country. It’s simply not fair.”

He said Mr Trump’s move was “not Luddite, it’s not old-fashioned”.

“It happens to be an economic fact which some propagandists of the free market tenet should face up to, and describe why it’s not fair for Donald Trump to do what he’s doing.

Do the Minister of Finance, the Minister for Trade and Export Growth, and the Prime Minister agree with this sort of “trade as zero-sum” analysis and approach, that threatens to further undermine the WTO arrangements governing world trade, which have been of considerable value to New Zealand?

But our Minister of Foreign Affairs hadn’t finished.    He also went on record as one of the few people left, outside the Russian government, asserting that Russia had not been attempting to meddle in the US 2016 election.    Reasonable people might differ on whether there is any real evidence that such meddling made any material difference –  as staunch an anti-Putin anti-Trump observer as Masha Gessen remains very sceptical.  One might even take the view that it is not really any of New Zealand’s business.  But for our Foreign Minister to actually be weighing in in defence of Putin should be inconceivable, inexplicable, and indefensible.  Sadly, it is now only the latter two.

But even that was just the entree.  The crowning outrage was the attempt by our Deputy Prime Minister and Minister of Foreign Affairs to suggest that the Russian authorities had no part in any responsibility for the downing of the Malaysian airliner over Ukraine and the deaths of 298 people.  Sure, Vladimir Putin himself didn’t the fire the missile (leaders rarely do) but as David Farrar summarises it

the Dutch investigation found the Buk missile system was transported from Russia on the day of the crash, fired from a rebel controlled area and returned to Russia after it was used to shoot down MH17.

If the Minister just wanted to mount an argument that our firms can still trade with evil regimes –  a point he went on to make – that would be one thing.  After all, our governments have been pursuing deals with Saudi Arabia, even as it is primarily responsible for the ongoing disaster in Yemen.  If he wanted to make an argument that there are bigger threats to the world than Russia –  China say? –  reasonable people could also debate that proposition.

But to minimise the Russian regime’s responsibility for what was an act of mass murder of innocent, otherwise uninvolved, civilians is just shameful, indeed disgraceful.  It shouldn’t be allowed to pass quietly by by the Prime Minister, the rest of her Cabinet, or (say) the leaders of the Green Party on whom the government also depends.   What sort of country would we be becoming if a senior minister can get away with lines like this?

It seemed to be a weekend for trivialising the really dangerous stuff by use of spurious –  and insulting –  comparisons.   In the same interview, Peters seemed to compare Russsa’s actions in Ukraine (or the US) with Australia’s in legally deporting from Australia non-citizens convicted of committing crimes in Australia.  And in another interview a few days ago Peters seemed to be attempting to draw parallels between the activities of the government of the People’s Republic of China in the Pacific (and presumably New Zealand) and those of private citizens among the Samoan and Tongan diaspora in New Zealand.

Amidst fears about outside influence from the Chinese in the Pacific, Peters is quick to note that New Zealand possesses some influencers of its own.

“One of great forces in Tongan society is the Tongan society in New Zealand, that’s where an enormous amount of remittance money is coming from, and that’s the same for Samoa.

“So when you talk about outside influences, bear in mind that we have massive outside influences on Samoa.”

If you refuse to actually confront real threats, that is one thing, but don’t insult us – or our friends, allies, and even our citizens –  with such efforts at trivialising those threats, those behaviours.


The Treasury reminds us that GDP – and productivity – really is almost everything

In recent times, we’ve heard endlessly from The Treasury and the government about the emphasis they want to place on the “living standards framework” Treasury has been cooking up for some years for a left-wing government (the previous government had little interest).  We are constantly told that there should be less emphasis on GDP-based measures.

This was a news report just a few week ago

Prime Minister Jacinda Ardern was enthusiastic about the new approach in her speech in a church on Wednesday about the Government’s plans beyond the first 100 days. From 2019, Budgets would be delivered using new metrics designed to paint a more accurate picture of New Zealanders’ lives and encourage government to tailor spending to lift the country’s performance across those metrics, she announced.

Budgets would go beyond GDP per capita and debt to GDP ratios to analyse the wider effects on people’s wellbeing and the state of the environment in an inter-generational way, she said.

“By Budget 2019 Grant and I want New Zealand to be the first country to assess bids for budget spending against new measures that determine, not just how our spending will impact on GDP, but also on our natural, social, human, and possibly cultural capital too,” she told the crowd.

I’m among those who’ve long been sceptical of the Living Standards Framework, and the “four capitals” approach that is now its shop window.   It has always seemed content-light, and more about product differentiation (on the one hand), and a way of avoiding focusing on the decades-long record of productivity growth underperformance (on the other).   Treasury has had no compelling answers to the productivity failure, and so it must have been tempting to shift the focus. Since the new government evidently has no plan, and they have “feel-good” constituencies to please, it must have seem doubly appealing.

I’ve been meaning to write some more about some of the papers and speeches The Treasury has released recently, expecting to cast further doubt on whether the new framework is likely to add any analytic value, or improve the quality of policymaking.

But yesterday I noticed that The Treasury had saved me the effort.  On their Twitter feed was this retweet

vs. : What makes countries better off? IMF economists crunch the numbers. Read

It was drawn from this IMF piece. In it, the IMF reports

For years, economists have worked to develop a way of measuring general well-being and comparing it across countries. The main metric has been differences in income or gross domestic product per person. But economists have long known that GDP is an imperfect measure of well-being, counting just the value of goods and services bought and sold in markets.

The challenge is to account for non-market factors such as the value of leisure, health, and home production, such as cleaning, cooking and childcare, as well as the negative byproducts of economic activity, such as pollution and inequality.

Charles Jones and Peter Klenow proposed a new index two years ago (American Economic Review, 2016) that combines data on consumption with three non-market factors—leisure, excessive inequality, and mortality—in an economically consistent way to calculate expected lifetime economic benefits across countries. In our recent working paper, Welfare vs. Income Convergence and Environmental Externalities, we updated and extended this work, attempting to include measures of environmental effects and sustainability. In this blog we look at our results from updating the new index.

Our findings clearly suggest that per capita income or GDP does capture the main component of well-being. And health—a key component of well being—is critical to raising welfare and income.

The well-being index

What emerges from Jones and Klenow’s work is a consumption-equivalent index that measures welfare derived from consumption, then adds the value of leisure (or home production) and subtracts costs related to inequality. This calculation is made for each country over one year and then multiplied by the life expectancy in each country. This gives us a measure of average expected lifetime welfare based on consumption, leisure, inequality, and life expectancy. (Click here for a further discussion of the well-being index.)

There is a close relationship between our calculation of per capita welfare for 151 countries in 2014 and per capita income or GDP. The chart above [reproduced in the tweet] shows that most countries line up fairly well along the 45-degree line (where relative welfare and income per capita are the same) indicating correlation, but there are significant differences, too. Poorer countries on the left are largely below the line, showing that welfare is lower than income. Richer countries at the top right are above the line, reflecting welfare that is higher than income.

Enough said really.  There is little sign of any obvious gain from shifting the focus of the Budget, or The Treasury’s advice from GDP per capita, and the productivity measures –  GDP per hour worked, and MFP –  which are associated with them –  to amorphous living standards/ “four capitals” measures.

Of course GDP isn’t perfect.  And of course governments can boost GDP is welfare-detracting ways (eg conscription and forced labour), and yet The Treasury ends up promoting new research from the IMF suggesting that in fact countries don’t do so to any material extent (if it were otherwise more countries would be much further from the 45 degree line).  It suggests what everyone has always known –  that in setting policy governments do think about other stuff, not just GDP (check out all those Cabinet papers with “Treaty implications” section, as just one example).  And that measures that free people and economies to lift productivity, and with it potential GDP, remain the most salient and reliable way to lift key elements of living standards (not just material consumption).  Fix productivity and many other possibilities comes with it.   It still won’t capture everything, but beyond that a great deal involves explicit value judgements, in which area Treasury has no superior expertise or insight.

Perhaps instead of diverting so much of their analytical resource into the new-fangled, not particularly robust, tools and frameworks, The Treasury could return to getting the basics right: robust advice on expenditure, calling out bad or rushed policy when it is proposed/promised, and focusing in –  with a genuinely open mind – on the specifics of why New Zealand’s long-term productivity performance has been so poor.


Is the government doing some serious thinking about immigration policy?

The general impression since the formation of the new government has been that this government –  like its National and Labour predecessors –  is largely a champion of the large-scale immigration programme New Zealand has run for decades.  That impression has only been reinforced by the way corporate interests –  probably especially the export education industry – appear to have persuaded them to back off, at least for now, from even the modest changes around student work visas that the Labour Party had campaigned on.  But then I noticed this advert in my in-box (and no, I am not looking for a job) from a firm that describes themselves as “public sector recruitment specialists” (emphasis added).

Principal Policy Advisors x 6
Permanent

· Be involved in a new high profile programme of work
· Own and drive strategic policy and lead complex policy programmes
· Bring your fresh perspective and challenge the status quo

The Challenge
We are looking for six Principal Policy Advisors that are keen to take part in a unique government initiative, across five different policy domains.
As thought leaders, your work here is set to impact the New Zealand economy, its labour market, and immigration policies.
This is an opportunity to challenge your selves to put forward new ideas and bring a fresh perspective on managing one of New Zealand’s biggest and most complex issues.

Six Principal Advisors  – who don’t come cheap –  is a serious commitment of resource to whatever this “unique government initiative” is.

I don’t know what the project is –  perhaps someone could ask the Minister of Immigration or the Minister for Economic Development –  but in tight fiscal times, it certainly looks as though some agency has been found the money for something fairly significant on immigration policy.  If so, of course, it is not before time.

UPDATE (20/3):  A few days after this post this comment came in, and has been showing below.

Clive Horne

That seemed quite startlingly incompetent.

I had a further note from Mr Horne this noting that “unfortunately MBIE are still receiving enquiries around this. As mentioned the roles are around the teams involved in the labour market issues and are to fill existing vacancies not focused on a new initiative”.   At his request I have elevated his earlier comment into the body of this post.

And, as far we can now tell, there is no new thinking going on about immigration and economic performance, and MBIE has still not published the (well overdue) annual data on approvals etc under current policy (when I asked the other day, I was told it should be out by the end of April, six months late on the normal schedule.