Exchange rate moves: trivial in historical context

I saw a curious story the other day which reported the Minister of Finance and the National Party spokesperson on finance arguing over who was to blame (or who could take the credit) for the fall in the exchange rate that followed the Reserve Bank’s Monetary Policy Statement.  From one side there seemed to be talk of the fall being part of the much-vaunted (but little seen) economic transition –  the Prime Minister herself has claimed this –  and from the other talk of loss of confidence in the economy, combined with some inflation risks.

Mostly it seems to be a difference about almost nothing.  Here is one of the OECD measures of New Zealand’s real exchange rate, for which data are available back to 1970. Obviously, we don’t have Q3 data yet, but I’ve taken the fall in the nominal TWI measure of the exchange rate for this quarter to date (latest observation for the RB website today) and applied it to the Q2 data to proxy a current observation.

RER ULC aug 18

Over almost 50 years, there have been lots of ups and downs in the series, even in the period (up to early 1985) before the exchange rate was floating.  Some have been the start of something pretty sustained –  see the falls in the mid 70s, or after 1987.  Others have been very shortlived (see for example the fall in 1986 or 2006 –  times when, for example, markets got a bit ahead of themselves in thinking our economy was slowing and interest rates would be falling).     Over the full period (and this is quarterly average data, which takes out some of the noise anyway) there have been at least eight episodes when this real exchange rate index has fallen by at least 10 index points (roughly 10 per cent).  The last occasion was in 2015, as markets somewhat belatedly realised –  not quite as belatedly as the then Governor – that the Reserve Bank’s OCR increases weren’t going to be sustained.

This episiode isn’t one of them.  The latest (estimated) observation is a mere six per cent below the most recent peak (18 months ago).  And the latest observation is nowhere near the low reached in the second half of 2015.

In fact, the current level of the TWI is 2.4 per cent below the average level for the June quarter.   Over the entire life of the series (fixed and floating periods) the average quarterly change (up or down) has been 2.7 per cent.  Taking just the floating period (since March 1985), the average quarterly change has been 3.1 per cent per quarter, and if we take just this decade (which, eyeballing things, has been a bit more stable, at least as regards big sustained moves) the average quarterly change has been 2.4 per cent.

Perhaps the fall we’ve seen so far this quarter (or even since the MPS last week) will be the start of something more.   If there is a serious global risk-off event, or a serious New Zealand downturn, that probably would happen.  But all we’ve seen so far is a change that is about the size of the change one sees, on average, each and every quarter –  some up, some down, and most not implying anything very much for the economy.

The idea that the fall foreshadows some promised rebalancing in the economy is pretty laughable.  There have been no policy changes to bring about any such rebalancing (any more than there were with the other –  larger –  falls in the previous 20+ years).  Then again, so is the notion that a lower exchange rate –  a modest fall at that –  is a material inflation risk.    The Reserve Bank itself published research a few years back suggesting noting that, in fact, a lower exchange rate has tended to be associated with lower non-tradables inflation, and often –  notably when commodity prices are also fallling –  with lower overall inflation.


How poorly have Australians done?

Much of this blog focuses on the dismal long-term performance of the New Zealand economy.  A common benchmark is to compare our performance against Australia: once (and for a long time) we more or less matched them, these days we languish well behind, and as a result a huge number of New Zealanders have left for better opportunities abroad, notably in Australia  –  still, fortunately, a place where New Zealanders are relatively easily able to move, if not (any longer) to securely settle.

But how has Australia itself done?

Here is how things were 100 years or so ago, in 1913 –  the eve of World War One, the end of the first great age of globalisation.  And Australia itself had finally recovered from the devastating crash, financial crisis etc, after 1890.  The data are real GDP per capita (in 1990 dollars) from the Maddison database.

1913 GDP

Australia (and New Zealand), far from the industrial heartland of the North Atlantic (recall that the Industrial Revolution had spread out from the UK, and then places like Belgium, Netherlands and northern France), in 1913 had per capita incomes twice those of places like Norway and Italy, 50 per cent more than France and Germany, 25 per cent more than Belgium and the Netherlands.  Only the United States matched us (some years a touch higher, some a touch lower).

And here are the top 25 countries from the latest IMF WEO database.

2017 GDP pc

You could toss out some or all Macao (tiny, and really just past of China), San Marino (really tiny), Hong Kong (China), Ireland (numbers not really reflective of Irish incomes because of the corporate tax system) or Luxembourg (much GDP is produced by people living in neighbouring countries but working in Luxembourg) if you want, and Australia would still only just get into the top 15.   Australian per capita is now less than that of most of the countries in the first chart –  only just edging out Taiwan.

Comparable productivity data going back a long way are scarce. The Conference Board data on real GDP per hour worked start in 1950.   There is only data for about 30 countries for 1950 (mostly the advanced countries).  But of those countries, only the US and Switzerland were ahead of Australia.

2017 real GDP phw

Again, you could safely ignore the Irish number, but doing so doesn’t change the story.  Australia has slipped a long way back, and is now nowhere near (say) that bracket of Germany, Denmark, Netherlands, the US, and Belgium. (Taiwan –  see previous paragraph – is just behind Italy on this measure).

Here is one way of looking at the performance over decades.  Both Australia and  Norway abound in mineral resources (in Norway’s case mostly oil and gas, in Australia’s a huge range).    Belgium, Netherlands, and Denmark are three high-performing European countries, where the data aren’t complicated by tax systems (Ireland), absorbing a failed communist state (Germany) and the like.

aus norway 2

Back in 1970, both Australia and Norway (before the minerals booms really got underway) had slightly higher average levels of productivity than the average for those other three northern European countries.  In Norway, the development of the oil and gas resources from the 1970s seems to have contributed to a marked widening in average productivity (and incomes) in Norway’s favour.  That margin has narrowed a bit in the last decade –  oil itself is past its peak in Norway –  but there is a still a large margin (over Europe’s other high productivity economies).  And what of Australia?  Even now, after a decade with the challenges of the euro crisis, the marked slowing in productivity growth at the global frontiers, and with the huge new mineral resources that have been opened up and brought to market by Australia, Australian average productivity still languishes a long way behind.  Even now –  after their reforms (80s and 90s) and their new resources – the margin between Australian productivity and that of these northern European countries is only about where it was in the mid-80s.  At that time, there was a great deal of angst (similar to NZ) about Australian’s relative decline.  In fact, Paul Keating’s “banana republic” line dates from then.  There has been no reconvergence since then.

With staggering volumes of newly-economic resources able to be brought to market, it is really a quite remarkably mediocre economic performance.   One might quibble about things like Australian labour market laws, but Australia is a functioning market economy that still scores quite highly on economic freedom indices.  This is no Venezuela.

And yet, for all its riches –  and you see (in the second chart above) the difference natural resources can make – Australia is no better than a middling performer among the (old) OECD countries it once mostly far-outstripped.

I’m not here to scoff –  New Zealand has, after all, done so much worse, and the embarrassing exodus stems from that –  but to analyse and learn.   I’ll offer some thoughts on reasons why in another post, probably next week.

A British visitor championing free trade and open borders

Last Thursday British journalist and economist Philippe Legrain gave a lunchtime address at Victoria University (of Wellington).   Legrain was apparently in the country mainly to talk about some work he does on refugees and employment, but this particular event (hosted by the New Zealand Initiative) was on the topic “How our open world is under threat, and why it matters”.   He is a Blairite (ie active government)  globalist (a term I don’t mean in any pejorative sense) –  favouring, it appears, as much open trade, open investment, and open migration as possible, and then some.   For anyone sufficiently interested, the Initiative has now posted a video of Legrain’s talk.

I found it a strangely unsatisfying talk on a number of counts.   Perhaps it worked for those already converted to his cause, but even then there wasn’t anything new, or any fresh arguments or evidence.   And it didn’t greatly help that despite being an obvious fan of New Zealand (or at least of the fourth Labour government) he didn’t know much about it, despite speaking to a central Wellington audience probably largely made up of policy wonks and junkies.

In his younger days, Legrain had worked as an adviser to Mike Moore in his time as head of the WTO.  There, I presume, he had picked up stories about the sheer dreadfulness of New Zealand 35 years ago, and heard tales of the subsequent reforms.  We were, he claimed, in some respects the “birthplace of globalisation”, which still – reflecting on it days later –  seems a very odd claim.  The reformers of the 1980s mostly saw the reforms as being about bringing New Zealand policy back more into line with the mainstream  of advanced country practice (even if, with a small single chamber parliament, some reforms could be pushed through in more elegant and intellectually appealing ways than some other countries managed).   Lamenting (quite rightly) the insanity of the days when New Zealand assembled television sets (and cars) here from disassembled kits, Legrain (again, fairly enough) observed that New Zealand needed to do more international trade.

But then his tale became rather more detached from reality.  We were told that New Zealand had “flourished” since the early 1980s, we were “richer, freer, more diverse, better connected”, we’d found niches in world markets (he mentioned film-making, apparently oblivious to the subsidies so generous they’d have made an early 80s sheep farmer blanch), had better economic growth, and higher living standards.  All because we’d opened to the world.

All of which would have been a good story.  It was, after all, the way things were supposed to be.   But what of the evidence?

Foreign trade for example?  Successful small economies tend to do a great deal of it, and there is no doubt that the protective structures we wrapped around the economy for 40 years or so tended to reduce both exports and imports as a share of GDP.  But here is how the export and import shares of the New Zealand economy look, for the first four years of the 1980s and for the last four years.

foreign trade

I think I am pretty safe in saying that no one involved in the reform process 30 years ago envisaged our foreign trade shares shrinking.

And what of the “richer” claim?  Well, certainly real GDP per capita and real productivity measures are higher than they were, but that is true almost everywhere (Venezuela perhaps excepted): there are common global forces, technological innovation etc, at work.    What matters, in assessing the success of New Zealand policy, is how New Zealand has done relative to the rest of the world, and in particular to the other advanced economies we’d been falling behind for several decades.   Since 1983, New Zealand’s productivity growth (real GDP per hour worked) has been in bottom quartile of the 25 countries the OECD has complete data for.  If you prefer simple GDP per capita comparisons, then despite a big sustained gain in New Zealand’s terms of trade  –  almost totally beyond our control –  we’ve fallen further behind the G7 industralised countries on that score over the same period.

It isn’t even as if things went badly worse for a few years and are now coming right: trade shares are still trending down, we’ve had almost no productivity growth in recent years, and so on.   If New Zealand really was the “birthplace” of globalisation, advocates such as Legrain should be looking to bury the evidence –  or, more to the point, think more deeply about what aspects haven’t worked well, and whether some things matter here in ways they mightn’t matter elsewhere.

He was a bit hazy on his geography too.  In (fairly) noting that trade deals between a post-Brexit Britain and New Zealand won’t make much difference for either country, he launched into the old line about New Zealand’s future being in Asia, and our great good fortune in being on the doorstep of the fastest-growing part of the world.  It probably escaped his attention but Wellington and London are each about the same distance from Shanghai, and London is much closer to Delhi or Mumbai than Wellington is.

Legrain’s misconceptions about New Zealand continued to the present.  He is a big fan of immigration –  having written a whole book about it under the heading Immigrants: Your Country Needs Them – and lamented that New Zealand was slashing its immigration numbers by a third.   I presume this was an allusion to the Labour Party’s policies in last year’s campaign, which might (on their estimates) have reduced the net inflow by about a third for one year.  But perhaps he hadn’t caught up with the fact that the government seems to be following through on very little of that, and (more importantly) that they never promised, or even suggested, any reduction in the annual target for new permanent migrants.  That target remains probably the highest, per capita, anywhere in the world.  But never mind; don’t let troublesome details get in the way of a rhetorical flourish.

Perhaps my description of Legrain as a “globalist” was best-exemplified by one of the items on his list as to how the world is going to pot.  He was, he noted, disturbed that New Zealand had a party in government whose name was “New Zealand First”.    I’m no fan of the party itself –  any more than any of our parliamentary parties –  but precisely whose interests does he suggest that governments should govern in?    He didn’t elaborate, but pursuing first and foremost the interests of your own citizens (or even residents) seems pretty basic to me.  And not very contentious among most citizens –  here or abroad.    Quite often, of course, what is good for us is good them (and vice versa)  –  free trade in goods and services is generally the prime example –  but the case for any New Zealand government action should be that it advances the interests, attitudes and values of New Zealanders.  Sometimes those decisions will be altruistic in nature –  taking in refugees for example  – reflecting the values of New Zealanders.  But most of us want our governments to respond to, and promote, the best interests of New Zealanders.  Legrain clearly doesn’t.

Now, I should make clear that I am a strong supporter of free trade in goods and services.  I’ve long argued, for example, that we should remove all our remaining tariffs unilaterally.  Legrain hates Brexit, but the fact remains that the current difficulties are mostly arising because the EU does not believe in, or practice, that sort of free trade.    I’m also a supporter of a pretty open approach to foreign investment, at least when it doesn’t involve state actors (and even Legrain noted that, thus, China should be something of an exception).   Actually we also apparently share a view that trade agreements among advanced countries –  if we must have them at all –  are not a place for things like ISDS agreements or intellectual property rules.

Where we differ quite strongly –  and this would be particularly so on New Zealand, although the point generalises –  is probably around immigration.    Because in his paean to globalisation he draws no distinction between free movement of goods, of capital, and of people.    But voters appear to, and often for good reason.  Legrain, unlike many voters, doesn’t appear to have much time for concepts of nationhood, or cultures which bind societies together.   As the child of immigrants (French and Estonian) himself, perhaps that isn’t overly surprising, but most people have a different, more localised, background.

10 years or so ago, Legrain wrote a book in praise of immigration, an excerpt from which is available on the web. In it he declares himself scandalised that a politician can win an election on the promise that “we will decide, and no one else, who comes to this country” or that people would think it “normal and reasonable” to control migration flows.  He laments the fact that migration policy is largely decided on national grounds.

It was a book written just before the 2008/09 recession, when Blairite globalists of his sort were in the ascendant –  things felt rather good, especially if you were a successful middle class person in a major financial centre like London.   He captures some of that in this extract

the debate that is at the heart of this book: should we welcome or seek to prevent the unprecedented wave of international migration that is bringing ever greater numbers of people from poor countries to rich countries like Britain, Spain and the United States? Fear of foreigners versus the dynamism of multicultural London: a microcosm of the wider debate about immigration that is raging around the world.

As if these are the only choices; the only (or best) way of framing any debate.

He didn’t actually use the word “xenophobia” there, but that is what “fear of foreigners” is: apparently the only grounds why anyone might be sceptical of large scale permanent immigration.  But however things might have looked in 2007 –  when the UK and Spanish economies were indeed booming –  the subsequent decade isn’t necessarily such an advert for Legrain’s open border approach (the UK, for example, having had almost no productivity growth at all since then).

And although Legrain continues, as he did in his lecture the other day, to champion the view that countries need migrants, he offered very little in support of such a view.   The potential for relative prices to change –  whether to attract aged care workers or strawberry pickers, or substitute technology –  never seems to enter his calculus.  You might suppose his own country would be a prime illustration of his point: if relatively open immigration really offered the large gains to recipient countries’ own nationals as Legrain claims, a country that had very little immigration for a long time, and then opened up quite a lot should be a great case study.  That was the UK experience after 1997.  And yet, a couple of decades on, where can people like Legrain find the whole-economy evidence of how Britons have benefited to any great extent (and this in a country in a very favourable geographic location, with foreign trade heavily dominated by services and other intangibles)?  If there are macroeconomic gains, they look pretty hard to find even there (and even if one simply abstracts from the house price disaster –  as Legrain does with an wave of the hand, and a simple “well just build more houses”.  Would that it were politically that easy, there or here.)

And New Zealand, of course, should be able to be his other showcase economy.  After all, we’ve had high levels of target non-citizen immigration –  much higher per capita than the US and the UK –  for a long time now.  But, beyond the handwaving and the pretty trivial (Legrain mentioned an apparent choice of Cambodian restaurants in Wellington), even the defenders of the current policy approach find it difficult to demonstrate the economic benefits to natives, and often seem left falling back on a “well, it would have been even worse otherwise” type of assertion.   Legrain’s world doesn’t seem to have much place for geography or natural resources –  perhaps not that surprisingly when you come from London – and, as already noted, he seemed oblivious to the failure to grow the trade sector of the economy, or the continued heavy dependence on natural resources, not obviously enhanced by simply bringing in lots more people to one of the most remote places on earth.

I think the New Zealand arguments are, or should be, different from those in countries nearer the centre of affairs.  But even in those countries, the advocates of relatively large-scale migration –  and actually in all European countries the numbers (per capita) are modest by New Zealand, Australian or Canadian standards –  struggle to demonstrate that citizens of recipient countries are benefiting.  Perhaps some of the middle classes do so –  cheaper nannies or strawberry pickers (the sort of complementarity story Legrain advances) –  but as I’ve noted before, to the extent this argument has force, it explicitly involves a redistribution in which poorer or less skilled natives are further disadvantaged.  If we should expect our governments to govern first and foremost in the interests of their own people, I’d argue that it is also important that governments govern with a particular eye on the interests of the most vulnerable or disadvantaged of their own people.   And there is no real evidence of the sorts of economic gains people like Legrain, or international agencies like the IMF have touted.  Of the IMF modelling, as I wrote a while ago

…the model also implies that if 20 per cent of New Zealanders moved to Australia (oh, they already have) and an equivalent number of Australians moved to New Zealand, we could soon be as wealthy as Australia is now, simply by exchanging populations.   Believe that, as they say, and you’ll believe anything.

As it is, large-scale non-citizen migration has skewed the entire structure of the New Zealand economy against producing competitively with the rest of the world (the real exchange rate has got quite out of line with the productivity performance and opportunities here).   We are reduced to living with sustained underperformance (often while our leaders pretend otherwise), with subsidies for trees (lots of them), trains, and other provincial baubles to attempt to buy off simmering discontent in parts of the country that should be doing really well.

Globalists like Legrain seem reluctant to accept that large scale immigration is mostly oversold as an economic instrument (if there are gains to natives, even in the North Atlantic countries, they appear small) or that the angst that he worries about (in lamenting Trump, Brexit etc) about it is often cultural and national in nature at least as much as it is economic.  For people like him, the world is made up of autonomous individuals, in which people of a country are united by, if anything, only a common passport and the authority of a common government.   Most voters in most countries see it as more than that –  they put a value, not just sentimental but practical, on common cultures, shared history and experiences and so on.  My own arguments about New Zealand immigration don’t really go along those lines –  I’ve repeatedly made the point that all our migrants could be from Bournemouth, Brisbane, Buffalo or Banff and the economics still wouldn’t work out well –  but people who champion an open economy, and the real gains on offer from foreign trade, risk losing that battle if they don’t wake up to the fact that people movements are different in all sorts of ways, and support for free trade has no natural or inevitable implications for a view on appropriate immigration policy.


The Governor and the PM

I hadn’t been going to write any more about last week’s Monetary Policy Statement and associated comments from the Bank’s senior management, but then I heard the Prime Minister on Radio New Zealand this morning invoking the Bank in support of her story that everything is just fine in the economy and that we are in the midst of some transition or rebalancing of the economy towards one that is more productive, less driven by immigration etc etc.

The Governor was interviewed on TVNZ’s Q&A programme, broadcast on Sunday night.  He was remarkably upbeat –  in line no doubt with the rather glib claim in his press conference last Thursday that he thought the New Zealand economy was in a “wonderful spot”.    While acknowledging that economic growth had slowed –  and how could he not with even rather lagged hard data like this

gdp pc to mar 18

he claimed there was only “a very low risk” of the economy “stalling”.    The Governor didn’t attempt to define “stalling” and nor did the interviewer push him to do so.   To me, “stalling” doesn’t sound disastrous –  not the economy going off a cliff into a deep recession –  but perhaps zero or negative per capita GDP growth might qualify?  If so, the data suggest we were already there months ago and the Governor’s own forecasts don’t suggest that June quarter was any better (forecast GDP growth of 0.5 per cent, at a time when population growth is about 0.4 to 0.5 per cent per quarter).

Another dimension of “stalling” might be something around productivity growth.  There has been none –  at all –  for the last three years.   And the Governor’s forecasts suggest productivity growth will have been negative in the most recent quarter (GDP growth of 0.5 per cent, and hours worked –  average of the two measures –  up 1.2 per cent).

Of course, the Reserve Bank predicts that things turn up from here.  But that is almost par for the course.  In their August MPS last year, they predicted real GDP growth of 3.8 per cent over the four quarters to June 2018.  Now  –  with three quarters of actuals in the bag –  they reckon that growth rate will have been more like 2.2 per cent.     Perhaps they’ll be right this time –  they now reckon 3.5 per cent for the three quarters to June 2019 – but the recent track record isn’t encouraging.

Actually, even the Bank’s chief economist seems a bit uneasy.  He was quoted in an interview the other day suggesting that really people just needed to think more positively

“Animal spirits in an economy matter,” McDermott said. “It is possible to talk yourself into a recession. You can generate self-fulfilling expectations, we recognize that. The more that happens, the more we’ll try and lean against that. The economic fundamentals say it should be okay, but there’s a psychological problem that sits there.”

without seeming very confident that it would happen.

“In the September quarter we’re expecting things to be more back to normal, the fiscal policy starting to get some traction at that point, the net exports to start picking up,” McDermott said. “If we don’t hit that one, it’s like oh, have we got it wrong? That will be a real test.”

But back to the Governor.  What can he cite in support of his story?  Not very much as it happens.  He listed a lower exchange rate, world growth that is “strong”, fiscal stimulus, private consumption, and the fact that in his view “business investment should be increasing”.   A little later in the interview he went on to elaborate his investment story, asserting that with capacity constraints, demand very strong, and the labour market very tight, it was a good time to invest.  What’s more, he suggested, interest rates were low and firms “should be investing”.

It always seems a bit rich of public servants to be trying to tell businesses, with their own money on the line, what they should and shouldn’t be doing, but even setting that to one side, there isn’t very much in the Governor’s claims.

For example, the Governor knows better than to suggest that interest rates are low for some random reason unrelated to the economy.  On his own reckoning neutral interest rates have come down quite a bit, and (again on his own reckoning) the actual OCR is far below the neutral OCR because there just isn’t enough aggregate demand, or inflationary pressure, to support higher interest rates.

What about world growth?  Well, we can all read the headlines around Turkey and other emerging markets, but even putting those to one side for now, the most recent IMF numbers suggest world growth this year and next much the same as that last year (the world backdrop to New Zealand’s mediocre performance), and the IMF observes

Global growth is projected to reach 3.9 percent in 2018 and 2019, in line with the forecast of the April 2018 World Economic Outlook (WEO), but the expansion is becoming less even, and risks to the outlook are mounting.

There is a probably bit more fiscal stimulus in New Zealand than there was last year, or than there might have been under previous projections, but the differences of magnitude are pretty second order (government operating surplus forecasts are about half a percentage point of GDP lower than the forecasts the Reserve Bank published a year ago).

What of business investment?

bus investment aug 18

It has been pretty subdued right through this decade.  That has also been true in a number of other advanced economies, but three things most other countries didn’t have should have been supporting business investment here: the earthquakes (commercial buildings needed replacing/repairing too, and these are gross measures), a strong terms of trade –  another thing the Governor likes to quote –  and very rapid population growth. Oh, and we had huge opportunities to catch-up with the OECD productivity leaders.  But businesses –  looking to their own bottom lines –  just haven’t seen the opportunities here.   It isn’t clear why that is about to change to any great extent.  Sure, the labour market is a bit more in balance (on the Governor’s own NAIRU estimates, not “very tight”) but on the other hand population growth is projected to slow, the global environment doesn’t look overly propitious, and there is a great deal of uncertainty about various aspects of domestic policy, and some measures which are simply hostile to business investment.

Incidentally, the Governor’s business investment forecasts don’t back his rhetoric.  Here are projections (for growth in real business investment) from the latest MPS

bus investment projection aug 18

Growth in the next few years is projected to be less than in the last few years.

Both the Prime Minister and the Governor like to talk up the fall in the exchange rate, but again it is a case of nothing much there.  The Governor knows that, and having now been in office now for almost a year, the Prime Minister should too.    Despite headline talk of a sharp fall in the exchange rate, the TWI at its current level (71.6 this morning) is less than one standard deviation below the average level for this decade to date: a decade which, notwithstanding the high terms of trade, has seen the share of exports/imports in GDP shrinking.   The TWI was lower than the current rate only three years ago.  Morever, no small part of the fall in the TWI over the last year is likely to have been because markets have become less optimistic about the (relative) performance of the New Zealand economy (see, for example, those downward revisions in even the Bank’s own growth forecasts).  The Governor talks often of some other countries moving to tighten monetary policy (although really only the US has done so to a significant extent), but his own stance is no change is likely here for some considerable time, and that a cut is as likely as an increase (the McDermott comments above suggest he thinks a cut in perhaps more likely).   Were the Governor’s rhetorical upbeatness (“wonderful spot”) etc prove to be correct, it isn’t likely that the exchange rate would remain low for long.

And, unsurprisingly when dealing with such modest exchange rate moves, the Bank’s projections don’t really back up again sort of “reorientation towards exports” story.    In the latest set of projections, the Bank expects export volume growth over the next three years of around 10.5 per cent in total (about 3.5 per cent per annum).  Over the previous three years, actual export growth was about 10.3 per cent.

And, finally, what of the Governor’s story (or that of the Prime Minister) that we in the process of transitioning away from an economy that just has more people to one based on…well…something else.   Here are the Reserve Bank’s net migration projections from the latest MPS

net migr aug 18

and here are their projections from 12 months ago

net migr aug 17

About the only difference is the scale (the top chart is annual, the bottom one quarterly).

For better or worse, the current government’s immigration policy is all-but identical to that of the previous government.  There may well be a cyclical fall-off in the overall net inflows, but they won’t be because of any change in immigration policy, but because the Australian labour market is doing better.

Asked explicitly in his TVNZ interview the other day whether he bought the government’s line about the economy being in the midst of a transition, the Governor agreed. But it wasn’t a very compelling answer.   He noted that we were moving away from a post-recession recovery phase –  but the recession itself ended 9 years ago –  and that we were moving beyond the Christchurch repair and rebuild process – which peaked several years ago.   And, as I just noted, it isn’t as if immigration policy has changed to any material extent.

So it isn’t clear what this “transition” towards some better tomorrow, that the Prime Minister keeps talking of, really consists of.    The real exchange rate remains very high, years of high terms of trade haven’t translated into a business investment boom, and the economic strategy still seems to depend largely on just bringing in lots more people, mostly not overly skilled, every year, to a land where opportunities were (a) always constrained, and (b) are in the process of being made more constrained by conscious government policy (eg oil exploration ban, net-zero carbon targets).    And for all the talk of somehow moving away from housing investment towards “more productive” investment, a key element of government policy is Kiwibuild, which is supposed to build more houses.

As for improved productivity, the Reserve Bank’s forecasts certainly assume it.  But then they always do.    Three years ago, they thought total trend productivity growth for the three years to March 2018 would be 2.1 per cent; they now think actual trend growth over those years was -0.1 per cent.  Two years ago, they forecast trend productivity growth for the three years to March 2019 would be 2.0 per cent.  They now think it will have been 0.3 per cent.  And so on.  The Bank doesn’t have a strong focus on productivity, and tends to assume some sort of return towards longer-run averages.   We must hope they are right this time, but if so it is likely to be only by chance, rather than because the Governor and his staff have any particularly strong insight on what might improve the longer-term structural performance of the New Zealand economy.

If one tries to work out the mental model the Governor is using, it seems to come down to not much more than that house price inflation has slowed, and that that in itself will put the economy in a better place.  But there is little robust foundation for such a story –  welcome as the slower house price inflation is likely to be to potential entrants to the market.  After all, it isn’t as if the household sector in aggregate has been on some sort of wild spending spree in recent years, backed by the illusory “gains” to real wealth from rising house prices.

household C

It is hard to avoid thinking that both the Prime Minister and the Governor are engaged more in spin (trying to keep spirits up) than in hard-headed economic analysis.   We should expect better, especially from the Governor, but then he still has lots of turf battles to fight, and it pays to keep onside with the political masters who will make those decisions.

And to be clear, the deep-seated problems with this economy were already there – and increasingly apparent – under the previous government.  Nothing much the current government is doing (or talking of doing) suggests that any of them are likely to fixed under the present government, and the risk remains (seems quite high) that –  even cyclical ups and downs aside –  the real underperformance just continues to worsen.

10 years ago we had a new government that talked of catching up with Australia by 2025.  Perhaps they never quite believed it, perhaps it would have been a stretch to have actually done it by then. But I don’t recall anyone –  National or Labour – 10 years ago talking up the prospect of material further widening in the productivity gaps.  But that is what happened, and now we start out even further behind.

aus nz productivity

And yet the Governor can continue to tell us we are in a “wonderful spot”.  In what alternative universe?


Plastic bags

There is a reason why we do not let primary school children make policy or vote.  They are children, precious and growing but prone to all the enthusiasms of children, easily influenced, and not responsible (as taxpayers or anything else) for their expressed preferences.   And yet, as the Prime Minister was reported, it seemed that the fact that lots of school children had written to her about plastic shopping bags was almost enough in itself to justify a decision to ban them.  And how many of those letters in turn were subtly –  or not so subtly –  prompted by teachers, themselves disproportionately likely (at least based on the sample I’ve seen over 10 years and four schools) to be Labour and Greens supporting?  Has a child in central Wellington ever came home enthused by a teacher regaling them with the creative wonders of the market, of innovation, or prosperity?  (Let alone any other traditional virtues.)

Having now read the government’s consultative document on the planned ban on plastic shopping bags, I was pretty staggered by how bad it was.   Since the document is actually released under the name of the Ministry for the Environment, has the New Zealand public service now sank to such a low level of “analysis” and evaluation?  Or were they simply overruled by ministers with an agenda, and no analysis?  Either way, there is little positive that can be said for it.

Just for clarity –  since this didn’t really come through in the media reporting I saw – this is what it is proposed to ban:

A new plastic bag (including one made of degradable plastic) which has handles and is below a maximum level of thickness. The terms ‘plastic’ and ‘degradable’ (including ‘biodegradable’, ‘compostable’ and ‘oxo-degradable’) would be defined in regulations with reference to international standards.

Thus, oddly, of the 31 bags I brought home from the supermarket the other day, only 15 will be outlawed.  But there is no hint in the document as to why one sort of bag –  that one might put beans or apples in, or in which bread rolls might come wrapped –  is less problematic environmentally than the bags (with handles) that I might then carry the groceries home with.

Since one tends to notice these things once attention is drawn to them, I’m also relieved to find that the two newspapers a day that arrive at our house will still be able to be wrapped in plastic (definitely never re-used after it is ripped open), and that the various magazines that arrive each week wrapped in plastic will also still be okay.  But why?  What is the difference?    Will the bag my newspaper was in be less likely to blow round than the bags the groceries were in?  No evidence or argument is offered.

It is a simply incoherent approach, apparently grounded on no analysis whatever (at least none they have sufficient confidence in to expose to scrutiny –  perhaps it will biodegrade in sunlight?)

As it is, the document highlights just how small a problem – if “problem” they are – plastic bags are.   Here is total use

Industry estimates of current consumption in New Zealand of standard supermarket single-use shopping bags are 154 bags per person per year. This is about 750 million bags per year, or about 0.01 per cent by weight of total waste in levied landfills.

0.01 per cent of landfill waste.

There is more

Published urban litter count data does not differentiate plastic shopping bags from ‘unclassified packaging’, which makes up 10.8 per cent by count in ‘visible litter’. Takeaway food and drink packaging makes up an estimated 40.2 per cent, and non-packaging litter makes up 42.4 per cent.

And recall that the proposed ban isn’t going to ban all plastic shopping bags, only the ones with handles, which must make up quite a small proportion of even that 10.8 per cent of total “unclassified packaging”.

Or take these (unverified) estimates from various “coastal clean-up events”

Figure 1: Coastal clean-up data, New Zealand, top litter categories by … weight

plastics 2

(the orange bars are items wholly/largely made of plastic).

So even if you were wanting to focus policy on the potential impact of plastic litter on marine life etc, it is far from clear why you would make a start on plastic bags (again, recall that the class of plastic bags the government proposes to ban is only a fraction –  no estimates from them as to what fraction –  of total plastic bags).  Rope and buoys/floats do rather stand out, as do plastic drink bottles.    As I read the consultative document, it is all plastic, and will also break down over time into stuff that might do bad stuff to marine life or even humans.   But the government is just coming for our shopping bags.

I used the word “might” a couple of sentences back.  I don’t claim any expertise in the science: here instead I’m quoting the Associate Minister for the Environment, Eugenie Sage in her Message at the front of the consultative document.

There is early evidence of the toxicity of these plastic particles to marine species, and potentially the human food chain.

I was quite surprised by her rather modest claims (“early evidence”, “potentially”).  Surely that uncertainty would then be reflected in the cost-benefit analysis for any regulatory intervention?  Oh, silly me.  That assumes there is a cost-benefit analysis, but in this document there is nothing even remotely resembling such a standard part of the policy analysis toolkit.   And that is even though they explicitly acknowledge of what evaluation they did do

This assessment was based on information from overseas experience, which has many gaps in relation to these goals.

So what is the rush?  Why not do your evaluation rigorously and robustly, clearly identifying your assumptions when there is (as there always is) inevitable uncertainty?  And how about pricing the option of waiting, or incentivising the development of genuinely biodegradable bags?

But actually the clue to what is going here is actually repeated several times in the document, this from the Executive Summary.

plastics 3

In other words, we want to be in your face about it, and we can inconvenience almost everyone.

It isn’t about marine pollution or the potential toxicity of plastics, but a stake in the ground for a strategy which, if pursued, would up-end the way we do things across the spectrum of economic life, all based on the new dogma known as “the circular economy”.

I’d noticed a reference to this concept a few months ago in a speech by a senior Labour minister (this stuff isn’t just Greens flakiness) but hadn’t paid it much attention.  But here is what the government says in the latest consultative document.

plastics 4

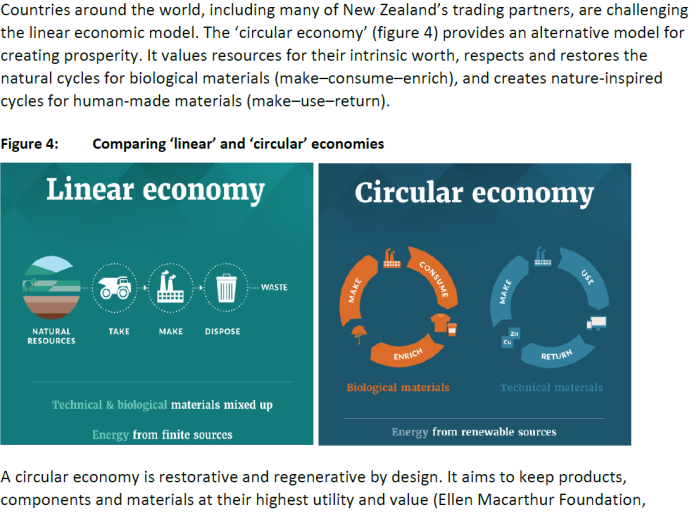
With not a single reference, at all, to the role of the price system in signalling the best uses for resources, best productive processes etc etc, it looks a lot like economic illiteracy hallowed by a major government ministry.  There is, for example, no hint in any of this –  presented as some easy alternative –  about the labour costs in each of these approaches.   No one doubts that the earth has finite resources –  heck, even the sun will burn itself out one day –  but on this standard of analysis, government would never have let the Industrial Revolution (or all the huge improvements in material living standards that flowed from it) occur.

If there are unpriced externalities, identify them, estimate the significance of them, and look at the options for pricing them.  That would be pretty standard economic analysis.  You might even focus first on the most significant sources of marine pollution, not the feel-good ones, deliberately designed to inconvenience almost everyone.

Because this isn’t just some new analytical framework for academics to play with. It seems to be a policy agenda

Actions to phase out aspects of a linear ‘throwaway culture’ are part of a transition to a circular economy.

If the Prime Minister, James Shaw, Eugenie Sage and the rest of them haven’t come for your water bottle, your disposable coffee cup, your newspaper wrapper, your fresh produce bag at the supermarket, the tray supermarket meat comes on, or the carton your Chinese takeaways come in, this document suggests it is only a matter of time.  Standard economic analysis would suggest that provided the true economic cost of landfill provision is charged for (eg) these are cheap and efficient technologies improving the living standards of New Zealanders.

As I’ve already noted, there is no cost-benefit analysis in the document.  Specifically, there is no overall summary estimate.  But there is also no attempt to put a dollar value on any one of the various potential costs and benefits (some identified, others ignored completely).  How do we value the potential reduction in the poisoning etc from marine life? I have no idea of the appropriate number, and the documents suggests (by silence) that MfE and the government have no idea either.  Since that is, purportedly, the main benefit of the policy, it seems like quite a gap.

And if there is no cost-benefit analysis, there is also no decent distributional analysis. But there is this stark statement

Some consumers on low incomes may nonetheless find the up-front cost of multiple-use bags unaffordable. One possibility is to provide support, such as offering discounted bags to holders of Community Services Cards and Gold Cards.

So yet another policy proposal –  from the party the campaigned that it was on the side of the poor and the marginalised – that will hit the poorest hardest (as the net-zero climate proposal will).  And that on the government’s own reckoning.    But it does rather highlight the point about why supermarket shopping bags with handles exist: because they are cheap and efficient.

Strangely, there is also no real analysis of where the savings to retailers (from not providing bags) are likely to go.   Again, from a left-wing government, the first option listed in a “windfall profit” to retailers –  transferring value from poor people to supermarket shareholders?  My starting point would be that, over time, any savings to retailers would be competed away, but I know that serious people have concerns about the degree of competition in the New Zealand supermarket sector.  On which note, it would be interesting to know –  and tempting to OIA –  whether the supermarket chains have lobbied for this ban, including in its very particular form.    Quoting again from the Associate Minister,

Government working alongside industry can be very powerful

No doubt, but there should be no presumption –  perhaps especially from left-wing parties, if they seriously care about consumers and the poor –  that such working together will generally be in the public interest.

I have noted already that some costs are not even identified at all.   At present, if I go to the supermarket I give no thought to what I will bring my purchases home in.  Supermarkets provide plastic bags (as do many other retailers).  If every trip to the supermarket were in future to involve 30 seconds to collect reusable bags before heading out, then across tens of millions of trips to the supermarket each year, the value of that time alone will be non-trivial.

The authors of the consultative document also seem conveniently oblivious to how people actually live.  This is from a post by Eric Crampton this morning.

We have a few reusable bags at home. The ones we have get reused a lot, because we use them on planned trips to the store. But most of our trips aren’t like that. Most of them are grabbing a few things on the way home after getting off the bus. Maybe other people are happy to carry around reusable grocery bags every day on the off chance that they might need to grab milk, bread, eggs and butter on the way home. I’m not. On those trips, we use the disposable plastic bags. Because what else are you going to do? Walk home, get a bag, walk back to the shop? It’s absurd.

Or my own experience as a semi-retired suburban homemaker.   I go for an hour-long walk most days.  About three-quarters of the way round, I pass the local supermarket, and perhaps most days I pop in and get one or two things.  A light supermarket shopping bag, with handles, equips me for the walk back up the hill home again.   Zealots will no doubt argue that I should carry a reusable bag with me all the way round my walk.  By why would I want that inconvenience?  Or this morning, when I went out I planned to pick up just one small thing, that I might have carried home without a bag at all. But passing the supermarket I noticed a generous discount on something I stock up on whenever it is on sale.  I bought five of that item.  With a supermarket shopping bag, with handles, it was not a problem.  Without that option, I am more likely to use the car and drop back down to the supermarket later in the day, extra carbon emissions and all.  All these sorts of forced changes of behaviour should be identified, and efforts made to price them, weighed up against serious estimates of any possible benefits.

The consultative document does, at least, include a table showing estimates of how many times different types of alternative bags have to be used to have less environmental impact (over 14 different measures) than a standard supermarket shopping bag.  At the absurdist end of the spectrum –  and yet these the sorts of options Greens like to talk up in other contexts –  an organic cotton bag would, we told, need to be reused 20000 times: roughly once a day for each of 60 years.  In a sense that difference is one of the marks of how much progress society has made in identifying products as cheap and useful as the supermarket shopping bag.  Organic cotton, after all, was all the cotton there was a few hundred years ago.

Lest you be unable to believe that there is no evaluation framework at all, MfE do offer one up in the document.    It is captured in this subset of their table.

plastics 5

This framework is not designed to assess whether there is a policy problem that can be cost-effectively addressed.  Rather, it assumes there is a major policy problem  (note that triple-weighting on the first criterion, and how broadly and loosely defined it is) and then it set up to demonstrate the superiority of the option the government plans to ram through.  There is no obvious reason (from a public perspective) why the ability to impose a ban without new legislation should be favoured over an option that requires new legislation (in fact, rather the contrary given the pervasive –  deliberately so –  effect on this proposed ban).  And on the other hand, the evaluation framework gives no weight at all to issues around personal freedom and choice.  Thus, some of the other options – tax or mandatory-charge based –  would be likely to generate substantial reductions in plastic bag use, while allowing those for whom use of such bags was particularly convenient or valuable to continue to do so.  It is, for example, the approach adopted in the UK.   The consultative document offers no good economic reason not to take that path here.

Finally, it is perhaps worth noting that some media outlets have reported there being 104 countries to have adopted such a ban.  In fact, the consultative document is quite clear that there are 104 jurisdictions –  anything from local councils to national governments.  Recall that there are 70 odd territorial local authorities in New Zealand alone.  And that local councils –  here and (no doubt) abroad –  do all sorts of daft and damaging things without adequate scrutiny and evaluation (see, for example, our housing markets).   Going by the table in the document, the number of countries that have actually and enforced imposed bans (especially as far-reaching as our government plans) seems able to be counted on the fingers of one hand.   We deserve much better analysis; it is not a case of New Zealand simply copying what every other advanced economy is already doing.

It is a shockingly poor document, perhaps summed up best in this question for submitters

plastics 6

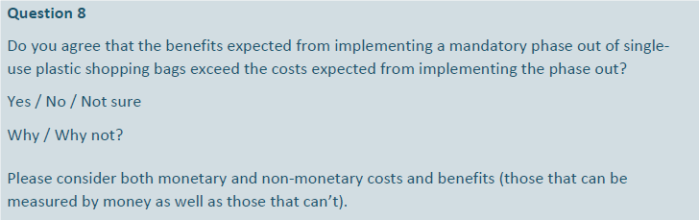
Perhaps it is mostly a fair enough question, but given all the analytical resource and money (from taxpayers) the government and MfE have at their disposal, surely they could have at least made a stab at estimating the costs and benefits themselves, setting down their workings as a basis for submitters to agree or not.

But that perhaps assumes that this is a real consultation.  I suspect the school children can be counted on to write in assuring the Prime Minister and her colleagues that it is a wonderful plan and everyone will feel better for it.  Such a sound way to make policy.

A case for more MPs?

One of my kids is quite sympathetic to ACT.  So when the news emerged yesterday that ACT was adopting NZ First policy, and calling for a reduction in the size of Parliament to 120 MPs, we had a bit of a chat and I offered a few alternative perspectives.

One of those alternative perspectives is captured in this nice chart from a Czech mathematican and blogger.

parliament-per-capita

New Zealand has 120 MPs and a population of 4.9 million.  In other words, 24.5 members of Parliament per million people (a number that is dropping quite steadily given our relatively rapid population increase –  in 1993 when MMP was voted in, 120 MPs was equivalent to about 33 MPs per million people).

Look at that Europe chart, which helpfully includes numbers for some of the very small countries.

Of the large democratic countries (Spain, France, UK,  Italy Germany, Poland), the average number of members of Parliament (upper and lower house) is about 15 (and even that number is skewed up by the part-timers in the House of Lords),  Ukraine, Russia and Turkey –  big countries, if not always terribly democratic –  also have a small number of MPs per capita.

And what of the very small countries?   Iceland, Luxembourg, Andorra, Malta, Montenegro, Cyprus.  Among those countries, the median number of members of Parliament per million people is over 100.

And what of countries very close to New Zealand in size?  There are six EU countries with between four and six million people.  Here are the number of members of Parliament per million people in each of them, as per the chart above

Denmark                            32

Finland                               37

Slovakia                             28

Norway                              33

Ireland                               49

Croatia                               36

I could go on, but I’m sure you get the point.   Big countries have lots fewer members of parliament per capita than very small countries, and of the advanced European countries around our size all have more MPs per capita than we do.   There are outliers and exceptions of course  –  among advanced countries Israel (also with 120 MPs and more people than we have) is one.   But I suspect ACT and NZ First would struggle to find a useful cross-country metric that suggested we had too many MPs.    And unlike most of the larger countries, we don’t have federal system, so there are no state-level MPs.  And there is no second (reviewing) chamber.

It seems perfectly sensible to expect that the number of MPs per capita will be diminishing quite a bit with population.  There are economies of scale to many of the more critical functions we expect from our members of Parliament.  In fact, the same goes for many central government functions (central banks, diplomatic services, supreme court and so on).

You might think that there are too many minister and under-secretaries –  something I do agree with ACT on  –  but even Mr Seymour’s proposal of 20 would give us a ministry about the same size as the Cabinet in the United States or the United Kingdom.   There are certain number of jobs that need doing even if you are a small state.  Just as local councils in towns of 20000 people still have many of the same functions as the Auckland council.

But staffing the executive ministerial roles probably isn’t the most important role of Parliament.   At least as important is the challenge and critical scrutiny that MPs can and should provide on legislation, on the performance of ministers, and on the performance of government agencies  (there are, inevitably –  and even in Mr Seymour’s small government world –  many of them, through which all-too extensive powers are exercised).

In particular there is the work of select committees.   Select committees in New Zealand are poorly resourced, but even members of select committees are typically spread very thinly.  Scrutiny – whether of proposed legislation or of ministerial/agency performance –  doesn’t happen with anything like the regular depth or intensity it should.  And that isn’t because individual MPs are slackers –  most appear to work excruciatingly long hours.

Add in issues around competence and incentives and it reinforces the case that we have barely enough MPs.   Of 120 MPs, inevitably some will be duds –  people who got on the list, or won local selection, for reasons that have nothing to do with their ability to be effective legislators, or those holding the executive to account.  Likeability, or to keep someone else out.  Fundraising or ticking diversity quotas, for example.  Others linger beyond their use-by date.  (None of this makes Parliament necessarily much different from many other workplaces.)

On the government side, senior roles on important select committees are typically filled by people who are (a) well-regarded by their seniors, and (b) on the fast-track into the ministry itself.  Not a recipe for consistent critical scrutiny.   The chair of the Finance and Expenditure Committe used to be such a role –  now made worse in that both the chair and deputy chair this term are already under-secretaries, and even less likely to want to make life awkward for their colleagues.   Things are different on the Opposition side (making life difficult for the government is a big part of your reason for being), but parties typically get into Opposition after losing an election –  at which point, from both the individual and the party, there is pressure for turnover, and so a lot of experience is lost.   We don’t have much of a hinterland of people who either were ministers and are so no longer, and have been content to find a niche as, say, a select committee chair, bringing experience and a not-much-to-lose perspective to bear including in holding their own senior colleagues to account (as seems to happen in, for example, the UK).   We seem to have a Parliament of people for most of whom being a minister is the focus of ambition.   And with 120 MPs, that is realistic ambition for many/most.    I’d argue that what we need is more able people who want to be very good select committee operators, and perhaps even compelling speakers in the House itself.

Perhaps there are other papers, but in a quick look I found a piece from 2007 looking at the cross-country relationship between population and number of MPs.   The authors find a power law –  number of MPs per capita diminishing with population –  holds, and end up classifying countries into five groups, one of which includes New Zealand

The nations with abnormally sub-optimal representations: Israel, New Zealand, the Netherlands and above all, the USA. Nations in the last group are all close to a ratio of 65% of their optimal representation level.

As I noted, when MMP was voted for it involved 33 MPs per million people.  In 1951, after getting rid of the Legislative Council, we had 80 MPs ( 42 MPs per million people).  Even allowing for some economies of scale, it is far from clear that there is a credible case for reducing the number of MPs, even if (and here I sympathise with Mr Seymour) one did favour less regulation, less legislation, and a smaller role for government.

None of which is to defend our MPs from the generally appalling job they have done for decades, presiding over our steady relative economic decline (and the many other failures people could list according to taste).  But demolishing one wing of the house –  chopping out 20 MPs –  isn’t going to fix that problem.

Regional differences and economic underperformance

I noticed Bernard Hickey drawing attention to the chart in this tweet, observing “New Zealand third worst on the list”.

I think that (the Hickey take) is almost totally the wrong way to look at things.

Here is a chart of GDP per capita by regional council area (the only subnational data there is here) for New Zealand in the year to March 2015 (ie basically the same period as the OECD chart).  GVA per worker is a different measure than GDP per capita, but they are related and the difference doesn’t particularly matter for the point I wanted to make.

regional GDP

Average GDP per capita in Taranaki is a great deal higher than the national average.   But only 115000 people lived in Taranaki in 2014/15, about 2.5 per cent of the population.   GDP per capita in Taranaki is so high, relative to the rest of the country, because of the oil/gas production (much of the benefit of which accrues to the providers of capital to develop/maintain those fields, rather than to the citizens/workers of Taranaki).

By contrast, in most of the countries in the OECD chart, the city with the highest GVA per worker (or GDP per capita) is the biggest city.   That is true of Britain, France and Poland (to take countries at the left of the chart) and of (say) Finland, Denmark, and Austria (at the right of the chart).    I’ve shown a chart making a similar point in an earlier post.

gdp pc cross EU city margins

Particularly in the smaller countries, the largest city/region makes up a large share of the total national population, which (mechanically) reduces the difference between the richest/most productive city and the average for the country as a whole.  But even in the relatively larger countries like Britain and France, the biggest city accounts for a much much larger share of the workforce than is the situation in Taranaki.

So the issue here isn’t why there is such a big gap between Taranaki and the country as a whole (or even between Taranaki and the laggards) –  oil and gas and a small population will do that – but why Auckland (far and away our biggest city/region) does so badly, and what the implications of that might be.  (And, of course, why the whole country does so poorly.)

I’ve argued that it is because, given constraints of distance etc (at least as real as ever) the global income-earning opportunities in New Zealand are mostly about natural resources (and getting better at getting more from a fixed resource).  That makes it a very different economy to those of the UK or the Netherlands (although quite similar in that respect to Australia.)   And yet policymakers –  National and Labour, Greens and New Zealand First –  just insist on pulling more and more people into Auckland (primarily) every year, where there aren’t many really high-yielding opportunities.  The natural resources aren’t there, even if they were we aren’t getting any more of them, and the process of keeping on driving up the population (in a modest savings economy) continues to skew the real exchange rate, making it harder for the more outward-oriented regions to succeed.

Meanwhile policymakers –  and National and Labour, Greens and New Zealand First are all about equally guilty –  keep on trying to do patches and quick-fixes, subsidies and similar intervention, trying to steer people to the regions (we saw another example just this week with the post-study work rights policy) without really understanding (or deliberately avoiding the implication of realising) that the problem lies with the insane (not fit for New Zealand purpose) economically damaging immigration policy they insist on pursuing.  Revise that policy along the lines I’ve advocated and (a) the regions would probably make up a larger share of the population, and (b) both the regions and Auckland would probably be materially better off economically.

(None of which means I have any sympathy with the Prime Minister welcoming the latest fall in the exchange rate –  and despite the headlines it is a fairly modest fall (and was about this level three years ago).  It is beyond nonsensical to claim (emphasis added) that

The lower New Zealand dollar is good for exporters and a sign the economy is heading in a more productive direction, says Prime Minister Jacinda Ardern.

when the exchange is falling because markets increasingly think the economy isn’t doing that well, and the prospects for OCR cuts are rising.    The delusion that cyclical falls in the exchange rate are the start of something structural and permanent has afflicted politicians and central bankers for decades –  actually I recall Adrian Orr and I trying to persuade Don Brash to the contrary in 1999/2000.  You need to change structural fundamentals to change (helpfully) the structural level of the real exchange rate.  So far, this government –  like its predecessor –  has consciously chosen to avoid doing so.)

Summers on macro policy

At the end of yesterday’s post, I included a reader’s comment highlighting a recent lecture by prominent US economist (and former Treasury Secretary) Larry Summers in which, among other things, he posed the question of how it was that so much of the advanced world has had pretty underwhelming economic growth rates even with real interest rates so much lower than we had been used to (for several hundred years) and –  at least in the US case –  with such large fiscal deficits.  Linked to this, he raised some of the sorts of concerns I’ve repeatedly raised here about the preparedness of authorities to cope with the next recession –  as he notes, the recipe for dealing with recessions in the US has been 500 basis points of cuts in the Fed funds rate, and no one –  including market prices – thinks that the US (or Japan or the ECB) is going to have that sort of capacity when the next recession comes.

At the time, I hadn’t gotten round to listening to that talk –  to the New York Economic Club in May – or to another talk Summers had done about the same time to an ECB conference.  But I did get round to doing so this morning.   For those who, like me, prefer to read texts of addresses (a lot quicker), there aren’t transcripts unfortunately, but both talks are only about 20 minutes long (there is a long Q&A session in the first).

Both talks are worth listening to.  I don’t find everything in them persuasive at all –  he is, for example, a big fan of increased tax and government spending, and of much-increased government infrastructure spending (even as he recounts the extreme inefficiency of the way much US infrastructure spending is actually done).  But he is a smart speaker, and the talks are not riddled with excessive amounts of jargon.   And, even if our neutral interest rates are still higher than in most other places, we face some of the similar challenges.  In particular, about coping with the next serious recession, whenever it comes.

And Summers reminded his listeners of stylised results that the probability of a recession in any one year (conditional on not already being in a recession or just emerged from it) seems to be about 20 per cent.   Recessions are almost never recognised until far too late –  again he reminded listeners of an Economist magazine exercise in looking at IMF forecasts: not once, in some 180 case of countries experiencing a year of negative GDP growth had the IMF forecast such an outcome 12-18 months in advance.  Closer to home, in writing the other day about the Reserve Bank’s survey of expectations, I noticed that in the August 2008 survey, respondents (including many of the main forecasters) on average still didn’t see any sign of a recession.

Summers takes the view –  hard for any serious person to contest –  that the eventual recovery in the US after 2009 was very slow, unsatisfactorily so.  On OECD estimates, only this year has the output gap closed, and last year the unemployment gap closed.  Many other countries had at least as bad as experience:  our own wasn’t much better.   He argues more should have been done with fiscal policy, but perhaps the key point is that more needed to be done (on top of 500 basis points of interest rate cuts, several rounds of QE, other specific liquidity measures, and a significant fiscal stimulus).   Next time round, there isn’t 500 basis points of conventional capacity.

We had 575 basis points of OCR cuts, a bigger swing in the structural fiscal position than in the US, bank guarantees, special liquidity provisions, and a big fall in the exchange rate.  Despite that, we had years and years of excess capacity (whether on RB, Treasury, or OECD numbers) and core inflation still isn’t back to target.   Next time, there isn’t 500 basis points of conventional capacity.

I’m less convinced that Summers has a solution to the problem.   Structural reforms to lift potential growth would be good, but even if they happen they don’t deal with the natural cyclicality of the economy, take years to produce their full effect –  and don’t seem remotely likely in today’s dysfunctional US political system.

On monetary policy, if I heard him correctly, he toys with the possibility of moving from an inflation target to something like a price level target or a nominal GDP target: both might have some merit, although both would be hard to make credible, especially for policymakers who have erred on the side of caution for the last decade.  Perhaps his closest-to-specific advice was that if the inflation target is supposed to be symmetric (as both the US and NZ ones are), surely 9 years into a recovery, with unemployment at 4 per cent or just below (and pretty subdued productivity growth) if ever inflation should be a bit above 2 per cent it is probably now.    The same could, almost certainly, be said for New Zealand (or, perhaps to a lesser extent, Australia).  Such higher inflation outcomes would help hold up inflation expectations, and help induce a little more resilience (gains at the margin) in coping with the next serious recession.

Perhaps it isn’t his specific domain, but I was a bit surprised that Summers made no mention of actually addressing the fundamental administrative barrier that limits the ability of central banks to lower official short-term interest rates below about 0.75 per cent.  If, as Summers does, you take seriously the view that low neutral rates will be with us for some time –  he seems to see little in prospect (from savings behaviour or investment demand) to change that situation – then it should be untenable to keep in place the adminstrative restriction that allows people to move limitless amouts from interest-bearing accounts (potentially negative interest) at no substantial cost.  One doesn’t have to call for the abolition of cash to believe this constraint can be very substantially alleviated (whether by capping the overall note issue, and auctioning new increments) or putting a conversion fee in place for significant transfers.   If authorities –  politicians and central banks –  aren’t willing to address that issue, and soon, they really need to be thinking again about raising inflation (or price level or NGDP) targets, to allow more leeway in recessions.  These issues have to be addressed now: to do so only in the middle of the next recession will undermine the effectiveness (including in stabilising expectations) of any change.

What staggers me is the apparent indifference of policymakers and politicians to these issues and risks.    The experience of the last decade really should be fresh enough in everyone’s mind –  and the awareness of the limitations of conventional policy at present –  to create a sense of urgency about getting prepared. But there doesn’t seem to be such urgencty….in the euro-area, in the US, in the UK, in Japan, or in New Zealand.  I touched yesterday on the rather glib complacent responses the Reserve Bank senior management gave at the press conference

I see that rather shortsighted attitude was carried over to the Bank’s FEC appearance (from Newsroom’s account).

Orr said that should this scenario [sustained weak growth] eventuate, the bank had a set of “unconventional tools” that it had been developing.

Assistant governor John McDermott spoke in May about five unconventional tools the bank had been working on that could be used during a financial crisis. One of these is quantitative easing, essentially the practice of printing money to buy bonds to stimulate the economy.

The bank would buy Government and commercial bonds as well as foreign government bonds, with the intention of weakening the Kiwi dollar.

Other approaches the bank could take include negative interest rates of as low as -0.75 percent, and guaranteeing bank liquidity by offering term lending facilities for banks.

But this scenario remains unlikely – it would effectively be a crisis occurring on top of an existing crisis.

Orr and McDermott know that even with all the quantitative easing and associated liquidity measures in other countries –  that eventually reached the limits of conventional policy –  the recoveries were very slow and painful almost everywhere.  And if that final sentence is really to be read as them suggesting we can’t have a significant downturn now because somehow we are still in an “existing crisis”, they really aren’t fit to be doing their job.   Nominal interest rates in New Zealand at present might be low at present by historical standards, but there is no credible sense in which the New Zealand economy has been in “crisis” in recent years.

In passing, one aspects of Summers’ talk I found unconvincing was his suggestion that despite the big apparent fall in neutral interest rates, the underlying fall is likely to have been much larger, masked –  he claimed – by the effect of fiscal policy across much of the advanced world.  He refers to both stock and flow measures.  On stocks, government debt is certainly higher than it was in many/most advanced countries, but as this IMF chart highlights total debt in the advanced world as a whole total debt (public plus non-financial private) as a share of GDP is barely changed over 25 years, and is lower than it was going into the last recession.

IMF debt chart

As for flow measures, here is a chart showing OECD estimates of the structural primary fiscal deficit (general government) for the OECD as a whole, median OECD country, and for the United States specifically (where deficits are widening again now).

structural bals aug 18

Actually, the latest observations for all three series are no worse than they were in 2006 or 2007, just prior to the last recession.  The median OECD country has been running a small primary surplus, and the average for the last five years is little different than for the five years prior to the recession.        It is hard to see much compelling basis for the suggestion that fiscal policy is masking an ever deeper decline in the underlying neutral interest rates than what we (appear to) observe.

Anyway, for those interested in such issues, Summers is worth listening to and thinking about.


Central bank complacency

There are plenty of things I could comment on around the Reserve Bank Monetary Policy Statement released this morning:

  • there was the questionable view that GDP growth is about to snap back (this very quarter) to above-potential rates,
  • there was the welcome acknowledgement (departing from the Wheeler view) that changes in net migration tend to have larger (short-term) demand effects than supply effects,
  • there was the Governor’s rather glib claim that they had looked back, reviewed their own past performance, and concluded that nothing should have been done differently.  The Governor claimed they’d been at the lowest end of expectations etc, which while no doubt true about the major banks, certainly isn’t true if he’d checked out (say) the lower quartile responses to the bank’s own expectations survey.  More starkly, the Bank –  unlike anyone else –  is paid to deliver core inflation near 2 per cent, and it has consistently failed for years now to do that.  Some things should have been done differently.  But I guess contrition is too much to hope for from public sector agencies.

But what disconcerted me most was the rather glib complacency that continues to flow from the mouths of senior Bank management about readiness for the next serious economic downturn, whenever it happens.

Brian Fallow asked them how well-placed they were to cope with such a downturn, given that the OCR is now at 1.75 per cent, whereas going into the previous recession it was at 8.25 per cent.  The Governor claimed we were well-placed because we have a floating exchange rate, and suggested it had always been the key shock absorber in New Zealand. There is some truth in that observation, but it isn’t that relevant here: we’ve had a floating exchange rate for decades now, and in each downturn during that period cuts in short-term interest rates (the OCR since 1999) have been a significant part of responding to, and mitigating the severity of, any downturn.  In fact, the exchange rate falls so sharply partly because of the size of the cuts in short-term interest rates.  But in the next downturn it seems likely that the Reserve Bank won’t be able to cut the OCR by the 500 basis points or more that have been typical.  On their own telling, they can only usefully cut it by about 250 basis points.   That might enough in a mild downturn, but the focus of the question was (rightly) on the next serious downturn.

Then the Bank’s chief economist John McDermott chipped in.  He reminded Fallow, and other listeners, of the Bulletin article the Bank had published a couple of months ago looking, in particular, at alternative monetary tools (eg QE) used in other countries.   He went on to add that New Zealand also had “lots of fiscal headroom”.

I wrote about the Bulletin article in a post here.  There was some good and useful material in the article, but as I noted then it was inadequate

they know how poorly the world economy coped with, and recovered from, the last downturn, even deploying all sorts of unconventional policies  (fiscal and monetary) on top of the considerable conventional monetary policy leeway that existed going into that recession.  Even here –  where we never reached the limits of conventional policy –  the output gap remained negative, and the unemployment rate above official estimates of the NAIRU for eight or nine years.   Eight or nine years……..  That is just a huge amount of lost capacity, and of lives that are permanently blighted (prolonged involuntary spells of unemployment do that to people).

I’m at a loss to know how any serious people, who actually care about the consequences –  for people’s lives among other things –  can be so complacent.   After all, as surely even the Bank senior management recognises (a) every OECD country (bar Japan) went into the last recession with more conventional monetary policy capacity than the Reserve Bank has now, and (b) the performance (even cyclical performance) of almost every OECD country in the last decade has been pretty deeply underwhelming, even with the combination of conventional monetary policy, unconventional monetary policy, and considerable fiscal stimulus in many cases.

Here, for example, are the OECD estimates of output and unemployment gaps for the OECD as a whole.

OECD gaps

These are massive gaps, losses that will never be made up (in the sense that people only have one life –  years unemployed aren’t usually made up for by more working years later in life).  There is nice column in today’s Financial Times that reflects –  with some anger – on this failing and the responsibility of central bankers, well-intentioned as they all, no doubt, were.

And yet Orr and McDermott seem unbothered about our situation if we were to be faced with a new serious recession.

Lets take the fiscal headroom strand of their argument.  We certainly do have fairly low levels of government debt –  not yet as they were in 2008, but towards the low end of OECD countries.   Australia had low public debt in 2008 too, and is famed for its aggressive use of fiscal policy in the 2008/09 downturn.  Between 2007 and 2009, the OECD’s estimate of the change in the structural primary fiscal balance (the bit, in principle, under discretionary government control) was equal about 5 percentage points of GDP (from a 1 per cent surplus to about a 4 per cent deficit).

But it isn’t as if Australia just used fiscal policy.  The RBA cash rate was also cut by 425 basis points. Oh, and the exchange rate fell very sharply indeed –  as one would have expected.    Even with all that policy support –  and some considerable Chinese fiscal/credit stimulus thrown in – Australia’s unemployment rate still rose by almost 2 per cent (and in the subsequent decade has never got close to the 2007 levels again).

I looked through the complete set of OECD countries for the period around the 2008/09 recession.  Quite a number of them sought to use fiscal policy in a counter-cylical fashion in the last recession, but none did more (on this metric) than Australia.  In fact, New Zealand –  which didn’t do discretionary fiscal easing to counter the recession, but had had big fiscal loosenings in train anyway (which Treasury thought were quite sustainable), saw our structural primary balance widen almost as much as Australia’s did.

What I take from that experience is that it is very unlikely  – no matter how much headroom New Zealand might appear to have –  that a change in the structural fiscal position larger than Australia implemented in 2008/09 would prove politically tenable.  Otherwise, surely, somewhere in the OECD –  eg among those countries without a floating exchange rate, without Chinese stimulus –  we’d have seen it happen.   And even in Australia the peak fiscal stimulus didn’t last long, and debates about trying to get back to surplus consumed a fair degree of political oxygen over the following few years.

And, recall, we had that sort of fiscal stimulus in play ourselves over the 2008/09 period and even then, with big OCR cuts –  more than any other country –  and a falling exchange rate, we still ended up with a serious recession, and a very slow re-absorption of excess capacity.  So the Reserve Bank’s complacency now is pretty alarming. We pay them to worry about contingencies and tail risks, not to blithely suggest everything is fine.

The other aspect of all this that the Reserve Bank has never openly engaged with is that, all else equal, the next downturn will be more troublesome for policymakers precisely because people increasingly recognise that conventional monetary policy is reaching its limits, and unconventional policy as others have applied it just isn’t that powerful.  Going into the last recession, most people worked on the assumption that central banks would cut rates deeply and then the economy would rebound, and that there was no reason to think of medium-term inflation deviating far from target.  Thus, while short-term interest rates fell sharply, implied longer-term nominal interest rates (eg implied 5 year rates five years forward).  But when the next serious recession happens, there will inevitably be a great deal of questioning of just how much monetary policy can do.  Inflation expectations –  whether embedded in bond yields, or just in how firms and households behave –  will be likely to fall away quite quickly.  Central banks will need to cut nominal interest rates more aggressively just to avoid real interest rates rising.   And most central banks don’t have much nominal interest rate space left.     Rational fears of looming deflation are likely to be even more to the fore –  and better-grounded –  than they were in the years after 2008/09.   It seems reckless not to be addressing these issues now.

And for all that the Reserve Bank continues to repeat the line that current inflation expectations are just fine, the bond markets still don’t agree.  If anything, inflation breakevens (a proxy for inflation expectations in reasonably settled times) have fallen back a bit in recent weeks.

IIBs aug 18

The current average observation of the two series is about 1.4 per cent.  It has now been 18 months since there was any sign of consistent progress in getting back to 2 per cent.  But again, you never see the Reserve Bank engage with this indicator either.  The narrative, after all, always seems to be that there is really nothing to worry about.

And it is ordinary working people, not senior central bankers, who will bear the brunt if things do go badly in the next recession, and central bank failure to act now contributes to those bad outcomes.    Since politicians also tend to pay the price, one might hope the Minister of Finance would be taking the lead in requiring the Reserve Bank and Treasury to fully, and openly, address these issues.  Ours, unfortunately, also seems too invested in a “nothing to worry about” narrative.

As I was typing this post, a reader sent me an email prompted by watching the Bank’s press conference

Larry Summers [former US Treasury Secretary, former President of Harvard etc] earlier this year gave a talk on ‘secular stagnation’ – how it is remarkable that so much monetary and fiscal support is now needed to keep economies afloat.  What’s going on in NZ such that, at time when the terms of trade are so good, monetary policy you say is very stimulatory 1.75 ocr compared with 3.5 for neutral?) , and fiscal policy is stimulatory, and to become more stimulatory, yet the outlook for the economy and inflation, by any historical standard, is very subdued.  What do you think the NZ economy would look like in a 2-3 year’s time if monetary and fiscal policy now were both returned to ‘neutral’?  What’s going on?

It is a good question (although not sure I’d phrase the final main sentence that way).  After all, for all that the Bank talks in the MPS of other countries starting to tighten monetary policy, outside the US –  itself recipient of a big late-cycle fiscal stimulus – the changes are pretty patchy and small.  And yet global inflation is pretty subdued, and (as the chart above shows) after all these years, output and unemployment gaps are only closing just now.  I suspect part of the answer is that neutral nominal interest rates are lower than most people think, but that only pushes the question back one more step to ask why that would be.  In part –  but only a part –  it will have reflected the failure to use monetary policy more aggressively soon enough.   That’s clearly true here as well (and with less excuse here as those conventional limits –  to cutting the OCR –  simply weren’t reached here.

A sharp fall in expected GDP growth

The Reserve Bank’s expectations survey results were released this afternoon.  The Bank itself will have had the results last week, and will have been able to take them into account in finalising tomorrow’s Monetary Policy Statement.

Mostly, only the inflation expectations numbers get reported.  They didn’t change materially, whether at a 1, 2, 5 or 10 year ahead horizon.   Perhaps that isn’t too surprising, but it is encouraging given the lift in the sectoral core inflation measure evident in the most recent CPI.

There was also hardly any change in wage inflation expectations –  a slight lift in one year ahead expectations and no change at all in two year ahead expectations.  On these measures, real wage inflation is expected to no higher than 1 per cent per annum –  not high in absolute terms, but rather faster than recent productivity growth (itself next to non-existent).   The Bank themselves produced a graph of the results suggesting real wage inflation is actually expected to slow from here.

wage expecs

I was more interested in two other series.  In the first, the Bank asks respondents to indicate how tight they think monetary conditions are now, and how tight they expect them to be a year ahead.  Ever since 2011, the mean respondent has judged conditions to be easier than neutral –  despite which inflation has consistently undershot the target –  but what is somewhat interesting is how respondents expect things to change.

In this survey, there has been a bit of an increase in the proportion of respondents who expect monetary conditions to tighten over the coming year.

mon cond year ahead 18

Those expectations still aren’t as strong as they were at the peak of the (misplaced) tightening fervour in 2014, but they aren’t far away now.    Quite why, or what has changed, is a bit of a mystery (noting the unchanged inflation expectations).  “Monetary conditions” isn’t further defined in the survey, so includes (implicitly) not just official interest rates, but the exchange rate, credit conditions or whatever the respondent has in mind.  Perhaps respondents are expecting credit conditions to tighten (further)?

Whatever the explanation, it does seem a little surprising set against the backdrop of respondents’ expectations for GDP growth.  The survey asks about expectations for GDP growth one year ahead and two years ahead.  The one year ahead numbers can be thrown around by all sorts of short-term noise, but the two year expectations should be a better reflection of the underlying sense of what is going on (as with the two year ahead inflation expectations).  Three months ago respondents expected real GDP growth two years ahead of 2.7 per cent.  This time, the two year ahead expectation is 2.2 per cent.

Is that difference material?  Well, I had a look back over the history of the series.  If we go all the way back to 1996, there have only been three quarters when two year ahead growth expectations have been revised down by more than the fall this quarter.

When were they?

The first was in the September 1997 quarter, just prior to the 1997/98 recession (a fall of 0.8 percentage points).

The second set were the December 2008 (a fall of 0.8 percentage points) and March 2009 quarters (a fall of 1.6 percentage points), in the midst of the last recession, and the financial crises abroad.

(The quarters with large increases in expectations also come, as one might expect, just after these recessions.)

The fall in two-year ahead expectations this time is still a bit smaller than the falls in 1997 and 2008/09, but it doesn’t look like a result that should be lightly dismissed.  In one sense, people can say “oh, just consistent with the fall in business confidence measures”, but this survey isn’t just a sentiment indicator, but asks about specific macroeconomic aggregates.   And the fall isn’t just concentrated in one year ahead expectations (which actually fell less than the two year ahead expectation), suggesting that whatever is influencing respondents isn’t something they expect to dissipate quickly.

I’d be a bit rattled if I was the Reserve Bank.  It just adds to the sense that growth has probably slowed further already (beyond what is reported –  last official data was the March quarter and it is now August) and may have further to fall.  And respondents –  who include most of the economic forecasters –  don’t see much reason to think a significant rebound is likely any time soon.

Such expectations aren’t accurate predictions of what will happen two years hence –  partly because if things get bad, policy (including monetary policy) responds –  but large falls in the past have coincided with the two periods of worst economic outcomes in the last couple of decades.

(And readers of the Minister of Finance’s speech today won’t have found anything in it to instill much confidence in the sort of rebalancing  –  or stronger productivity growth in the medium term –  the Minister claims to be pursuing.  Strangely, the Minister continues to repeat the election campaign lines about how well the economy has done in recent years –  the economy that saw weakening per capita GDP growth, little or no productivity growth, weak business investment and a declining relative size of the tradables sector.)