A strikingly poor speech from the Governor

On Wednesday afternoon the Reserve Bank Monetary Policy Committee released their latest OCR decision.  It was, as predicted, no change in the OCR.  I don’t think it was the right decision on the substance (some background to that here) but at least it was in line with the Governor’s public comments following the previous surprise decision.

I didn’t have that much to say about the two pages (statement plus “minutes”) they released.  So just a few quick points:

  • in the statement the Bank continues to overstate the contribution of the “trade war” to the slowdown in global trade and global growth.  It is a convenient “newspaper headlines” story, but the way they use it suggests they haven’t thought much more deeply about the issues,
  • they talk up the prospects of economic recovery, based on the reduction in interest rates, but never seem to recognise that interest rates had been cut for a reason.  Unless the OCR is cut by more than any fall-away in economic fundamentals, you wouldn’t expect to see a rebound.  As I pointed out last week, actual cuts in variable retail rates lag well behind the fall in market-determined long-term rates,
  • there is something inappropriate about the Bank talking up the idea of fiscal stimulus three times in two pages (not that fiscal stimulus might be out of place in some circumstances, but it is entirely a matter for the elected government).  On the other hand, I guess we should be grateful that the Governor has stepped away from his August comment that “of course the government has to be spending more”.
  • it is interesting that, at least as written, the MPC appears not to have any bias on the direction of the next move in the OCR.   They are very widely expected to cut in November and cut again next year but there is nothing in this statement to lead one to think the MPC shares that view –  if anything, in the minutes we read that “some members”, with a cost-plus model of inflation apparently, believe there is “potential for rising labour and import costs to pass through to inflation more substantially over the medium-term”.   Their predecessors were hawking similar lines in 2015/16.

It is 18 months today since Adrian Orr took office at Governor of the Reserve Bank.  I’ve not infrequently bemoaned the fact that in that time Orr has not given a single substantive on-the-record speech on monetary policy or banking regulation/financial stability (the Bank’s two main areas of responsibility).  Yesterday Orr gave short speech to a corporate audience in Auckland, which dealt with both monetary policy and (in more abbreviated form) banking regulation.  I guess we should be thankful for small mercies.

Sadly, the contents of the speech suggest we have a Governor who simply makes stuff up whenever it suits him.  It is extraordinary in such a powerful public figure, one supposedly operating as an independent and judicious technical expert.  Much of it comes across as almost delusional –  perhaps welcome to his mates in the Beehive, but even they must sometimes wonder whether independent public institutions aren’t meant to be more than cheerleaders.

To take just a few examples of what I have in mind, start here

The good news for New Zealand, unlike many other OECD economies, is that our government’s books are in good shape and there is already a strong fiscal impulse underway from public spending and investment. 

There is no disputing the first half of the sentence.  It is to the credit of successive governments of both parties that government debt has been kept pretty low and stable over recent decades.  But what about that second claim, about the “strong fiscal impulse”?  Well, it simply isn’t supported by the facts at all.    This is from my post on last month’s Monetary Policy Statement when the Governor tried to run the same sort of line.

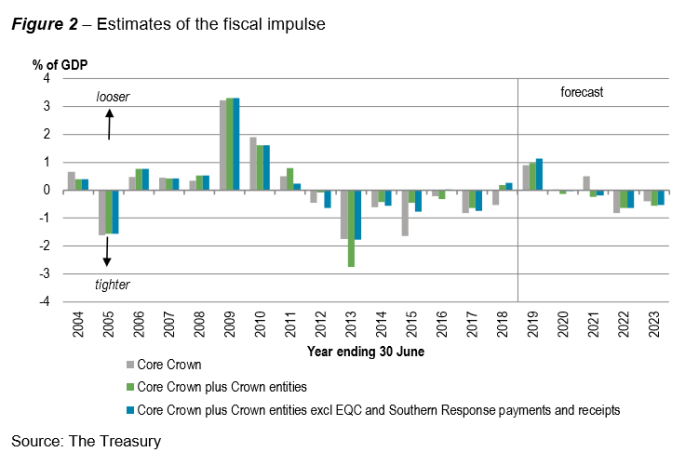
In fact, it prompted the perfectly reasonable question from Bernard Hickey about whether fiscal policy was actually very stimulatory at all.   The standard reference here is The Treasury’s fiscal impulse measure.  This is the chart from the Budget documents

fisc impulse.png

It isn’t a perfect measure by any means, and in particular one can argue about some of the historical numbers. In my experience, it is a pretty useful encapsulation of the fiscal impulse (boost to demand) for the forecast period. In fact, the measure was originally developed for the Reserve Bank –  which wanted to know how best to translate published forecast plans into estimated effects on domestic demand/activity.

And what do we see.  There was a moderately significant fiscal impulse in the year to June 2019.  That year ended six weeks ago.  For current and next June years, the net fiscal impulse is about zero, and beyond that –  which doesn’t mean much at this stage –  the impulse is moderately negative.    All using the government’s own budget numbers.  And consistent with this, operating revenue in 2023 is projected to be higher as a share of GDP than it is now, and operating expenses are projected to be lower (share of GDP) than they are now.    The Budget is projected to be in (fairly modest) surplus throughout.

And yet challenged on this, the Governor seemed to be just making things up when he claimed that we had a “very pro-active fiscal authority” and that “the foot is on the fiscal accelerator”.    It just isn’t.  Orr must know that (after all, he had Treasury’s Deputy Secretary for macro sitting as an observer in this MPS round).  One even felt a little sorry for the Bank’s chief economist spluttering to try to square the circle, but basically acknowledging that Hickey’s story was right, not the Governor’s.   Perhaps, you might wonder, the Bank thinks the fiscal impulse measure is materially misleading and has its own alternative analysis of the government’s announced fiscal plans. But that can’t be so either: there is no discussion of the issue in the Monetary Policy Statement.

(Incidentally, on Morning Report this morning Grant Robertson tried the same sort of line, only for the presenter to point out to him the fiscal impulse measure, reducing the Minister to spluttering “but we are spending more than the last lot”.  That is true, but the material overall fiscal boost was last year –  and growth and activity were insipid even then, inflation still undershooting the target.)

Was he being deliberately dishonest or simply making stuff up as he went protraying things as he’d like them to be?  You can be the judge, but neither alternative puts our central bank Governor in a good light.

Given that he has since had another 7 weeks to get his lines straight and yet repeats the same line, it looks even worse for him now.  As I said last month, if the Bank has an alternative take on the demand implications of fiscal policy it surely behooves them to lay it out for scrutiny, not just make idle claims inconsistent with their longstanding standard reference source the Treasury estimates).

Just as preposterous was this claim from the Governor

The low level of interest rates globally over recent years primarily reflects low and stable inflation rates – a deliberate and desired outcome of monetary policy.

Here the Governor was repeating much the same nonsense it is reported that he ran to Parliament last month

Over the weekend, I came across an account of the Governor’s appearance on Thursday before Parliament’s Finance and Expenditure Committee to talk about the Monetary Policy Statement and the interest rate decision. …. The Governor was reported as suggesting although neutral interest rates had dropped to a very low level, that MPs should be not too concerned as we are now simply back to the levels seen prior to the decades of high inflation in the 1970s and 1980s.

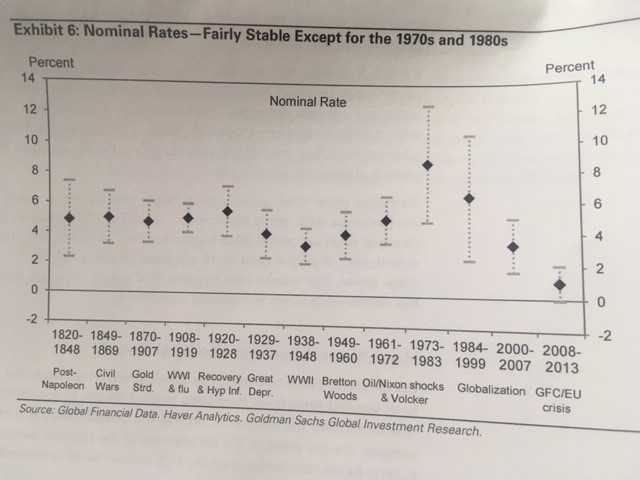
I’m not going to repeat the entire post I devoted to illustrating just how unusual global (and New Zealand) interest rates now are, both in nominal terms and (even more so in the long sweep of history) on real terms.  In centuries past there was little or no rational expectation of sustained inflation, while these days everyone agrees that medium to long-term inflation expectations are somewhere between 1 and 2 per cent.  The Governor may also have forgotten, in a New Zealand context, that the inflation target here is now materially higher than it was, say, 25 years ago.   Interest rates are, of course, far lower.  Here is just one chart from the earlier post, showing how unusual global interest rates were even five years ago (things are still more anomalous now, especially here).

As a final chart for now, here is another one from the old Goldman Sachs research note

GS short rates

In this chart, the authors aggregated data on 20 countries.  Through all the ups and downs of the 19th century and the first half of the 20th century –  when expected inflation mostly wasn’t a thing –  nominal interest rates across this wide range of countries averaged well above what we experience in almost every advanced country now.

Why does the Governor say this stuff?  Does he have no advisers left who are willing to tell him that what he says just isn’t so?

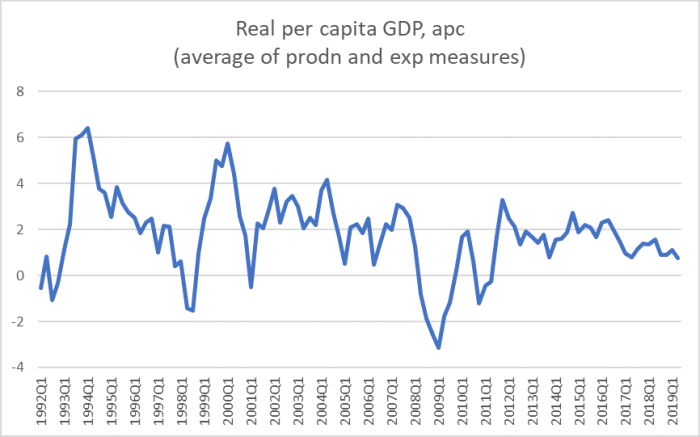
There are claims that the domestic economy still has “ongoing momentum” and that there is “strong demand for goods and services”.  These claims appear to be based the Governor’s interpretation of comments from the small group of firms the Bank went and visited recently.  Never mind the economywide measures, whether the range of business confidence and activity measures, or…..well, the national accounts.

pc GDP growth.png

He goes on repeatedly about how interest rates make it a great time to invest, as if he’d not given a thought to possible reasons why interest rates might be low (NB, it isn’t just because inflation came down again, see above).  He claims we have a “great environment to invest”, talks of “low hurdle rates for investing”, but seems not to recognise that in a climate of uncertainty, whether around policy (here or abroad) or the economic outlook, the option of simply waiting has considerable value, or thus that there is little reason to suppose that hurdle rates for investing have dropped much, if at all, in more recent times.

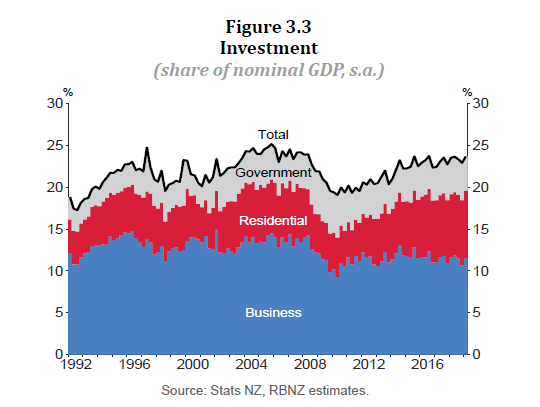
As a bureaucrat Orr is apparently convinced it is a great opportunity to invest and that profitable investment opportunities abound.  Experience suggests that people with a bottom line to meet disagree with him.  Here is the Bank’s own chart from the most recent MPS showing business investment as a share of GDP, with a few observations from me.

bus investment RB.png

As I’ve noted here repeatedly, business investment never recovered strongly from the last recession, and if anything (as share of GDP) has been falling back again in the last few years, even as population growth remained strong.

But despite the feeble business investment performance, the Bank expects business investment to recover from here.  There is no hint as to why they believe that is likely…. If there is any basis for their beliefs it seems to be little more than the repeated claim by the Governor and the Minister that it is “a great time to invest” in New Zealand.  But firms didn’t think so over the last five years –  even with unexpected population shocks –  and surely the reason the Bank is cutting the OCR has quite a bit to do with deteriorating conditions and investment prospects here and abroad?

But what do firms know?

Orr seems to more or less acknowledge the uncertainty issue, in these strange sentences, tinged with corporatist sentiments

However, there remains a loud call from all quarters of the country for leaders to better signal investment intent, and ensure we have the policy and goodwill to facilitate access to capital and resources to execute.

This call for investment-intent is to all collectively-owned (e.g., Iwi), Crown-owned (i.e., central and local government), and co-operatively owned (e.g., traditional primary sector) sectors. It is not just to traditional businesses, or any one party.

Easily said, harder to do without a clear desire to work together over an agreed horizon.

Or he could just have mentioned the major policy uncertainties.    Whatever your view on the merits of any of these issues (and I’m steering clear of expressing such views) mightn’t you think that uncertainty around the ETS, water quality policy, highly productive lands policy, the future of the RMA itself, whether any more significant roads will be built by a government apparently averse to them, bank capital regimes, the future of extractive industries might all be among the sorts of factors that might leave businesses and potential investors just a little wary, and pricing that uncertainty into their decisions around investment?

It all comes to a climax in this extraordinary claim in the Governor’s final paragraph (emphasis added).

In summary, we are not alone in the low interest rate environment, this is a global phenomenon. However, what we do have is more policy and business opportunities than most OECD economies and this is something that we need to take advantage of.

If by that he means that New Zealand productivity and per capita income rank far behind most of the OECD countries we used to like to compare ourselves to and that, at least in principle, those gaps could be closed, then I’m right with him.  But absolutely nothing about how policy has been run by successive governments for at least 25 years now has (so it appears from the evidence of hindsight) been consistent with closing those gaps: the productivity gaps in particular have just kept on widening and (though you would never know it from the Governor’s speech) we’ve had little or no productivity growth at all for the last five or more years.  Nothing about current policy suggests that record will improve in the next five years, and if anything one could mount a plausible argument that the measures adopted by the current government are heightening the risk of even worse (relative performance outcomes) in the next five.   Not only is this stuff well outside the Governor’s area of responsibility –  which is about macro and financial stabilisation –  but he either just doesn’t know what he is talking up or knowing better he just mouths such platitudes anyway.

Finally, there are several paragraphs in the speech about the Governor’s proposals to hugely increase the amount of capital locally-incorporated banks will need to have to back current balance sheets.    Notionally, there is process of consultation and deliberation going on at present. But when you read from the sole decisionmaker words like these,

Our proposals would see significant increases in shareholder capital in banks. With banks having more of their own ‘skin in the game’, the owners will sharpen their long-term customer focus, and it will reduce the chance of a bank failure and the cost on society as a whole should a bank fail. These outcomes are highly desirable for the long-term economic health of New Zealand, and should promote deeper and more liquid local equity and debt markets.

We finalise our decisions in early-December this year. Whatever our final decisions, we will be insisting on transition to higher capital at a sensible pace.

with all those “will”s, you get a pretty strong sense of pre-judgement.  That is, of course, what you’d expect when those proposals were based on very weak analysis –  numbers plucked out of the air at the last minute –  and when the Governor is prosecutor, judge, and jury in his own case, and where he knows that there are no effective appeal rights against his verdict as unelected unaccountable decisionmaker.

It really isn’t good enough.  Citizens should expect better.  The Bank’s Board is paid to hold the Governor to account, but they are almost worse than useless (they provide shadow without substance, suggesting there is scrutiny and accountability when there isn’t).  If the Minister of Finance were doing his job, or Parliament’s Finance and Expenditure Committee was doing its job, some pretty hard questions would be being asked about just what is going wrong at the Bank, and how such shallow –  and frankly embarrassing –  material is emerging from the mouth of such a powerful public figure.

Instead, no doubt, things will continue to drift, and the slow decline of New Zealand’s economic institutions –  hand in hand with the continuing decline in New Zealand’s relative economic performance – will continue.

But, you businesses out there really should be investing. This Governor tells you so.


Some IMF modelling on NZ

Earlier in the week I wrote about the IMF’s less-than-impressive Article IV report on New Zealand’s economy and economic policy.   As part of the bundle of documents released last Saturday there was the Selected Issues paper – a collection of some supporting research/analysis undertaken by Fund staff to help underpin the Article IV report and Fund surveillance of New Zealand more generally.

On this occasion, there are three such papers.  The one that caught my eye was the first: a modelling exercise under the title

TRADE, NET MIGRATION AND AGRICULTURE: INTERACTIONS BETWEEN EXTERNAL RISKS AND THE NEW ZEALAND ECONOMY

In this paper staff took a Fund model carefully calibrated to capture key features of the New Zealand economy and used it in conjunction with their global model to look at several possible shocks New Zealand might face over the coming years.    There is a piece on possible agricultural shocks (pp19-21) which may interest some readers, but my focus was mostly on the other shocks they studied:

  • a significant growth slowdown in the People’s Republic of China,
  • a significant growth slowdown in Australia, and
  • and a significant (exogenous to New Zealand) change in net migration from (a) the PRC, and (b) separately, from Australia.

They illustrate the estimated transitional effects and report the model estimates for the long-term steady state effects.

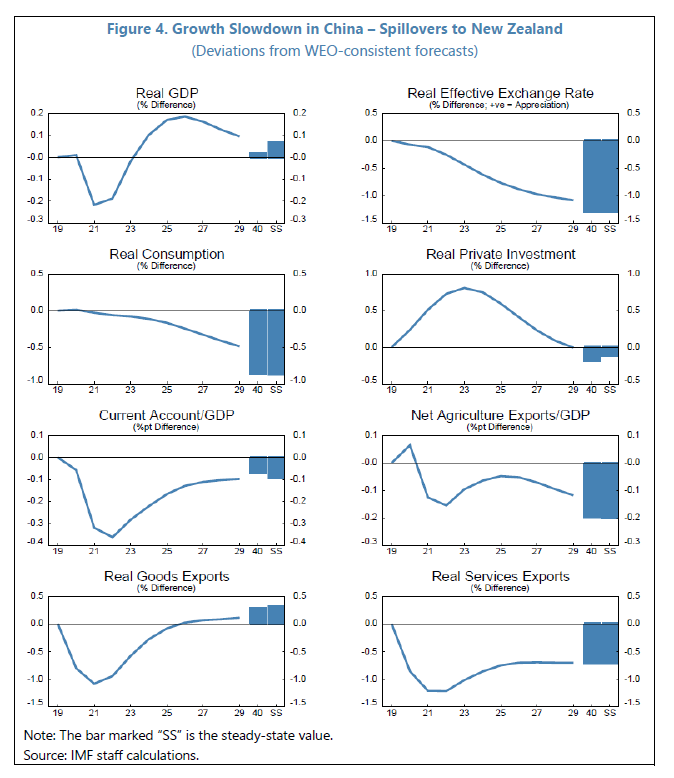
The PRC growth shock involves (mainly) materially slower productivity in China, such that 10 years hence PRC GDP is 11.9 per cent lower than the (WEO forecast) baseline.  You’ll have heard New Zealand politicians and other lackeys parrot lines about how New Zealand depends heavily on the PRC for its prosperity etc.  The IMF modellers are having none of it.  Here are the New Zealand economy responses (quarters along the horizontal axis).

sel issues 1.png

On this model, a 12 per cent lower level of GDP in China –  largest trading partner, first or second largest economy in the world –  leaves New Zealand…….every so slightly better off in the long run (but treat that as basically zero).  Oh well, never mind…..I don’t suppose it will stop the lackeys doing their thing, but it is a helpful reminder that, to a first approximation, countries make their own prosperity.

The scenario of an adverse growth shock in Australia is of similar magnitude (Australia’s GDP is 9.3 per cent lower than otherwise in the long-term.  I won’t clutter up the post with the same set of charts for the Australia shock, but suffice to say that the bottom-line results aren’t that different.  This time, a 9.3 per cent sustained fall in GDP in the economy that is our second largest trading partner and largest (stock) source of foreign investment is estimated to reduce New Zealand long-run GDP, but by only 0.03 per cent.  I’d treat that as zero as well.  In both cases, a lower real exchange rate is part of the way the New Zealand economy adjusts, so consumption here is a touch lower (it is relatively more expensive) but overall real incomes generated in New Zealand (GDP) are all but unchanged.

That was interesting, but not really that surprising (in truth, even I might have expected a slightly larger adverse effect).   It was the migration shocks, and the Fund’s modelling of those, which should really garner more interest and scrutiny.  Note that these results have already had bureaucratic scrutiny: the paper notes that

The chapter benefited from valuable comments by the Treasury of New Zealand and participants at a joint Treasury and Reserve Bank of New Zealand seminar.

Both institutions have some smart and critical people.

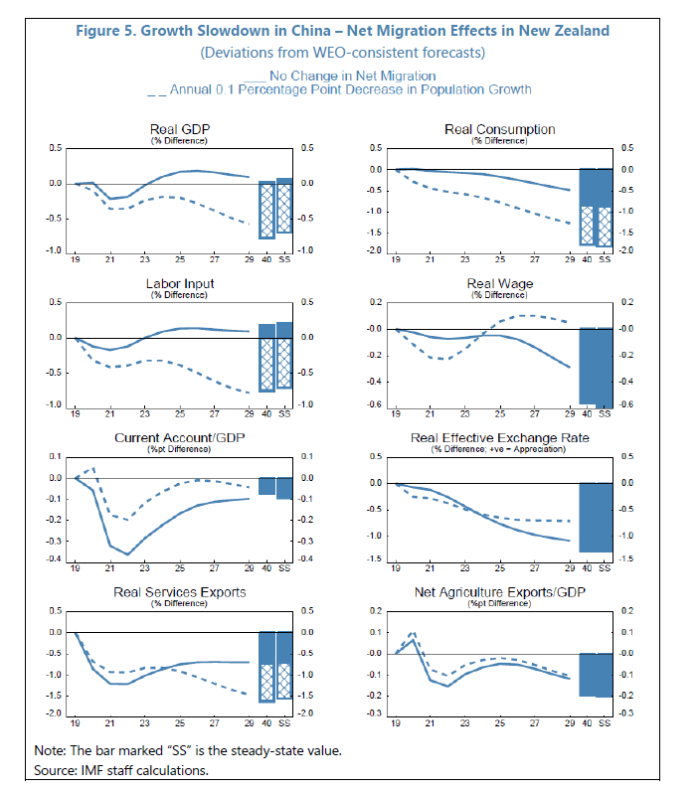
Here is the shock re PRC immigration

Additional Net Migration Effect in New Zealand. There are permanently fewer migrants to New Zealand from China. There is a 0.1 percent reduction in labor force growth for 10 years in New Zealand, so that the New Zealand population is permanently 1.0 percent lower.

This shock is added to the PRC growth slowdown shock illustrated earlier.  As the Fund’s model is calibrated, these are the results.  The additional effect of the migration shock is the difference between the two lines in each panel.

sel issues 2

The Fund writes these results up as “a bad thing”

The fall in net migration would exacerbate the negative spillovers to New Zealand
from China. Real GDP would now be 0.7 percent lower than baseline in the long term.

Which is true, of course, on their model.  But, strangely, not once in the entire paper do they mention per capita GDP.  The population in the long-run is 1 per cent lower, but GDP is only 0.7 per cent lower, implying that GDP per capita is 0.3 per cent higher in this “Chinese migration shock” scenario than in the baseline scenario.  That sounds like a good thing, for New Zealanders, not a bad thing, at least in the longer-term.  (Since labour input and GDP both fall by the same amount, it doesn’t look as if this model can deal with endogeous changes in productivity).  For what it is worth, real wages in New Zealand are also higher in this scenario.)

What about the Australian net migration shock?

Additional Net Migration Effect in New Zealand. There are permanently more migrants to New Zealand from Australia. There is a 0.26 percent increase in labor force growth for 10 years in New Zealand, so that the New Zealand population is permanently 2.6 percent higher.

Again, this shock is on top of the sustained slowdown in Australian growth modelled earlier (and thus is probably best thought of as a reduction in the net outflow of New Zealanders to Australia, the income gap having changed a bit in our favour).   Here is the chart of those results.

sel issues 3.png

In sum, the population is 2.6 per cent higher in the long-run and GDP is 2 per cent higher.   The Fund again spins this as a positive story (it appears under the heading “How Net Migration Could Improve Outcomes for New Zealand”) but again completely overlook the per capita story.  In this scenario, real GDP per capita is 0.6 per cent lower than in the baseline.  New Zealanders are poorer (and in the long-run real wages in New Zealand are lower).  It isn’t even as if there is much of a short-term vs long-term story (the GDP effects just build pretty steadily over the 10 year horizon).

These effects become large if you apply them to the scale of the non-citizen migration we’ve had in New Zealand in recent decades.  Cumulatively, they would not be out of line with the observed slippage in New Zealand productivity relative to other advanced countries over that period.

So the headline out of this particular paper should really be “additional migration makes New Zealanders poorer in the long-run, at least according to IMF modelling”, not stuff about how helpful immigration is.  A focus on GDP might make sense if you are building an army (raw numbers matter) or to silly comparisons politicians make.  Other people know that per capita GDP is much the more important variable, relevant to material living standards etc.  On its better days I’m sure the IMF knows that too.

In a way, even in their report on New Zealand the IMF shows glimpses of recognising that high rates of immigration might not be so good for New Zealand (whatever the possible benefits in some other places).  Both in the main Article IV document and in the Selected Issues paper “a remote location” comes first in the list of factors the Fund identifies as constraining New Zealand productivity.  Combine that glimmer of recognition (and I could also recommend to them this piece) with their own published model results suggesting that, at the margin, immigration makes New Zealanders poorer –  recall that this model is calibrated by the Fund to capture what they see as key features of the New Zealand economy) –  and it might have pointed disinterested observers towards suggesting to New Zealand governments that they consider rethinking their enthusiasm for such high (globally unusual) rates of immigration to a relatively unpropitious location.   Instead of which, the Fund (like the OECD) tends to act as cheerleaders for New Zealand immigration policy.

The IMF, of course, is not a disinterested observer.   It knows little distinctive about New Zealand – and New Zealand’s productivity performance has long been an awkwardness, even a bit of an embarrassment, for the international economic agencies.  And it is a global champion of the idea that immigration is good and more immigration is better.  If you think that an unfair characterisation, check out this post (and this more NZ focused) where I unpicked parts of an official IMF paper which purported to show that

If this model was truly well-specified and catching something structural it seems to be saying that if 20 per cent of France’s population moved to Britain and 20 per cent of Britain’s population moved to France (which would give both countries migrant population shares similar to Australia’s), real GDP per capita in both countries would rise by around 40 per cent in the long term.  Denmark and Finland could close most of the GDP per capita gap to oil-rich Norway simply by making the same sort of swap.    It simply doesn’t ring true –  and these for hypothetical migrations involving populations that are more educated, and more attuned to market economies and their institutions, than the typical migrant to advanced countries.

What do I actually make of the latest IMF paper?  Not that much to be honest.  I’m sure the authors could probably play around with their model – it is calibrated rather than estimated –  to produce results more suitable to the causes of their masters in Washington.  And since productivity isn’t affected, one way or another, by immigration in this model, I’m certainly not attempting to suggest that these results are somehow reflective of the sorts of channels and models I’ve been championing as central to the New Zealand story.

But when even the champions of high immigration to New Zealand acknowledge that there is not much (any?) New Zealand specific research showing that high rates of immigration to New Zealand, in New Zealand’s specific circumstances (eg remoteness, resource endowments, institutions etc) has been beneficial to New Zealanders over recent decades, it should be a little uncomfortable for the officials and politicians who champion the status quo that one of the leading internation economic agencies, pretty sympathetic to their approach, nevertheless (and without really trying) manage to produce research once again casting doubt on whether on this central tool of economic policy –  probably the biggest structural intervention our governments have done over the last 25 years –  is really working for New Zealanders.

Perhaps someone might ask the Prime Minister or the Leader of the Opposition why they act as if they are so convinced that on this count the IMF is wrong.  (Oh, and they might stop parroting the “our prosperity depends on China” line too.  IMF modelling confirms (common sense) that it simply doesn’t.)


Economists and “populism”

My son is doing the Scholarship history exam this year and the topic is something like “populism in history”.  It got me interested and I’ve been reading various books and talking the issue over with my son trying to get straight in my own mind just what “populism” actually is.

It seems like one of those elusive terms where each user means something subtly different, usually –  at least when it is quasi-academic usages –  things/beliefs/actions the author themselves disagrees with, often almost viscerally.  I’m still left unclear that it means anything much different than “things/views which are popular with a significant share of the population, perhaps even a majority, but where those views cut across or defy those held by the contemporary elites of the society in question”.   Since there is no particular reason to suppose that contemporary “elite” opinion is any better or closer to being right, to the truth,  than anyone else –  especially where competing values are at stake – any use of the term derisively seems to mostly tell you more about the user than about the merits (or otherwise) of the particular cause/movement at that moment bearing the label populist.     Is there any real difference between, say, Brexit and, say, the climate strikers, but one often bears the label “populist” and the other typically doesn’t –  even though the latter often seem considerable more fevered, even messianic (“the end of the world is nigh”) than the former?

What prompted all that was the latest survey from the IGM panel of European economists which turned up in my in-box the other day.   I find these surveys interesting, but the reason depends a bit on the question.  Sometimes the answers genuinely tell you something about the balance of the literature and expert opinion on some relatively technical aspects of economics.  At other times, the answers tell you more about the political preferences and inclinations of the (European) elite economics profession than anything else.   The latest survey was about populism, undefined of course.

Here was the first question.

IGM 1

As a group they seem pretty confident of that answer.  I’m a bit sceptical that one can be quite that confident (hardly anyone was even uncertain), but that question wasn’t the one I was mainly interested in.

Here is the second question.

IGM 2.png

Taking the right-hand panel (where answers are weighted by the relevant experts’ confidence in their answer), 62 per cent of this expert group believe that more government spending (or more tax and spending in combination) would be likely to “limit the rise of populism in Europe”.  Only 5 per cent of respondents disagree.

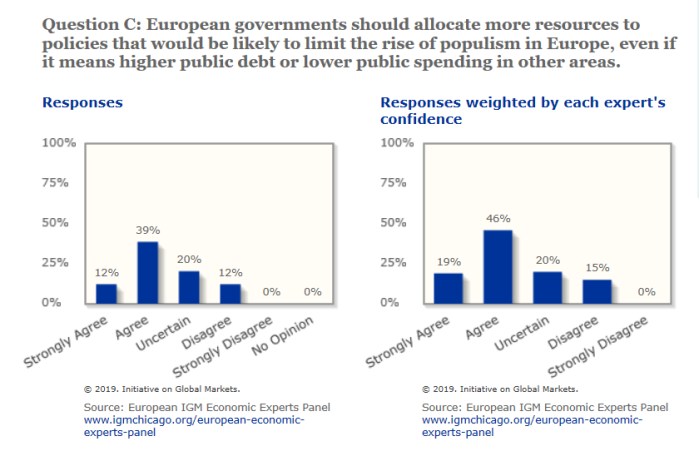
And here is the third question

IGM 3

A similar proportion believe such fiscal measures should actually be taken.   This time, a larger proportion (15 per cent) disagree, but (a) no one disagrees strongly, and (b) the net balance favouring more such measures is still huge: 65 per cent in favour, 15 per cent against.

I found these results pretty extraordinary.   They are frustrating in a way because one can’t quiz the respondents on why they think government spending/tax can make such a difference, but perhaps they reflect that old line that the solution you propose is often influenced by the tool you happen to have, regardless of whether the tool and the problem are well aligned at all.    Economists tend to think primarily in terms of economic instruments  (tax/spending) and perhaps to economic diagnoses.  I suspect the results also tell you something about just how centre-left oriented (a big place for smart government and clever interventions) economists as a group (whether in government or academe) have become.

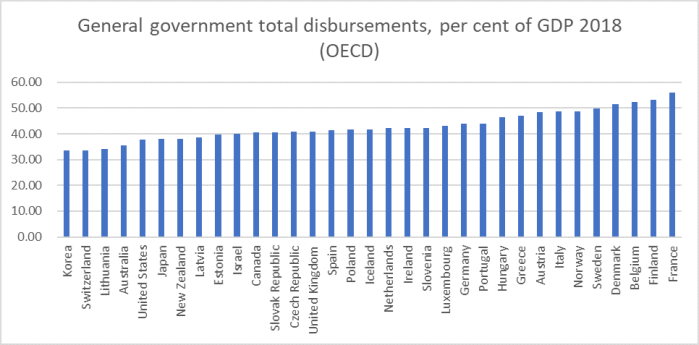
Because it is not as if Europe doesn’t already have quite a lot of government spending.   Here is the OECD measure of general government outlays as a share of GDP (in the Irish case, it is as a share of modified GNI –  a measure the Irish authorities use to adjust for the international corporate tax distortions to reported Irish GDP).

gen govt 2018.png

There are a few small European countries down the left-hand end of the chart but every single one of the top 22 government spending OECD countries are European, and not one of the non-European countries has government spending in excess of 40 per cent of GDP.   Where do people worry about European “populism”?  Well, one reads stories about France (Le Pen), Italy, Austria, Germany, Hungary, Poland and so on.  A few years ago the concern was Geert Wilders in the Netherlands.  And, of course, there is Brexit.  Every single one of those countries is in that top-22 group of really rather large spenders.

Perhaps those big-spending Europeans are, in many cases, spending a bit less (share of GDP) than they were 25 years ago  but it is hardly a climate where government spending is at minimalist-government levels (even Korea is now over 30 per cent of GDP).  And yet these expert economists want even more taxes and spending?  Perhaps doing so wouldn’t dash longer-term growth and productivity prospects –  some of the countries with the highest average labour productivity are also among the group of largest spenders – but when your starting point is the highest rates of government spending anywhere, it is hard to believe that more spending, more tax, could be more than a very short-term palliative, buying off the symptoms of discontents for a few months or years with more bread and circuses, without actually dealing with the root causes (whatever they are) behind the various phenomena the economists had in mind when they use that “populist” label.  Brexit sentiment will dissipate because a UK government chooses to spend more like a Continental?  Seems improbable.  The popular support for Viktor Orban will dissipate if Hungarian governments increase government spending from 10th highest in the OECD to, say, 5th?  Again, it doesn’t seem to get to grips with what bothers voters, or Orban. (Or, outside Europe, Trump as a phenomenon of insufficient government spending? Really?)

In fairness, I guess the questions don’t invite the respondents to offer a menu of possible responses.  Perhaps many of them think things other than more government spending are equally, or more, important.  But the overwhelming support for more government spending/tax gives a pretty strong hint that they think simply spending more money, perhaps more smartly, is an important part of responding to those concerns they so much dislike.  My own suspicion is that is more a case of “physician heal thyself” –  that today’s “elites”, with no particular claim to legitimacy (can’t point to God, heredity, sustained military virtue or anything more traditional), might look in the mirror and reflect on themselves, their values, aspirations and behaviours.  Perhaps they lay claim to having “technical expertise”, but it doesn’t (probably shouldn’t, other than as advisory input) count for much –  even if sound –  if conflicting values are at stake.   Do today’s establishment leaders invite trust and confidence?  It doesn’t look that way to me (in New Zealand either) and so it seems unlike that simply tossing more money at the situation is anything like a big part of “the answer”.

But Europe’s top economists, rightly or wrongly, see things differently.

Policy costings office: a perspective from Australia

Over the years I’ve written a fair bit here about the idea of some sort of independent fiscal analysis body (most recent post here, with links to earlier ones).   There are ever-increasing numbers of such agencies around the world, partly because the EU says each of its member countries has to have one.  As I’ve argued here, I think there is a reasonable case for some sort of such body here – small and focused on all macro policy rather than just fiscal policy – but I’ve become increasingly sceptical of the sort of direction the current government has chosen to take.   They seem to be looking at something that serves mostly as free research for MPs costing policies, perhaps most closely resembling the Australian Parliamentary Budget Office set up a couple of election cycles ago.

The Treasury yesterday held an excellent guest lecture on the issue, with the visiting speaker being no less than Jenny Wilkinson, the Australian Parliamentary Budget Officer (CEO of the office) herself.  She spoke very well, answered lots of questions, and certainly left me (and I assume others) with a much better understanding of how the Australian system works.  Of course, as the incumbent CEO speaking in an open forum in another country, one doesn’t expect her to highlight any weaknesses or pitfalls but it was very valuable nonetheless.

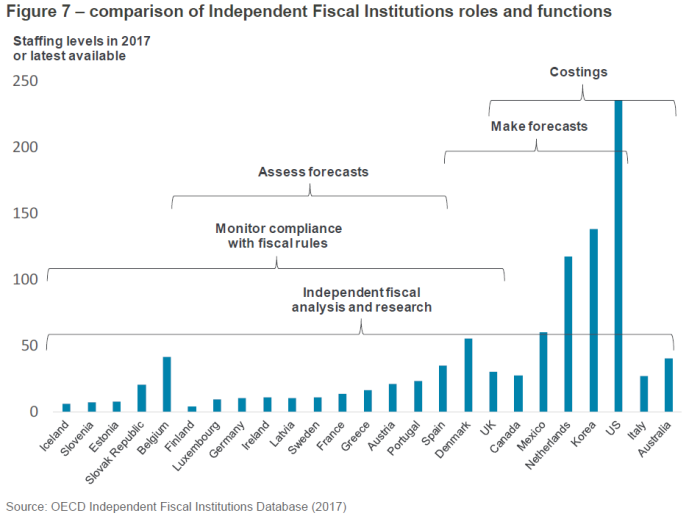
Wilkinson included in her presentation this chart, used in our own government’s consultation document, categorising the responsibilities of the various independent fiscal offices around the advanced economies.

fisc council chart

Not many such agencies do policy costings for political parties.  Of those that do, all are in much larger economies than New Zealand.  And the US CBO is largely an adviser to Congressional committees, not costing proposals for candidates for office.

Small countries don’t have this sort of state-funded function.  One reason might be that there really aren’t many economies of scale.  Policy is probably no more complex in Italy or Australia (right hand of the chart) than in Iceland or Slovenia (left hand end) but there just aren’t so many resources to throw around in smaller countries.  Wilkinson told us that her office has about 45 staff, scaling up to around 55 around elections, and as if to confirm my prior that there aren’t many economies of scale she told us that Victoria’s own state PBO doesn’t have many fewer staff than her federal version.  Given that states and the Commonwealth between them do all the stuff our central government does –  and such an office has to be able to handle issues in any area of policy more or less on demand – it is hard to see how a high quality operation (and the Australian office appears to be one) could be run in New Zealand with fewer than 40 staff.  By contrast, the Parliamentary Commissioner for the Environment reports that it has 20 staff, and the Productivity Commission has three commissioners and about 15 staff.

As Wilkinson noted, every country’s fiscal institution has its own backstory.  One of the reasons I’ve been sceptical of a New Zealand costings agency is that, having followed New Zealand politics closely for 40+ years, it isn’t obvious when, if ever, a modern New Zealand election has turned on specific policy costings.  Wilkinson told us that the origins of the PBO relate to the period after the 2010 Australian election when both the Coalition and Labor were vying for the support of independents to form a government, and one of the independents insisted that both parties submit their programmes to the Commonwealth Treasury and the Department of Finance for costing.  Under the (rather loose) Australia rules, the (Labor) government’s policies had already been costed by the bureaucrats, but when the Coalition programmes were evaluated the officials reckoned there was a significant fiscal hole.    She went on to claim that in almost every election back to 1987 there had been significant debate about costings (of opposition parties) and that some elections “may” have turned on that (she didn’t given details of which, or how).  In the last two elections she claimed that use of the PBO has meant that costings are just no longer an election issue.

As she spoke there was discernible titter around the room, clearly remembering the “fiscal hole” debate before our own last election.  But I think it is wrong to think the Australian experience is relevant to that episode, which wasn’t about the cost of any specific programmes (which is what PBO evaluates for parties) but was mostly about the overall fiscal parameters and just how tight they’d prove.  As far I could tell, nothing in what a policy costing body was doing would have changed that debate (which resulted more from the current New Zealand focus on debt targets, of the sort they don’t really seem to have in Australia).

Another aspect of the presentation that surprised me was (a) the number of costings the PBO does, and (b) the extent to which demand is not concentrated just in the pre-election period.  In fairness, she noted that the latter had surprised them too.  In the most recent year (an election year) they’d done 2970 costings, while in the previous two non-election years they had averaged about 1700 costings. Only MPs can request costings, and there are 227 MPs (across House and Senate).     Those numbers don’t mean 2970 separate items of policy, as many of the costings will be, in effect, rework as members or parties iterate towards a policy that meets their ends and will be scored by the PBO as not costing too much.

In many respects, the PBO seems to operate as a (in NZ parlance) “shadow Treasury”.  The PBO is apparently required to use the same economic parameters etc as the government is using (through the Commonwealth Treasury and the Department of Finance), so there is no independent view on how the economy or programmes might work.  What the PBO is doing is, in effect, telling parties how the Commonwealth bureaucrats would score/cost their policies if they found themselves in office after the election. I guess that has some uses, but it is hardly independent advice or an alternative perspective –  it not only cements the dominance of existing parties in Parliament (since only existing MPs can use it) but cements the dominance of the paradigms and models of the existing public service departments.

Related to this, and in answer to a question from me, Wilkinson observed that what the PBO can best do is cost programmes that represents small deviations from the status quo (they have good tools to estimate direct and immediate fiscal costs/gains) while wider economic second round effects, and the associated fiscal impacts, are likely to be small.  But, and using her own (deliberately extreme) example, if some party were to campaign on getting rid of the welfare state, her office could do the direct fiscal costs, but could offer little or nothing on the wider economic (or social) effects of such a policy, including the possibility that it might have large long-term indirect fiscal implications.    They will only offer qualitative statements about those wider effects.  Which left me thinking that the the PBO probably does very well on things that don’t matter that much, and can’t offer much on the bigger issues that elections probably should really be about  (whether about the welfare state, climate change, productivity or whatever).     We don’t devote 45+ FTEs to a specialised institution to help parties develop their welfare or productivity policies.   And while fiscal costs will always matter, arguably reasonably credible aggregate fiscal rules (commitments to surpluses or low debt) provide most of the effective discipline that is needed (at least, that would be my interpretation of the last 25 years of New Zealand).  Plans change in office, as do economic and political circumstances.

Another thing not to like about the PBO model is that it operates in secret.  Costings are not published by the PBO before an election (although the PBO will correct things if a party mischaracterises material PBO has provided them), whereas (in NZ) the Official Information Act would generally, and appropriately, apply to work and costings undertaken by executive government agencies at public expense.

From a New Zealand perspective, I’m also not persuaded how important detailed programme costings are.  Australia has an electoral system that usually produces a majority (in the lower house) government from a single party/bloc.  We don’t.  At least while we have a party (or parties) who can go either way after an election, any election manifesto is really little more than an opening bid.  Sure, there is more onus on the big parties to have a decent set of numbers, but (say in 2017) both knew that whatever they took into the election would, in government, depends on what price they had to pay to secure New Zealand First support (and, in Labour’s case, on how large the Green share of the centre-left vote was).  Perhaps you might spend a lot on detailed costings (of the PBO sort) of the service was free to the user, but what real value is there to the public in that service.  Especially when, for example, New Zealand First has never been a party unduly focused on providing lots of detail in its manifestoes (somewhat rationally so, since what they can actually get will depend on vote share and coalition partner –  they don’t expect to lead a government themselves).

I could go on, but that is probably enough for now.  As I say, it was a very useful presentation (I hope Treasury makes her slides available) from a technocrat’s technocrat.  I’m left sceptical on two main counts:

  • first, whether elections ever much do, or really should, turn much on precise fiscal costings. Perhaps it appeals to inside-the-Beltway technocrats to conceive of that model, but I see elections as mostly about things like competing visions, competing personalities, competing diagnoses, and competing claims to competence.  If so, why spend so much on highly-detailed and expensive state-funded costings, that the parties themselves don’t think it worth spending their own money on?
  • second, we should think harder about the whole panoply of support and information etc we provide to political parties and the public, preferably without further reinforcing the favoured position of established large parties.  Thus, it is interesting to note that written parliamentary questions are much much less used in Australia, as a way of garnering information, than is the case in New Zealand. (“In the years 2008–2014 only about 8 questions in writing were being asked each sitting day, but this number increased to 19 in 2015, and was 14 in 2016.”).   What about better resourcing select committees (to me a better use of money)?  And if we threw in a free PBO service, should we reduce existing money parliamentary parties are funded with?  If not, why not?  And would resistance to that idea suggest the costings were some epicurean nice-to-have rather than a central element of a well-functioning democracy?  And then, of course, there is the OIA.  Mightn’t it be better to require agencies to release documented costings models themselves, in ways that would allow political parties and their consultancy firms to use them to the extent they judge appropriate (and not otherwise).

And if I had the analytical resource implied by 40-45 more staff and had to deploy it somewhere in the public sector, it is far from obvious that a policy costing operation (with supporting analysis and research as the PBO) would offer the highest benefit-cost ratio

IMF: telling it like it isn’t

Since New Zealand joined the International Monetary Fund almost 60 year ago now –  amid all sorts of controversy we were very late to join – their officials have produced a report (Article IV consultation) on New Zealand’s economy every year or so.  These reports used to be held very closely –  which might have made for more free and frank advice – but these days they are routinely published for most countries (including New Zealand).    I’ve participated in quite a few of these reviews over the years, in New Zealand, in other countries where I’ve worked, and in my time on the board of the IMF.  I increasingly wonder why they bother.  For most countries, there isn’t an obvious gap in the market for economic commentary requiring a supranational agency to fill, and if there is occasionally some really good analysis included with the published report, it is rare for the IMF to be adding very much value.  That has long been so in New Zealand.

The IMF once had a fearsome reputation as a nest of fairly hardline ‘right wing’ economists.   The reality of hard budget constraints can have that sort of effect.  And bankers will put conditions on their loans.

But, of course, the IMF doesn’t really have an independent existence.  It is governed by an Executive Board meeting in near-permanent session, where the clout is held by Executive Directors appointed by, and dismissable by, the governments of larger economies and –  reasoanably enough I suppose –  the actions and words of the IMF tend to reflect the politics and preferences of the shareholders.   It isn’t that the Managing Director is unimportant, but the Managing Director gets and keeps her job, and her effectiveness, by keeping onside with the shareholders.   Good money gets thrown after bad –  in places like Greece, Pakistan, and Argentina –  to reflect these shareholder political preferences.  Sometimes the MDs even have personal political and career ambitions to pursue, in turn usually dependent on the goodwill of major shareholders (bearing in mind that every single MD  –  including the next one – has been from Europe.   Except perhaps on quite narrowly technical points, it doesn’t make sense to think of Fund’s view apart from the politics and preferences of the governments that dominate it.    Like the OECD, that makes it part of the centre-left consensus on most things.

But there are also lower-level institutional incentives.  The IMF wants to be “helpful”, it wants access, and its mission-team leaders want to be promoted to more important responsibilities.  When dealing with normal countries with reasonably normal governments, there is quite an incentive to make nice, to talk up things the government you are dealing with is fond of, not to make much of consistency through time (governments change after all).  All compounded by the tendency for Fund missions to weigh in on stuff they really don’t know much about at all (staff tend to have a great deal more macro expertise than that on, say, productivity or housing –  reflecting their formal mandate –  and New Zealand being a somewhat idiosyncratic economy, and staff turning over quite quickly, few really know much about New Zealand).

The latest Article IV report for New Zealand was published on Saturday.   Being dropped into a news deadzone (only accentuated by the RWC) presumably the government –  which has its say on timing –  wanted even less coverage than the little attention these reports usually get in New Zealand media.

Which was odd in a way because in many respects the document  –  at least the headline bits –  could have been published by a government PR body.   There was, for example, that talk about the “solid” economic expansion which must have been welcome, at least until one dug down a few paragraphs and found that staff recognised that any relatively decent performance, albeit (as they note) with skewed downside risks is coming only from supportive macro policy (fiscal and monetary), not from any robust long-term foundations.  Oh, and that they thought that the unemployment was now lower than could be sustained.

Lots of policies were deemed “appropriate”, but with little or no supporting analysis it was hard to know why we should agree with the social democrats from Washington.  Last year the Fund seemed keen on a capital gains tax, but this year –  free and frank advisor role notwithstanding –  the waters have apparently closed over that option and it gets no mention at all.  Last year, Kiwibuild was talked of positively, while this year’s report –  written weeks ago –  is left with vague talk of resets, “key programs still need to be calibrated” etc.

It is on the productivity front that the Fund is perhaps the most far-fetched.    Buried deep in the report is this chart (of OECD data)

IMF MFP 19

Which is a chart so bleak it could almost have originated here.

They also note that business investment has been weak this decade.

And yet, like our own government agencies I guess, they include projections in the report suggesting that total factor productivity growth is just about to accelerate away again, and that lots of capital-deepening business investment will also occur over the next five years (projections to 2024).    From a quick glance at global or domestic bond markets, you’d have to think that market pricing doesn’t really agree with the Fund.   Oddly, when they comment explicitly on the productivity projections we are told to expect this renewed growth because of “cost control and efficiency gains”.  Well, maybe…..

But, or so we are told by the IMF, there is in fact a promising productivity-focused policy agenda already being implemented by the government.  Perhaps you missed it. I did.

But here is what the IMF has in mind

Addressing long-standing low productivity growth continues to be a central concern. In this respect, some important first steps have been taken, including the introduction of a new R&D tax credit regime; the creation of the New Zealand Infrastructure Commission to help in closing infrastructure gaps; and the reform of the vocational education and training sector.

and, elsewhere in the same document

Within the greater focus on wellbeing under the Living Standards Framework, the government has a roster of policies to foster productivity growth. These include introducing an R&D tax credit regime, continuing to increase education spending, creating a New Zealand Infrastructure Commission to enhance procurement and delivery and set up of an infrastructure pipeline, using wage increases to further more inclusive growth, and fostering regional development through the Provincial Growth Fund and greater focus on regional immigration to align immigration of skilled labor with employers’ needs in the regions.

Spare us.

In case you are wondering that “using wage increases to further more inclusive growth” appears to be a reference to the government ramping up the minimum wage, combined with some modestly-sympathetic references to the proposed Fair Pay Agreements.  If you think those two will boost TFP growth (whatever you might think of the “fairness” arguments), I’m sure someone has all manner of scam projects to sell you.

Or perhaps it was the Provincial Growth Fund –  which no credible observers thinks is likely to lift economywide productivity –  or fees-free tertiary education (“continuing to increase education spending” –  and last year the Fund was explicitly keen on something like fees-free).  I haven’t focused on vocational education reform, but count me sceptical that it is going to make much sustained difference to economywide productivity.

I get that outfits like the Fund like interventions like R&D tax credits. Perhaps it will even make a difference (although I’m sceptical) but the Fund’s supporting “analysis” seems to be no more than “R&D spending in New Zealand is low, so we should have more government subsidies”, with no analysis for why firms haven’t regarded it as attractive to spend more themselves.  And, who knows, perhaps the Infrastructure Commission will do some good work, but (a) it makes no spending decisions, and (b) the government’s own actual infrastructure choices have been more about keeping the Greens happy than about having a credible chance of enhancing productivity growth.

Oh, and it wouldn’t do to skip the other reform the Fund seems most keen on –  it features in the covering statement.  On housing, they seem still right with the government

The reform of the institutional structure, including the establishment of the Ministry of Housing and Urban Development, should help in implementing housing policies. Further work is needed to complete the agenda, including enabling local councils to actively plan for and increase housing supply growth.

(with no mention at all of initiatives that at least some regard as signficant backward steps)  but they still want action on tax, this time an even flakier option

Tax reform, such as a tax on all vacant land, should also be considered.

Again with no supporting analysis whatever.  (Land value rating would be the more sensible, and feasible, option in that space.)

And, bottom line surely, despite having a spiffy new bureaucracy “house prices are expected to continue rising under the baseline economic outlook”.

The other point from the report that I wanted to touch on here was around the Reserve Bank’s bank capital proposals.   The Fund is keen.

The proposed higher capital conservation buffers would provide for a welcome increase in banking system resilience. The new requirements would increase bank capital to levels that are commensurate with the systemic financial risks emanating from the banking system.

Of course, there is no supporting analysis for that proposition either. In a a short report perhaps that might be too troubling, except that as I have pointed out before this seems to be a classic example of the Fund simply going with the flow and echoing whatever the authorities happen to favour at the time.    Don’t want to make life awkward for our mates at the Reserve Bank, I suppose.

Here was what I said when the Fund mission released their concluding statement at the end of their visit to Wellington

They are not much more than a couple of sentences in a press release, with no published supporting analysis.  And the Fund almost always backs the authorities – who are the people they talk to mos?t  –  especially when central banks and regulators want to put more restrictions on banks. Why wouldn’t they?  Any economic costs don’t sheet home to them.  But the IMF’s support isn’t without its problem for the Reserve Bank.     Here is what they said

The new requirements would increase bank capital to levels that are commensurate with the systemic financial risks emanating from the dominance of the four large banks with similar concentrated exposure to mortgages, business models and funding structures.

Which, by logical deduction, appears to be saying that current levels of capital are grossly inadequate to the risks the New Zealand banking system faces. But there was no hint of these serious risks in past Financial Stability Report from the Reserve Bank (although they amped up the rhetoric in the latest one), and –  perhaps more to the point –  no hint of that in past IMF Article IV staff reviews or Executive Board discussions.  This snippet is from last year’s Article IV report, published as recently as June last year.

IMF capital

Not a word from staff, from the Board –  or, indeed, fron the New Zealand authorities in their published comments –  of a pressing need for a huge increase in minimum capital ratios.

In other words, take what the Fund says with a huge bucket of salt.    And if, perchance, the Governor has second thoughts and doesn’t go ahead with large increases, probably next year the Fund would be back to tell us that was “appropriate” too.

As I say, I really struggle to see the value of the Article IV reports.  At one level, perhaps that reflects the fact that the Fund is a macro agency, and macro policy has been where New Zealand –  all on its own –  has done pretty well over the last 25+ years (low government debt, low stable inflation etc etc), and where we face hard issues the Fund has little or nothing to offer except the institutional sympathies of the centre-left.  But it isn’t as if New Zealand is the only place where they struggle to add much value, or make much difference to important debates in a timely ways.  If it were wound up – rarely ever happens to international agencies of course –  it is hard to see how the world would be the poorer.  Some officials would be – and I had several very remunerative years on their payroll –  but not obviously the world, and certainly not New Zealand policymaking or economic analysis.

The Fund does often publish some research done in association with the Article IV report in a separate document. They have done so again this time.  I haven’t yet read the paper in full, but on skimming through it there look to be some points worth coming back to later in the week.


Inane crude economic nationalism

I picked up the Dominion-Post newspaper from the front step this morning to find this blaring back at me.

Kiwibank 1

The second page was entirely green, with a little Kiwibank logo and the twee marketing  line “Kiwis backing Kiwis”.  (I guess advertising must have been more expensive in the Herald, where it is “just” wrapped round the sports section).

Rarely had I ever been more glad that I’d never been tempted to shift my banking business to the state-owned Kiwibank.  The crude nationalism on display today was at possibly an even more inane level than the last such NZ-owned bank’s advertising campaign I wrote about

TSB photo.jpeg

That one was on display at the heart of New Zealand’s “globalist-central” (if there were such a place), just over the road from the New Zealand Initiative, and a few hundred metres from places like MFAT, MBIE and The Treasury.   If it had any merit, at least that campaign did have some modicum of substance to it: at least some of the profits of foreign-owned banks are in fact remitted abroad (as the profits –  whether from Wellington, Auckland or wherever – of Taranaki-owned banks are, at least in part, remitted to…..Taranaki).   What of it you might reasonably ask, but at least there is some factual foundation.

But the Kiwibank campaign takes leave of all rational foundation to suggest, quite blatantly, that somehow if you bank with an Australian-owned bank (as most of us do) you are not only disloyal, but actually supporting the Australian rugby team.  How one wonders?  I know it isn’t the cricket season today but isn’t the evil ANZ one of the biggest sponsors of New Zealand cricket?   It is just nonsensical –  all the more so for running wrapped around newspapers produced by two separate foreign-owned and controlled companies.    Are we “disloyal” –  and somehow supporting the Wallabies –  for reading the Dominion-Post?  

From my previous post

I didn’t move to Korea and yet the screen I’m typing to was made by a Korean company, and the profits from its design and manufacture presumably accrued to the owners of Samsung.   I didn’t move to the United States, and yet the platform this blog uses is (I think) American, and the profits from what I pay for using it accrue to the owners of that company.   One could go on –  the car, the printer, the TV, the bottle of French wine, or those Californian oranges in the fruit bowl.  The jersey I’m wearing is American and the books on the shelves next to me are from all over the Anglo world –  there will (producers hope) have been profits associated with each of them. 

To which I could add the Ecuadorian bananas in the fruit bowl, the Iranian dates I was baking with this morning, and the phone I was using, with componentry from all over the world.  And, of course, there are New Zealand –  the suburban bakery where I picked up the bread for lunch, or the supermarket (which perhaps I’m suppposed to feel even better about because it is part of a co-op, although what I’d prefer was some plastic bags for my groceries.

Most of us rarely give much thought to the nationality of the owners of the companies who produce the products and services we purchase.  No one supposes that owning an Apple phone means we are “supporting” the United States.  Mostly, that makes a great deal of sense (even if those Iranian dates sometimes do make me pause and I wouldn’t be buying a Huawei phone).  I’m glad my bank has been in New Zealand since 1840 – not one of these johnny-come-lately operations –  and that the capital behind it is provided voluntarily by its shareholders (from around the world, if no doubt disproportionately from Australia) rather than taken from taxpayers by coercion to invest in a bank that has struggled to earn a decent rate of return over its life so far and where there is little or no effective accountability for its operations or actions.

I presume Kiwibank has highly-paid marketers who tell them this sort of campaign “works”. Perhaps it plays especially well with politicians like Shane Jones.  But even if it does, it is something that shouldn’t be encouraged.  And the sentiments particularly shouldn’t be indulged/fed or whatever by a wholly state-owned company, whose owners strut the world proclaiming their commitment to open and multilateral trade, rules-based orders, and all that.


Tradables and non-tradables

Every so often I get round to updating my charts of some indicators of the relative performance of the tradables and non-tradables sectors of our economy.  With new GDP numbers out yesterday, now seems as good a day as any.

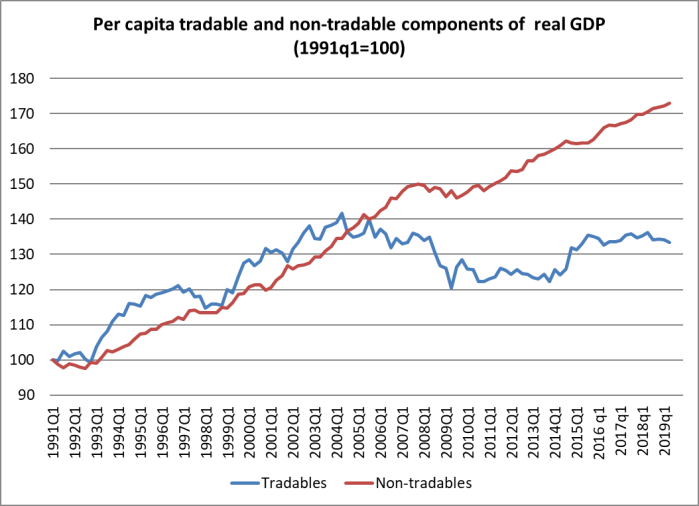
This is my headline chart.

T and NT to june 19

Here tradables is a rough and ready aggregation of primary sector and manufacturing GDP (from the production GDP numbers) and exports of services (from the expenditure GDP series).  Non-tradables is the rest (of GDP).   The idea is to split out those sectors which face international competition from those that don’t.     It is no more than an indicator, and people often like to point out the components of “non-tradables” where, at least in principle, there is international competition.   But as a rough and ready indicator, it serves its purpose.   It was first developed by a visiting IMF mission about 15 years ago to help illustrate how one might think about the impact of a lift in the real exchange rate.

You will recall my line (oft repeated) that really successful economies tend to be ones with really robust tradables (and exports –  although the two aren’t the same thing) sectors.  Not because tradables are special, but because success in the (much bigger) wider world market, or against the wider world of competing producers, is an indicator about something going right in your economy.

Whereas in New Zealand, the economy appears to have become increasingly skewed towards non-tradables.  In per capita terms, there has been no growth in this indicator of tradables sector GDP since 2002 whereas the non-tradables sector has grown by 40 per cent.   There have been a few ups and downs in that tradables line of course.  There was some brief encouragement in that lift a few years ago, but the new level is nothing to write home about.  If anything, the tradables line looks to be tailing off again, at least a bit.

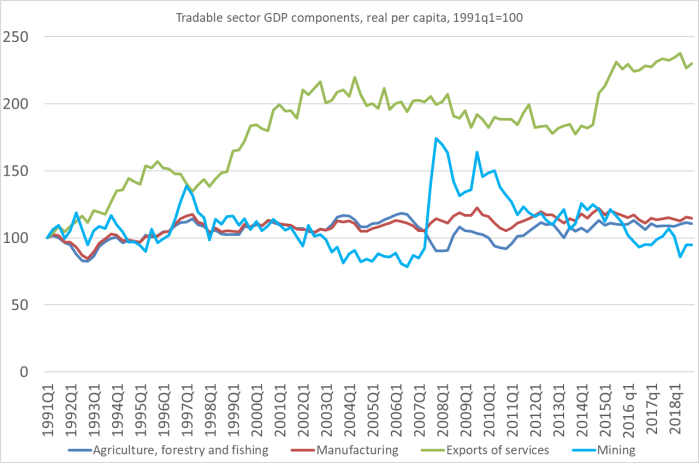
There are people out there who really really don’t like this indicator.  So for them, and to shed a bit more light on what has gone on, here are the individual components of the tradables line.

T components.png

In real per capita terms:

  •  mining sector GDP is a bit less than it was at the start of the 90s,
  •  manufacturing sector GDP is just a bit below the level first reached in 1997, 22 years ago,
  •  for all the dairy intensification, forest plantings etc, the same is true  of agriculture, forestry and fishing –  just a bit below the level reached 22 years ago.

Actual real GDP for all three sector has risen quite a bit, but there are almost 1.2 million more people than there were in 1997.

What of services exports?  They have grown a lot, even in per capita terms. But the growth was a generation ago now: real per capita services exports more than doubled between 1991 and 2002.  Since 2002, there has only been about 6 per cent growth, in total. Over 17 years.

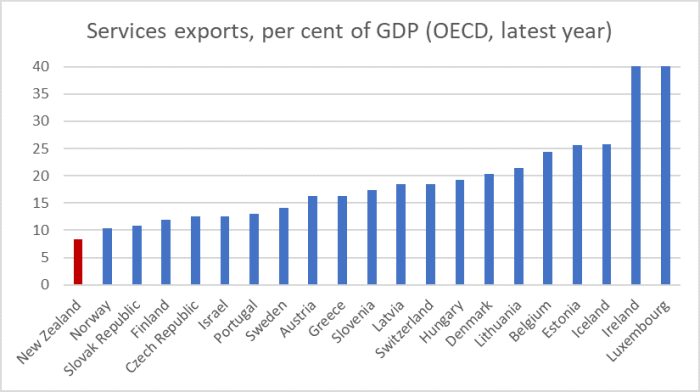
And some context on services exports from last week’s post.

services exports small OECD

New Zealand has the smallest share of services exports in GDP of all these smallish OECD countries –  and by quite a margin.       And it isn’t as if we are closing the gap.   Over the last 20 years, services exports as a share of GDP have barely changed in New Zealand (with some ups and downs) while for the median of the other smallish OECD countries, the increase was 6.7 percentage points of GDP.

It is hard to (rapidly grow) exports from New Zealand.  Distance is a big obstacle (at least for anything other than natural resources), and so are regulatory limits (some probably warranted, others probably not) on the utilisation of the fixed stock of natural resources.

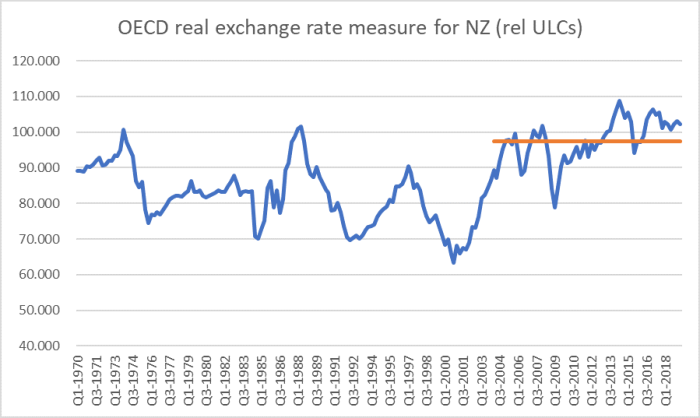
But it always pays to keep an eye on the (real) exchange rate.  One way of looking at the real exchange rate is the price of non-tradables relative to the price of tradables.  That has been rising substantially in New Zealand.  The other is simply to use one of long-term international indices, deflating a nominal exchange rate index by some measure of costs and prices.   This is a chart I’ve used every few months

rel ULcs

Sure, the exchange rate has been falling a bit in the last few months (the chart is quarterly and thus only  up to June) but it is nothing out of the ordinary relative to the average level for the last fifteen years  –  which was far higher than the average for the previous few decades (since, say, the mid-70s).

There is nothing wrong with a high real exchange rate –  in fact, it is a natural outgrowth –  if your economy is doing well and generating consistently strong productivity growth relative to the rest of the world.   But, of course, that isn’t the situation in New Zealand.   The government doesn’t directly set the real exchange rate –  and the Reserve Bank has very little influence on it beyond the short-run –  but government policy choices have helped skew the economy in ways that mean the tradables sector has been squeezed, such that we’ve had almost no growth in real per capita tradables sector GDP this century.

And no political party in Parliament seems to have any real idea about how to change that, or any real desire to address seriously the issue.

Productivity growth across countries across time

This tweet caught my eye this morning.

The chart is from the latest weekly column from Martin Wolf, the economics columnist for the Financial Times.   It is a sobering reminder of what has been happening among economies rather nearer the frontier: productivity growth recently isn’t what it once was (even if the 50s and 60s are hardly representative historical decades).

But, of course, my main interest is in New Zealand.  And for OECD countries I prefer to use OECD data (which go back only to 1970).    Here is what a similar version of the chart above looks like using OECD data and adding Australia, Canada and New Zealand.   As with the chart above, I’ve ordered the countries from high to low based on average productivity growth in the most recent period (in this case, the last five years).

Real GDP phw OECD

In that most recent period (and, actually, for this decade as a whole) France has had the fastest productivity growth –  not something I’d have guessed –  and New Zealand brings up last place.  It isn’t that the green bar is missing for New Zealand, just that the average annual growth rate on this measure was 0.0 per cent. (Using my preferred measure of labour productivity growth, updated to include this morning’s release we do a little better for the last five years –  we come second to last (ahead of Italy) instead.)

And, of course, the pattern for New Zealand is a little different because we had that truly dreadful decade in the 1970s, when our productivity growth was clearly the worst in the entire OECD.

But here is how we’ve done simply relative to the G7 group as a whole.

NZ and G7 gdp phw

In not a single period has our productivity growth rate matched that of the G7 grouping as a whole.  We came close in the 1980s, but couldn’t match those leading industrial countries even then.  (And for the most recent period that conclusion holds even if use my preferred measure of New Zealand labour productivity.)   And whereas back in 1970, the level of labour productivity in New Zealand was very similar to that for the OECD as a whole, those growth differences cumulate, and now the G7 group has labour productivity just over 50 per cent higher than that in New Zealand.

Is something better possible?   Well, there is a loose relationship suggesting (as one might expect) that countries that had a lower starting level of labour productivity were also those with relatively faster productivity growth in recent years.  Catch-up can and does occur.   There were 10 OECD countries –  more than a quarter of the membership –  which had faster productivity growth than France over the last five years, often materially faster.    All of them were small.

That could have been New Zealand too –  after all, we now start so far behind the leading bunch –  but policy choices by successive governments (much the same regardless of which party occupies the 9th floor of the Beehive) meant it wasn’t so, and left us vying with places like Italy, Portugal and Greece (even the UK) for the unwanted poor performer award.


Making short-term foreign labour more readily available

There were, and still are, people who thought Labour and New Zealand First went into the last election campaigning on policies to materially and sustainably reduce the very high rates of non-citizen immigration to New Zealand.  (There were no such doubts about the Greens: after James Shaw in 2016 gave a fairly thoughtful and moderate speech on the issue there was a great backlash from his own supporters and he had to recant and do a very public form of penance.)

But what of Labour and New Zealand First?  It seems that under Andrew Little Labour had become quite concerned about immigration and thought there were votes in suggesting that “something should be done”.   But as I pointed out when their 2017 immigration policy specifics were released, whatever impression they wanted to create, any measures they were proposing would have reduced the net inflow for one year only.  Some of those proposals had some merit in their own right, but they were playing at the margin, while allowing Labour to associate itself with numbers of a 25000-30000 reduction in net migration.   Labour is quite correct to claim that they never set that as a target (it was a forecast, about what difference they thought their proposals would make), but they never owned up to the fact that any reduction would be one-off, not permanent.     Either way, even before the election –  after the change of leadership –  they were backing away from even their own published policy (checking old emails, I found one from a week out from the election in which a senior and well-connected journalist told me that Ardern and Lees-Galloway had taken a conscious decision to downplay the issue).

As for New Zealand First, there was occasional talk of reducing net migration to 10000 to 15000 per annum but (a) it wasn’t in their immigration policy, and (b) not much specific was.  Both parties seemed to want to create the impression that they would “do something” (note that National had actually “done something” –  albeit fairly modest – that year) without actually offering much in the way of specific commitments.  NZ First, of course, has 25+ years of form in that respect.    I guess not many voters read the specifics of manifestos (although media should) and so it is hard to have much sympathy for the parties when people now look at what the government is (and isn’t) doing and suggest that it doesn’t really square with the impression they were happy to create pre-election.

At times, it is hard to know quite what they are doing.   Actual residence visa approvals for the year to August were 34863, the lowest annual rate this century.   But that isn’t supported by any high-level policy changes and from all the accounts of massive backlogs of applications at MBIE –  having reduced its processing capacity –  it isn’t clear that it is deliberate (and if it is deliberate, it is a pretty callous way to do things, leaving applicants hanging uncertainly with indefinite delays).  And on the other hand, the number of Essential Skills visas approved in the year to August was a record high, and about twice as many as were being approved five or six years ago.  On MBIE’s figures there are almost 200000 people here with short-term work visas (consistent with that OECD comment that New Zealand has one of the highest –  perhaps the highest –  shares of short-term foreign workers of any OECD country).

But yesterday we got some specifics from the government in the form of a new policy on temporary work visas.  In thinking and writing about New Zealand immigration policy, my focus is on the residence approval programme –  which is what drives the longer-term contribution of immigration to population growth –  rather than the shorter-term visa programmes.  But reading through what the government released yesterday, it was hard not to call it a triumph for the business community (short-term) at the expense of New Zealanders (those two aren’t necessarily in conflict of course, it is just that there is no evidence that New Zealand’s liberal immigration policies have done New Zealanders any good).  As the Newsroom article this morning puts it

As soon as the embargo lifted on the Immigration Minister’s announcement on Tuesday, positive press releases flooded in from industry associations whose employers rely on imported labour, including Federated Farmers, Horticulture NZ, Business NZ and New Zealand Aged Care Association.

They see it as a win for employers who will be able to employ overseas workers with greater ease, after passing the initial tests.

Here is the overview document the government published.

Several things struck me.

First, the government and its advisers appear to have little use for economics (yes, some of you may think that to their credit),  What do I have in mind?     There was this, for example, the very first bullet point in the entire document

Ensure that temporary foreign workers are only recruited for genuine shortages, and that employers across New Zealand can access the skills and labour they need;

When there are incipient shortages of tomatoes or lettuces (storms etc) or even houses, the price goes up.   The market then more or less clears and in most cases at the new prevailing prices there are no “genuine shortages”, rather supply and demand adjust to the signal in the price. We see that this week in global oil markets.

But neither central planners in MBIE nor their political masters –  nor much of the business community, when it comes to inputs –  are keen on that sort of approach.  They prefer a model in which wages don’t rise much because whenever there is an incipient shortage –  which would otherwise trigger wage rises –  the employer can find another migrant worker.   A good deal for firms if they get the system rigged in their favour like that, and compromising, in that any firm that had qualms about whether this was really right, couldn’t really take a stand and refuse to get involved or they really would be rendered less competitive than other firms in their sector.

And there was this in a section on “Why the government is making these changes”

The Government is committed to ensuring that regions are able to get the workers they need to fill critical skill shortages, particularly during a time of low unemployment.

Where they show no sign of realising that –  as economists in New Zealand have known for decades – increased immigration has the short-term effect (perhaps lasting several years) of adding more to demand (including demand for labour) than to supply, thus exacerbating capacity pressures in aggregate, not relieving them.   Yes, an individual firm in a sector heavily reliant on immigrant labour might be made better off, but across the whole economy it is no fix at all.  (And if the intuition of this point isn’t obvious, fortunately we mostly don’t import dirt-poor illegals living 20 to a house, so new immigrant workers need houses, shops, offices, schools, roads etc much as you or I do, and building all those things takes real resources – including labour.)

There is a strange mix of central planner tendences and genuine liberalisation at work in the package.  I guess the government would defend that on the grounds of a strong central government hand around lower-paid migrants and more liberalisation for somewhat higher paid roles (the spin is about “highly paid” or “very highly paid” jobs, but that isn’t really so at all).  On the central planner side, there were things like this

The recently announced Regional Skills Leadership Groups will play a key role in informing government and regional responses to local labour market needs. Each Regional Skills Leadership Group will develop a labour market plan for its region to identify the availability of skills and labour in their region and any gaps that need to be addressed to help drive the region’s economic growth.

Or one could use market price signals and the resulting internal resource flows.  But the government believes bureaucrats and local worthies (business leaders with their own interests to advance?) will do it so much better.

Still on the central planner side, industries that are heavily reliant on migrant labour are to be subjected “Sector Agreements”

Sector Agreements will be negotiated with sectors that have a high reliance on temporary foreign workers (especially in lower-paid occupations). Employers who are recruiting foreign workers for occupations covered by a Sector Agreement will be required to comply with the agreement. Sector Agreements will support facilitated access to foreign workers to meet shortages in the short term by making this a more certain and lower-cost process. In exchange, the sector will be required to make commitments and demonstrate progress towards placing a greater share of New Zealanders into jobs in the sector and reducing the sector’s reliance on temporary foreign workers over time.

But there is a great deal of time-inconsistency about all this.  In the short-term, rest homes, road freight etc, will get “more certain and lower cost” access to migrant workers, and yet the sectors will supposedly be signing up to commitments to reduce future reliance on such workers. It will be interesting to see the details of the first such agreements (due mid-2020) but count me sceptical about whether any government will be willing to follow through and actually insist on reduced reliance on temporary foreign workers, having initially made them even easier to get.  All those lobbies will be moaning and complaining five years hence just as they are now.    Much better to put in place some clear and graduated price signals now.

The other area of central planners’ conceit in the document is the distinction between “the regions” and five of the six largest cities (for some reason Tauranga misses out on promotion to big boy status).  This continues the incoherence of the previous government’s approach, offering more residency points for jobs outside the big cities, in the process (almost as a matter of arithmetic) lowering the average quality of the people given residence visas.

Under yesterday’s package

The requirement to undertake a labour market test will be removed entirely for employers in the regions (outside the major cities) seeking to employ foreign workers who will be paid above the median wage. This gives open access to employers in the regions recruiting for jobs paying above the median wage. This means there is no need for skill shortages lists in the regions and the skill shortages lists will only exist for the five following cities – Auckland, Hamilton, Wellington, Christchurch and Dunedin. If a job in a city is on that city’s skills shortage list there will be no labour market test; if it is not on the list then there will be a labour market test (that is, the employer must advertise the job with the pay rate).

There is no attempt at a justification for this differentiation between, say, Tauranga and Hamilton, or Queenstown and Dunedin, or even between Kawerau and Auckland.   It simply continues the planner mentality –  even if we might count getting rid of (bureacrat-determined) “skill shortage lists” in some places as a modest gain in its own right.

And from a Labour-led government –  supposedly focused on “the workers”(especially less well-off), surely it evokes a hollow laugh when they release documents talking of people earning $52000 a year as “highly-paid”.      Such has been the increase in the minimum wage over recent years –  no relationship at all to productivity gains –  that Labour now class as “highly paid” anyone earning only 40 per cent above the minimum wage.

The final bit of the package that caught my eye was this

The Government will reinstate the ability for lower-paid foreign workers to support their partner and children to come to New Zealand for the length of their visa. This was restricted in 2017. The foreign worker will continue to need to meet a minimum income threshold, the purpose of which is to ensure that their income is sufficient to support themselves and their family while in New Zealand.

….Dependent children of a lower-paid worker will have access to primary and secondary education as subsidised domestic students. They will only be able to access tertiary education as full fee-paying international students.

I guess we should be thankful for small mercies re that final sentence.  But really…..the government makes it “more certain and lower-cost” to bring in relatively low-paid migrant workers, and then –  even if there were real economic gains from that particular “trade” –  dramatically erodes those possibilities by allowing such (supposedly) temporary workers to bring spouses and children.   Given the failure of the government to anything serious about fixing the urban land and housing market, that will put further indirect pressure on the housing market (and associated infrastructure) and the (substantial) fiscal cost of any school education for the children of such workers has to be set against the (inevitably modest, in a low-skilled worker) wider economic benefits to New Zealand of the parent being able to work here.

You can see some elements of sense in some of what the government is doing in elements of this package.  Perhaps the “sector agreements” are really well-intentioned, even if they seem most likely to be ineffectual over time in reducing the dependence on these sectors on modestly-paid modestly-skilled short-term foreign workers.    And, in principle, the absence of a “labour market test” for really highly paid or specialist positions makes quite a lot of sense.  But, even in this struggling economy, it is a sick and sad joke to talk of pay rates in excess of $52000 as “highly paid”.  More importantly, there is nothing in the system designed to set a financial incentive for firms to employ locals.

I continue to champion my own model, which I’ve run in various previous speeches and posts.   For work visas, at all levels of skill, in all regions, I would apply something like the following model

Institute work visa provisions that are:

a. Capped in length of time (a single maximum term of three years, with at least a year overseas before any return on a subsequent work visa).

b. Subject to a fee, of perhaps $20000 per annum or 20 per cent of the employee’s annual income (whichever is greater).

Doing so would largely get officials completely out of the approvals process (although not from enforcement), would treat all regions equally, and would provide a strong –  and transparent –  incentive to hire (and develop) locals, and bid up wages for locals, where at all possible, while providing easier access (than any government has allowed) where a short-term foreign worker may really be necessary in the short-term.   And the fee would ensure that even if there were no other benefits to New Zealanders as a whole, at least the public finances would benefit directly.

The much bigger issue, of course, is the residence approvals programme.  The government is supposed to be having announcements on that front before the end of the year,


NZ’s company tax rate: enforcement and investment

Last week I wrote briefly about a short presentation, at a Victoria University event, by tax blogger (and former Treasury/IRD official, former adviser to the Tax Working Group) Andrea Black on what should be done with the company tax rate.  Andrea argued that it should be raised, both to collect more tax from the “rich” and to reduce the evident opportunities for avoiding or deferring tax that differential rates for company, personal, and trust income creates.

Since what I wrote about that was buried in the middle of a long post, I reproduce the relevant section here

I wasn’t really persuaded.  With dividend imputation, the company tax rate in New Zealand bears much more heavily on foreign investors (none of whom needs to be here) than it does on domestic shareholders.  In a country with low rates of business investment and now relatively low rates of foreign investment, it seems cavalier to be calling for increases in company tax rates which the global trend is clearly downwards (at 33 per cent the company tax rate would be the second highest in the OECD).   In defence of her position, Andrea invoked some old IRD analysis that company tax cuts haven’t made much difference to investment –    IRD has a strong institutional bias towards a simple tax system and little real focus on productivity, economic performance or anything of the sort – while noting that “if you did care about foreign investors” –  there were various technical tweaks (I didn’t catch them, but perhaps thin capital rules?) that could be adjusted to compensate them at least in part.

As if to forestall a question, Andrea alluded to this chart I’ve used several times –  a version of which appeared in the TWG’s own background document last year.

corp tax 2017

Prima facie, it didn’t look as though – by international standards – we were undertaxing business income.

Now, of course, there are some well-recognised caveats to this data.  First, it doesn’t take account of dividend imputation in New Zealand (and Australia, but not elsewhere), and the TWG suggested there were some issues around consistency of treatment of government-owned businesses.  On the other hand, in many countries lots of shares are owned by long-term savings vehicles with much less onerous tax provisions than their peers in New Zealand would have, and our tax system (mercifully) has fewer deductions and “holes” in it.     In yesterday’s presentation Andrea suggested that in many other countries various classes of business income that would be incorporated –  and thus captured in the chart – here wouldn’t be treated the same way in other countries.

All that said, if anyone is seriously suggesting that the chart of OECD data is substantially misleading about the New Zealand position –  say that in truth we might be in the lower half of the chart on an apples-for-apples comparison, the onus is probably on them to demonstrate that more specifically.    The OECD data itself suggests we have taxed businesses quite heavily going back 50 years, to (for example) well before imputation was ever on the scene (chart in this post).  Perhaps it is just coincidence – and I’m certainly not suggesting it is the only factor –  that business investment as a share of GDP has been low by OECD standards throughout almost all that period.

In a comment on my post, Andrea clarified that it was changes to the thin-capitalisation rules she had in mind to mitigate adverse effects on foreign investors.

I’m sympathetic to the idea that New Zealand shareholders shouldn’t be able to shelter income in companies in a way that means that some forms of flow capital income are taxed more lightly than others.  For small closely-held companies, for example, I can see a certain logic to a mandatory distribution of profits (which could then be simultaneously reinvested).

When I heard Andrea’s brief presentation last week, I hadn’t seen her initial post on the issue.   It is worth reading and she presents what looks like persuasive indications that there is more of an issue here than (for example) some people who commented on my post or got in touch privately might have suggested.   For example

Except that overdrawn current account balances – loans from the company to the shareholders- have been similarly growing too. Now sitting at about $25 billion.

And yes this all started from about 2010. And what happened in 2010? Why dear readers the company tax rate was cut to 28% while the trust rate remained at 33%.

Last night Andrea put out a further post on the issue, prompted (it appeared) by my post last week.    It is also worth reading, repeating some of the earlier material but also extending her argument.   For example, in dealing with the foreign investment issues she now suggests another possible response

If the focus was New Zealanders owning closely held New Zealand businesses, an adjustment could be made either by increasing the thin capitalisation debt percentage or making a portion – most likely 5/33 – of the imputation credit refundable on distribution.

I’ll leave you to read Andrea’s case. On its own terms, it makes a fair amount of sense on her terms (and she is much more expert on tax detail than I am) but I want to focus on the issue through a different lens.

Thus, take for example the line –  which apparently originates with IRD –  that we’ve had no more foreign investment since the company tax rate was cut.   Well, here is a chart of New Zealand company tax rate relative to the median OECD country’s company tax rate (OECD data that take account of sub-national taxes as well).

coy tax oecd

The story of the century, around company tax, is that the gap has been widening between our company tax and those in other advanced countries (with the two local cuts just temporarily closing the gap a bit). At the start of the century, our company tax rate was around the median for the OECD countries, and in 2019 it is just over 4 percentage points higher.  (One could add that the global environment for business investment seems to have been pretty poor over the last decade, not least in New Zealand.)

At present, our company tax rate –  the one that counts for foreign investors –  is just above the upper quartile.

coy tax 2

Andrea’s proposal would give us the highest company tax rate in the OECD.   One could adopt the clever wheezes she suggests to limit any adverse effect on foreign investors of raising the rate but (a) our statutory rate is already (now) at the upper end of the scale, and (b) our company tax regime is generally regarded as fewer holes and deduction possibilities etc than many of those in other countries.

And it isn’t as if business investment has been present in abundance in New Zealand.   This chart is from an OECD review of New Zealand from a few years ago.bus I oecd 2011.png

Focus on that bottom right panel.  The only time business investment as a share of GDP was above that for the median OECD country for a few years was during Think Big – the spectacular government-led misallocation of capital.  And recall that for at least the last 25 years, our population growth has been well above that of the median OECD country, so that all else equal one might have expected more of current GDP to be devoted to investment.

I’ve seen –  but can’t now find –  the OECD data for these graphs back to the 1960s and the picture is similar,  What about the more recent period?

“Business investment” is calculated as a residual. Take gross fixed capital formation and subtract investment spending on new housing and general government investment spending.  When I use OECD data for cross-country tables, I usually take care to check their New Zealand data against what is on the SNZ website.  In this case, GDP, GFCF, and dwellings investment are all identical in the two places, but the general government investment numbers are somewhat different.  So in this chart, comparing business investment as a share of GDP for New Zealand with that for the median OECD country, I’ve shown the New Zealand numbers estimated both ways (ie using OECD and SNZ gen govt investment data).

bus I NZ

Whichever line you use, business investment in New Zealand (per cent of GDP) has been materially below that of the median OECD country in most/all years, despite having had population/employment growth far faster than that of the median OECD country.

I am not, repeat not, suggesting that our company tax rate –  or the broader tax regime for capital income –  is the only factor, or even necesssarily the most important factor, in our weak business investment (and terrible productivity growth) record.   Simply that if any government were ever seriously concerned about those failures –  and wouldn’t that be a novelty –  raising the company tax rate looks as though it would be a step in the wrong direction.     If anything, in my view we should be taxing capital income less heavily.  No business has to invest – and no foreign investor has to invest here –  and if you want more of something it isn’t usually a good place to start to tax it more heavily.

And to end on a note that seems to me to –  at least on paper – better balance fairness and efficiency/opportunity, here is my final paragraph about that seminar last week at which Andrea spoke.

I remain tantalised by the idea of a progressive consumption tax. In the abstract, it gets around all the debates on capital gains taxes, realisations (or not), company taxes, gift or inheritance taxes or whatever, and has the appealing the feature of taxing people on what they consume not on what they produce.  Of course, no country runs such a system –  which does have formidable practical issues.   And if one wants to align company and personal rates – which has some appeal (although the Nordic model questions that), better to lower the personal income tax rates by 5 percentage points (max rate to 28 per cent) and add a Social Security Tax of 5 percentage points on labour income up to a certain threshold.  New Zealand and Australia are, as I understand it, the only OECD countries not to adopt some such model (we do it on a very small scale with ACC).